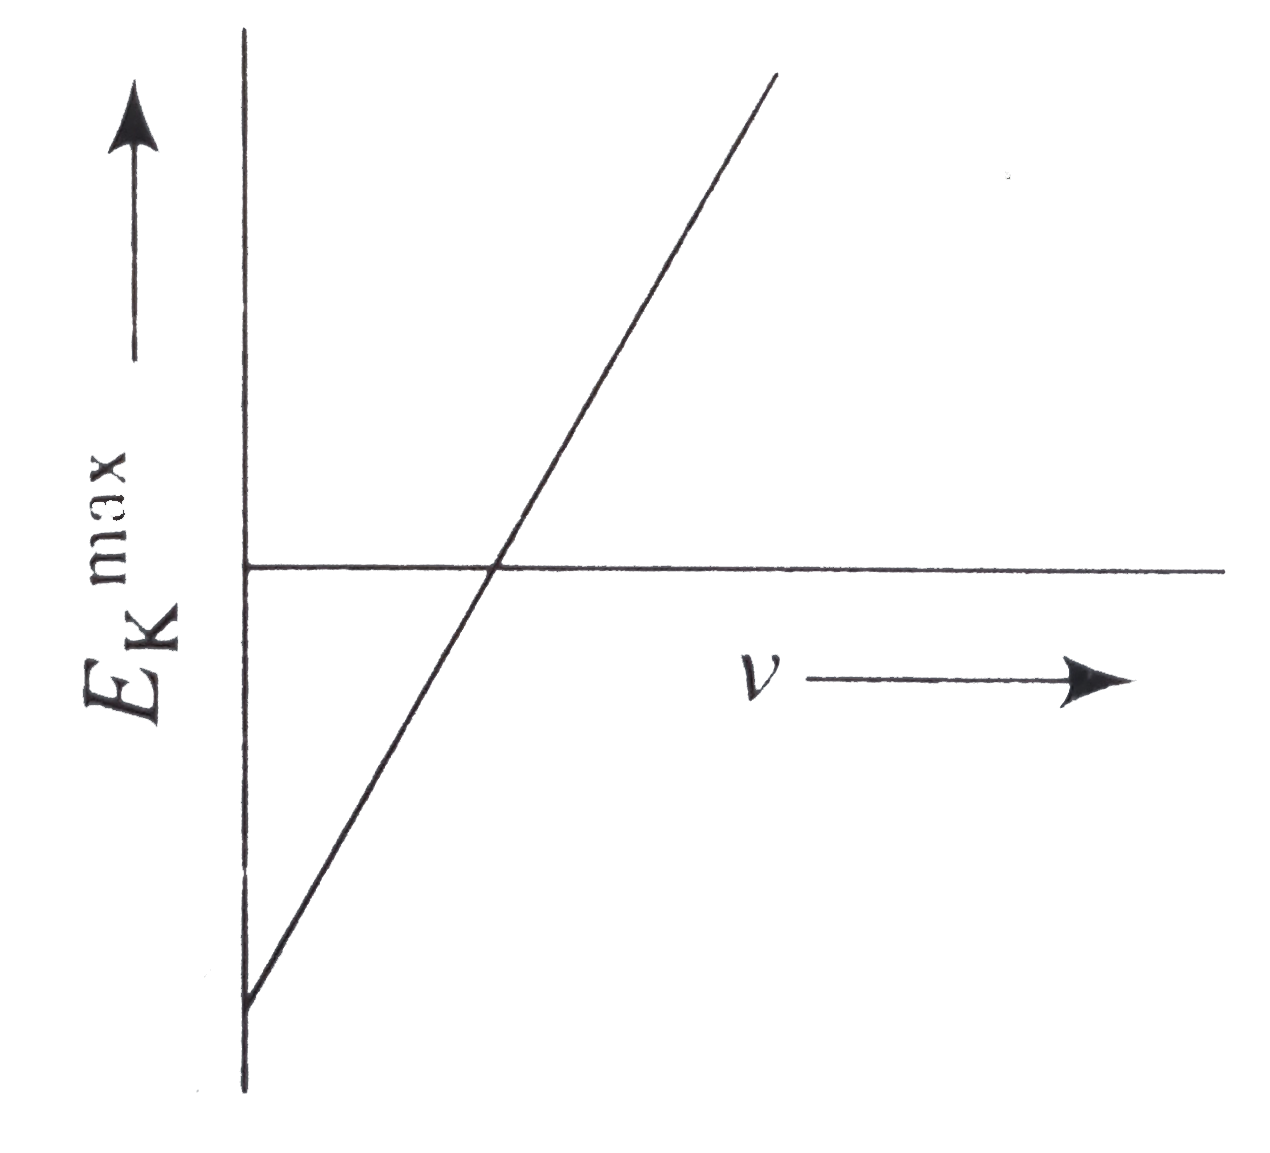
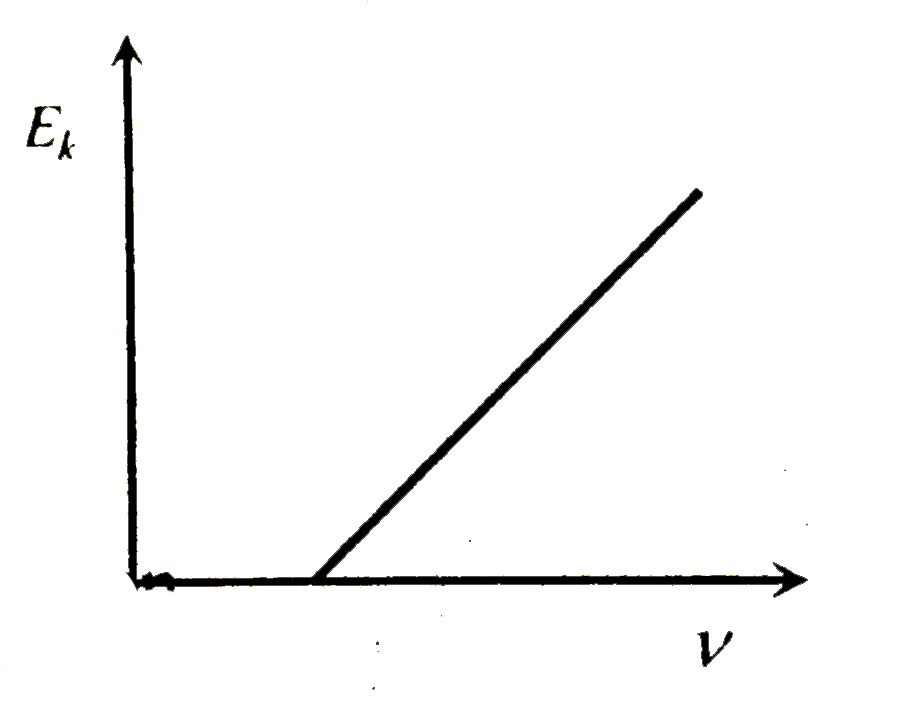
The maximum kinetic energy of the emitted photoelectrons against frequency υ of incident radiation is plotted as shown in Fig. This graph help us in determining the following physical quantities
work function of the cathode-metal
threshold frequency
Planck's constant
charge on an electron
The correct Answer is:A, B, C
Intercept of straight line on negative energy axis gives the value of work function of the cathode metal. The point where the straight line cuts the frequency axis gives the value of threshold frequency while the slope of straight line provides the value of Planck's constant.
Topper's Solved these Questions
- PHOTOELECTRIC EFFECTBOOK - CENGAGE PHYSICSCHAPTER - PHOTOELECTRIC EFFECTEXERCISE - Multiple Correct
10 Videos
- PHOTOELECTRIC EFFECTBOOK - CENGAGE PHYSICSCHAPTER - PHOTOELECTRIC EFFECTEXERCISE - Linked Comprehension
44 Videos
- PHOTOELECTRIC EFFECTBOOK - CENGAGE PHYSICSCHAPTER - PHOTOELECTRIC EFFECTEXERCISE - Subjective
16 Videos
- NUCLEIBOOK - CENGAGE PHYSICSCHAPTER - NUCLEIEXERCISE - QUESTION BANK
59 Videos
- RAY OPTICSBOOK - CENGAGE PHYSICSCHAPTER - RAY OPTICSEXERCISE - DPP 1.6
12 Videos
Similar Questions
Knowledge Check
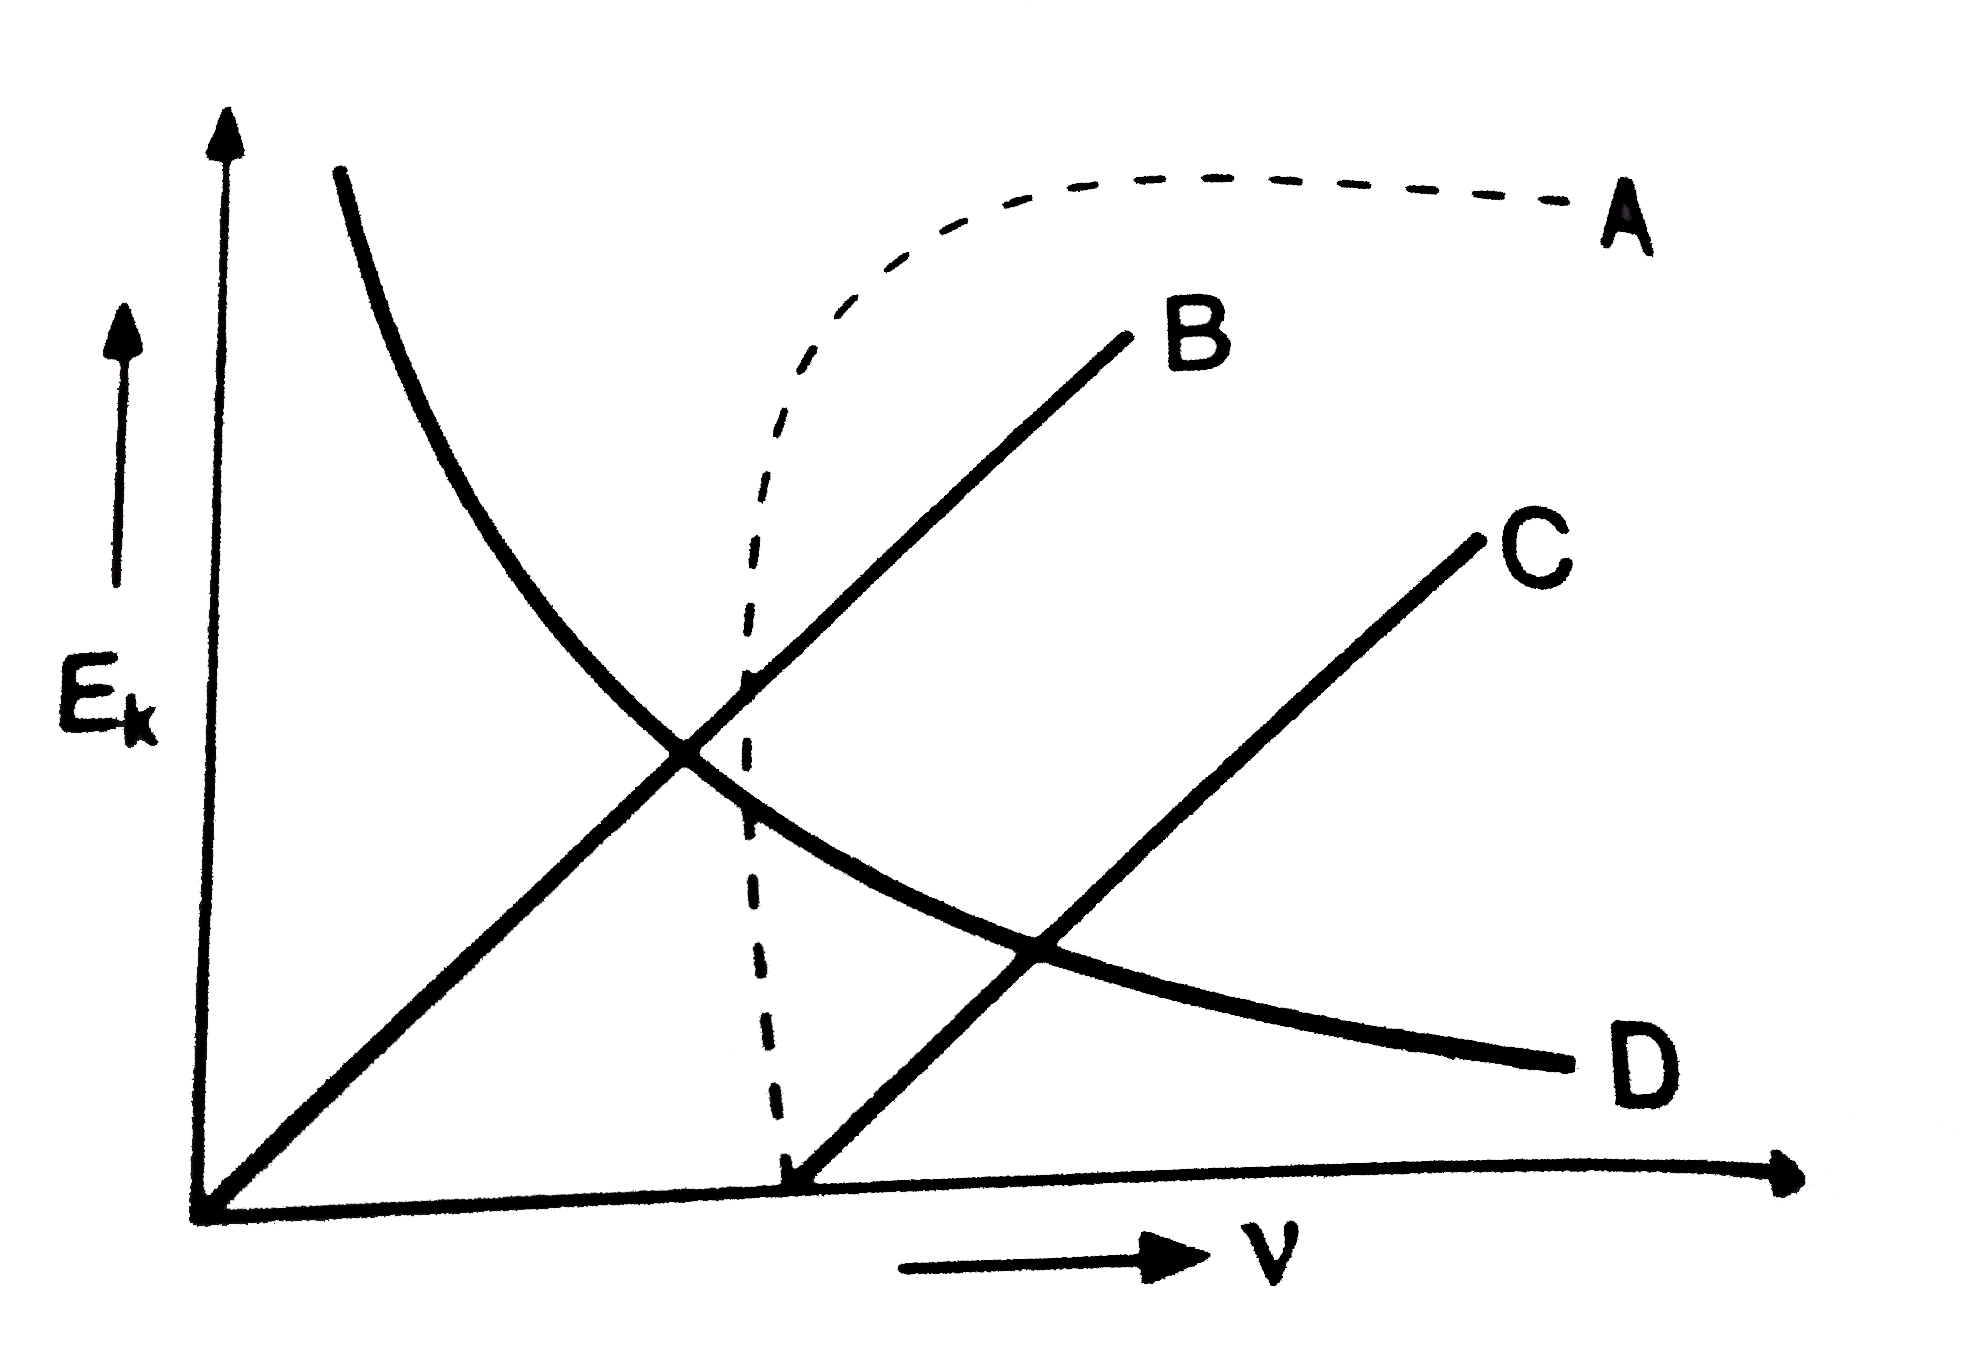
Maximum kinetic energy (Ek) of a photoelectron varies with the frequency (v) of the incident radiation as
A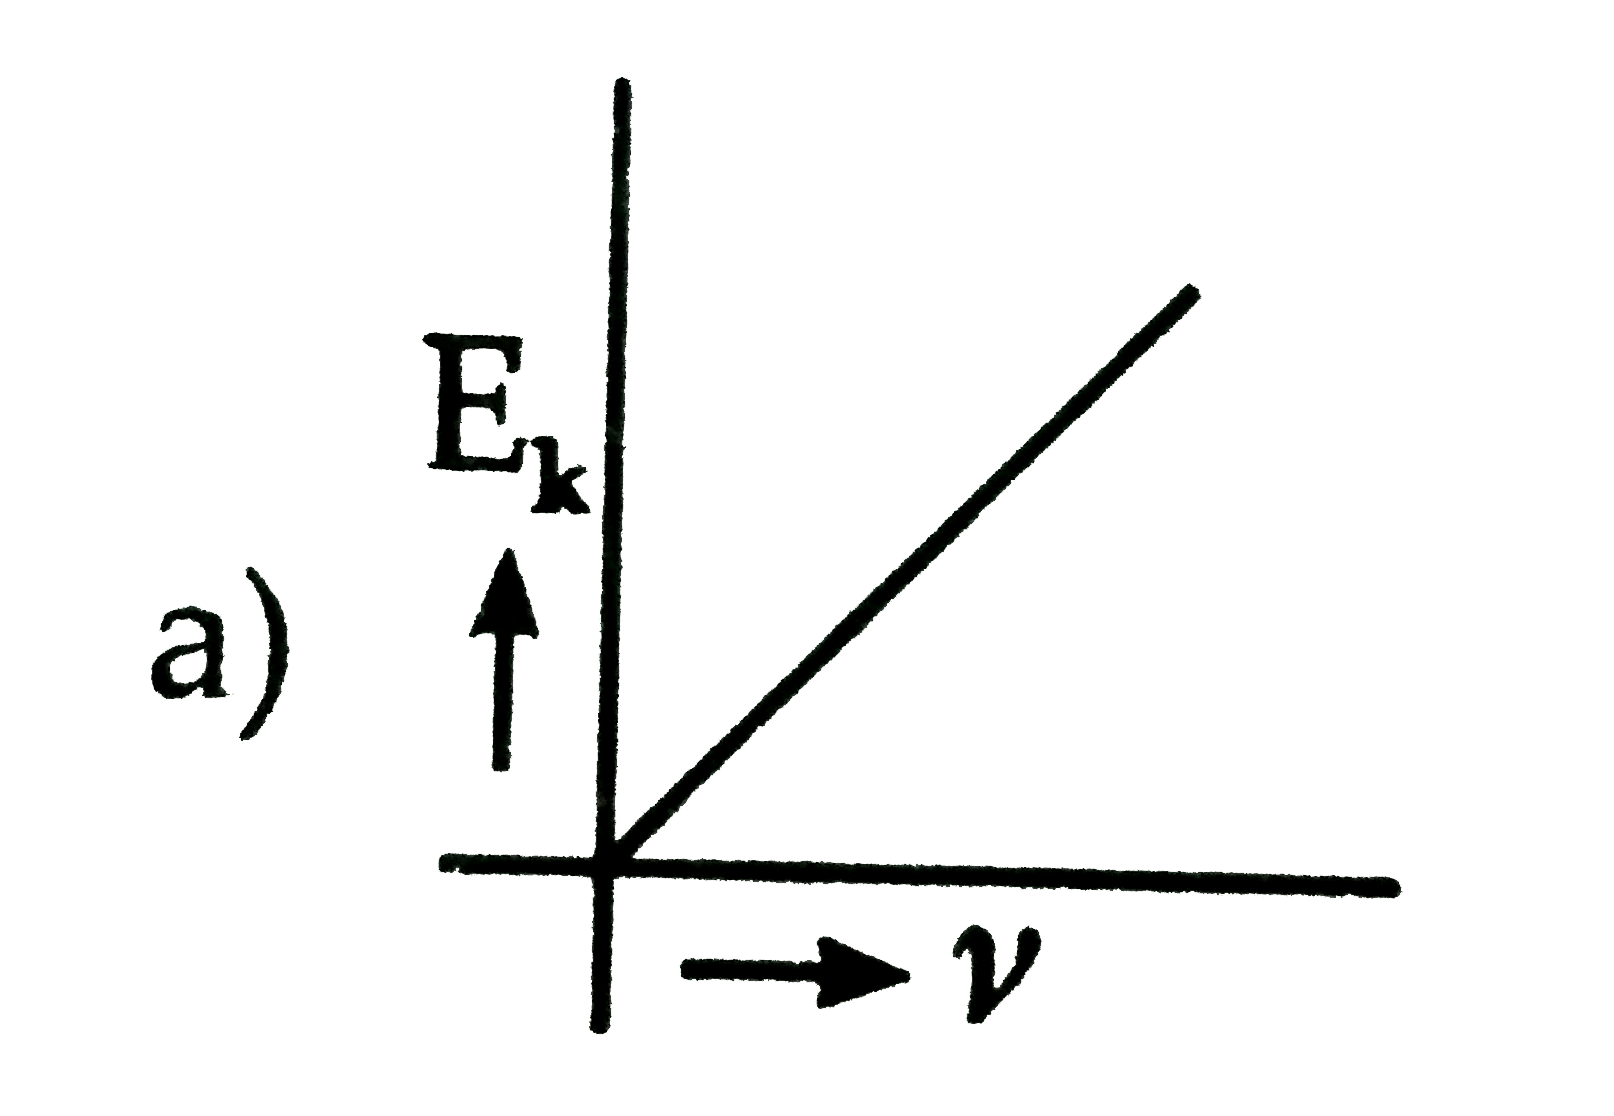 B
B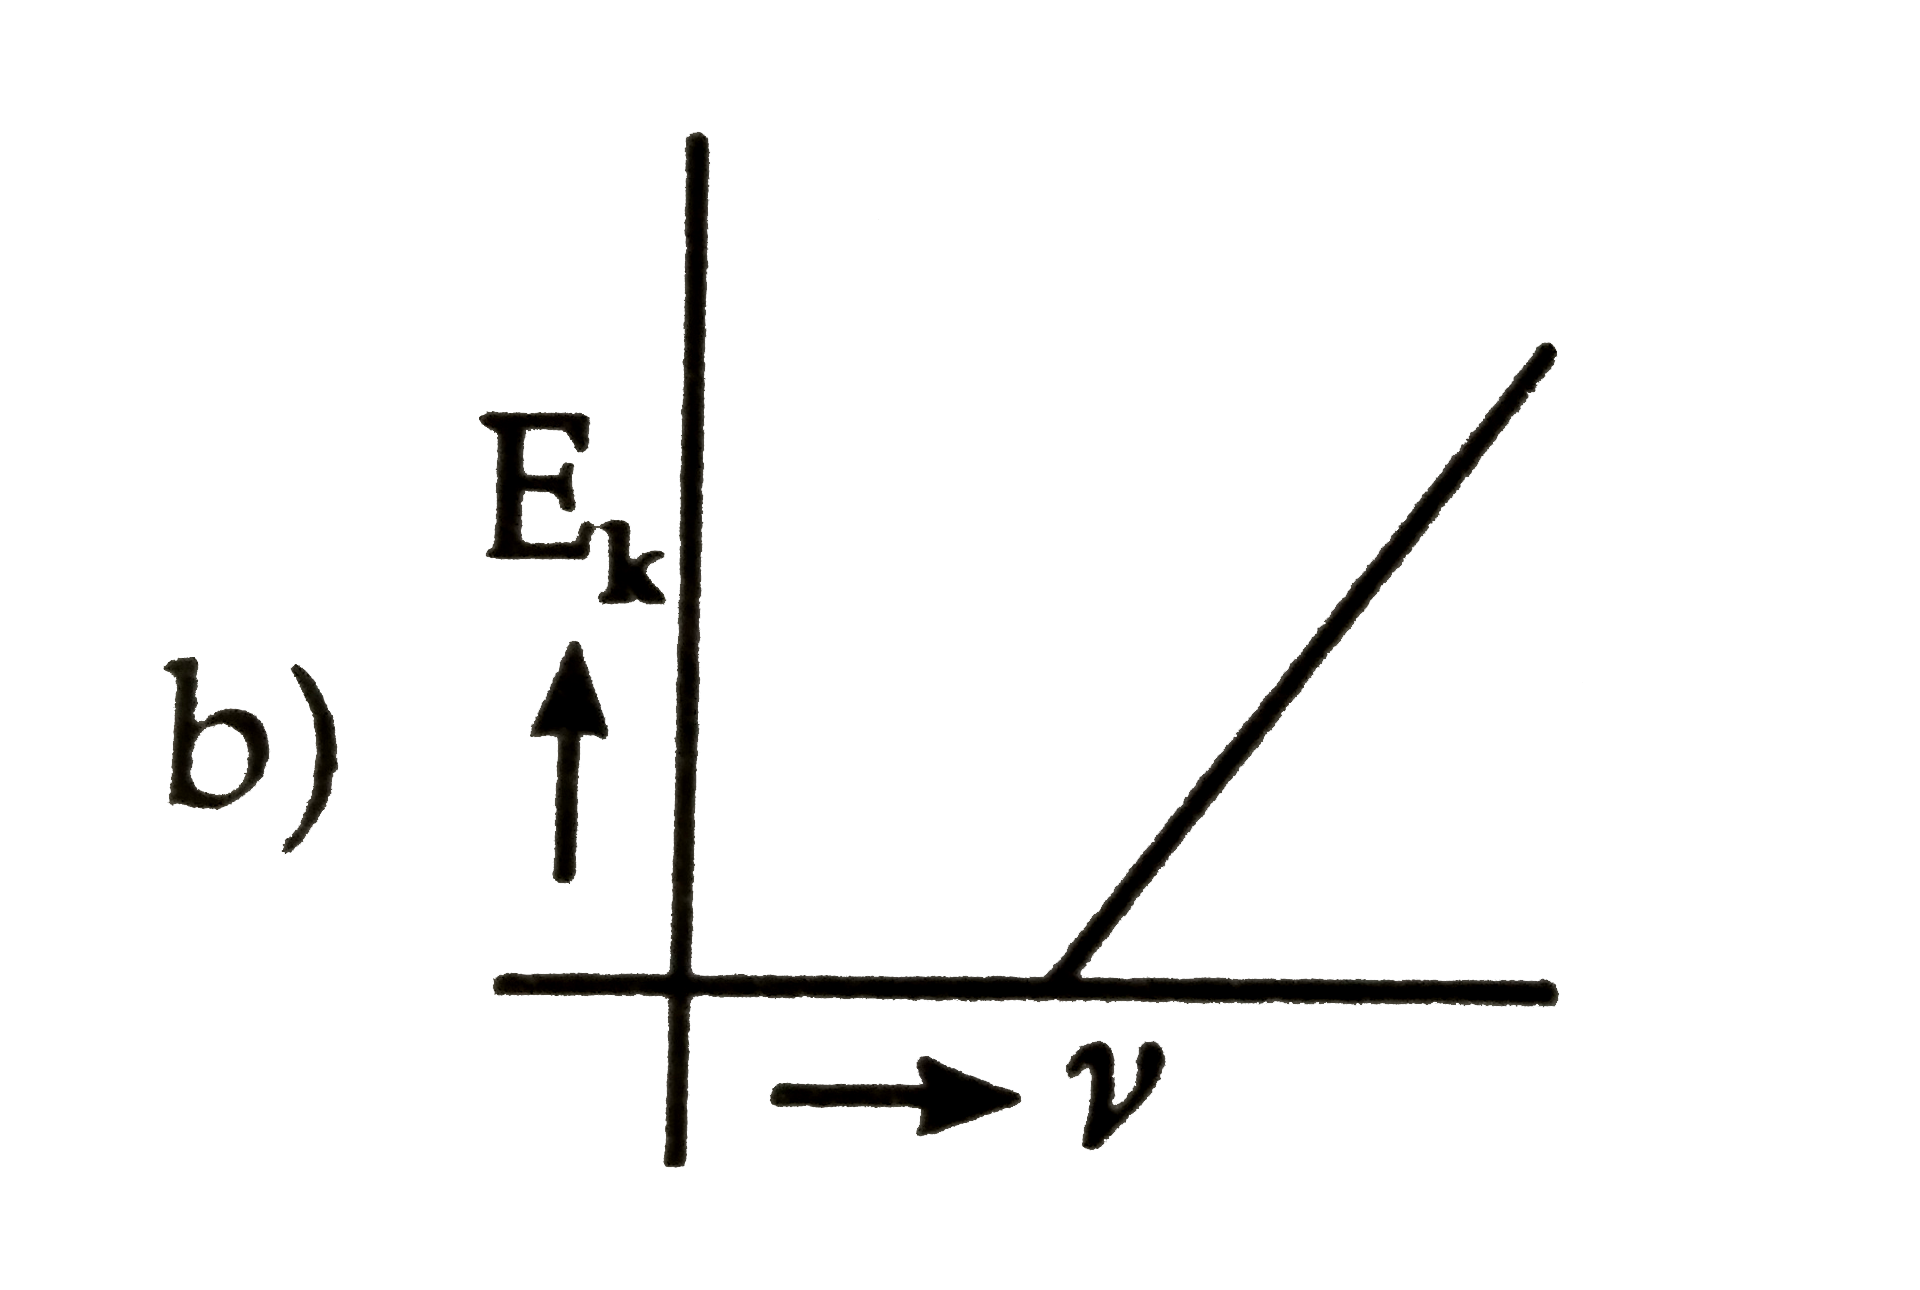 C
C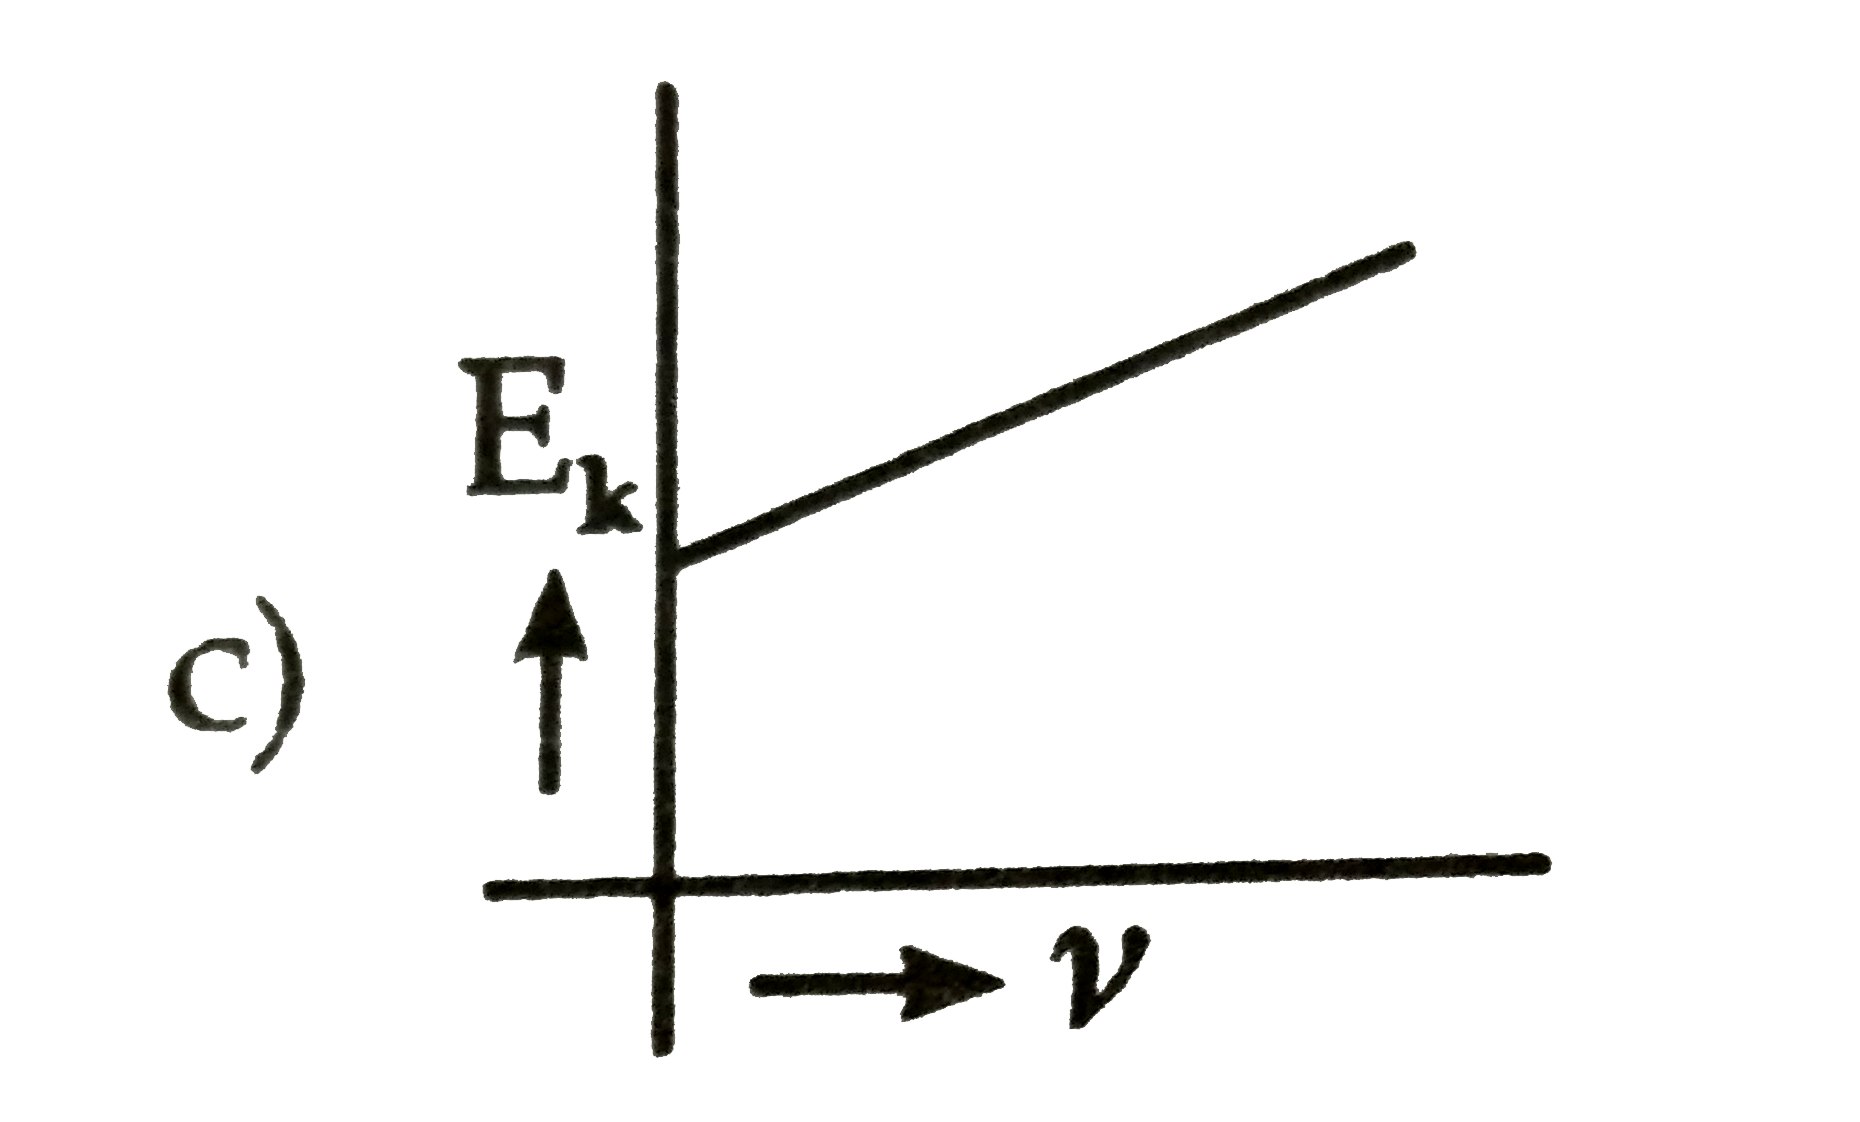 D
D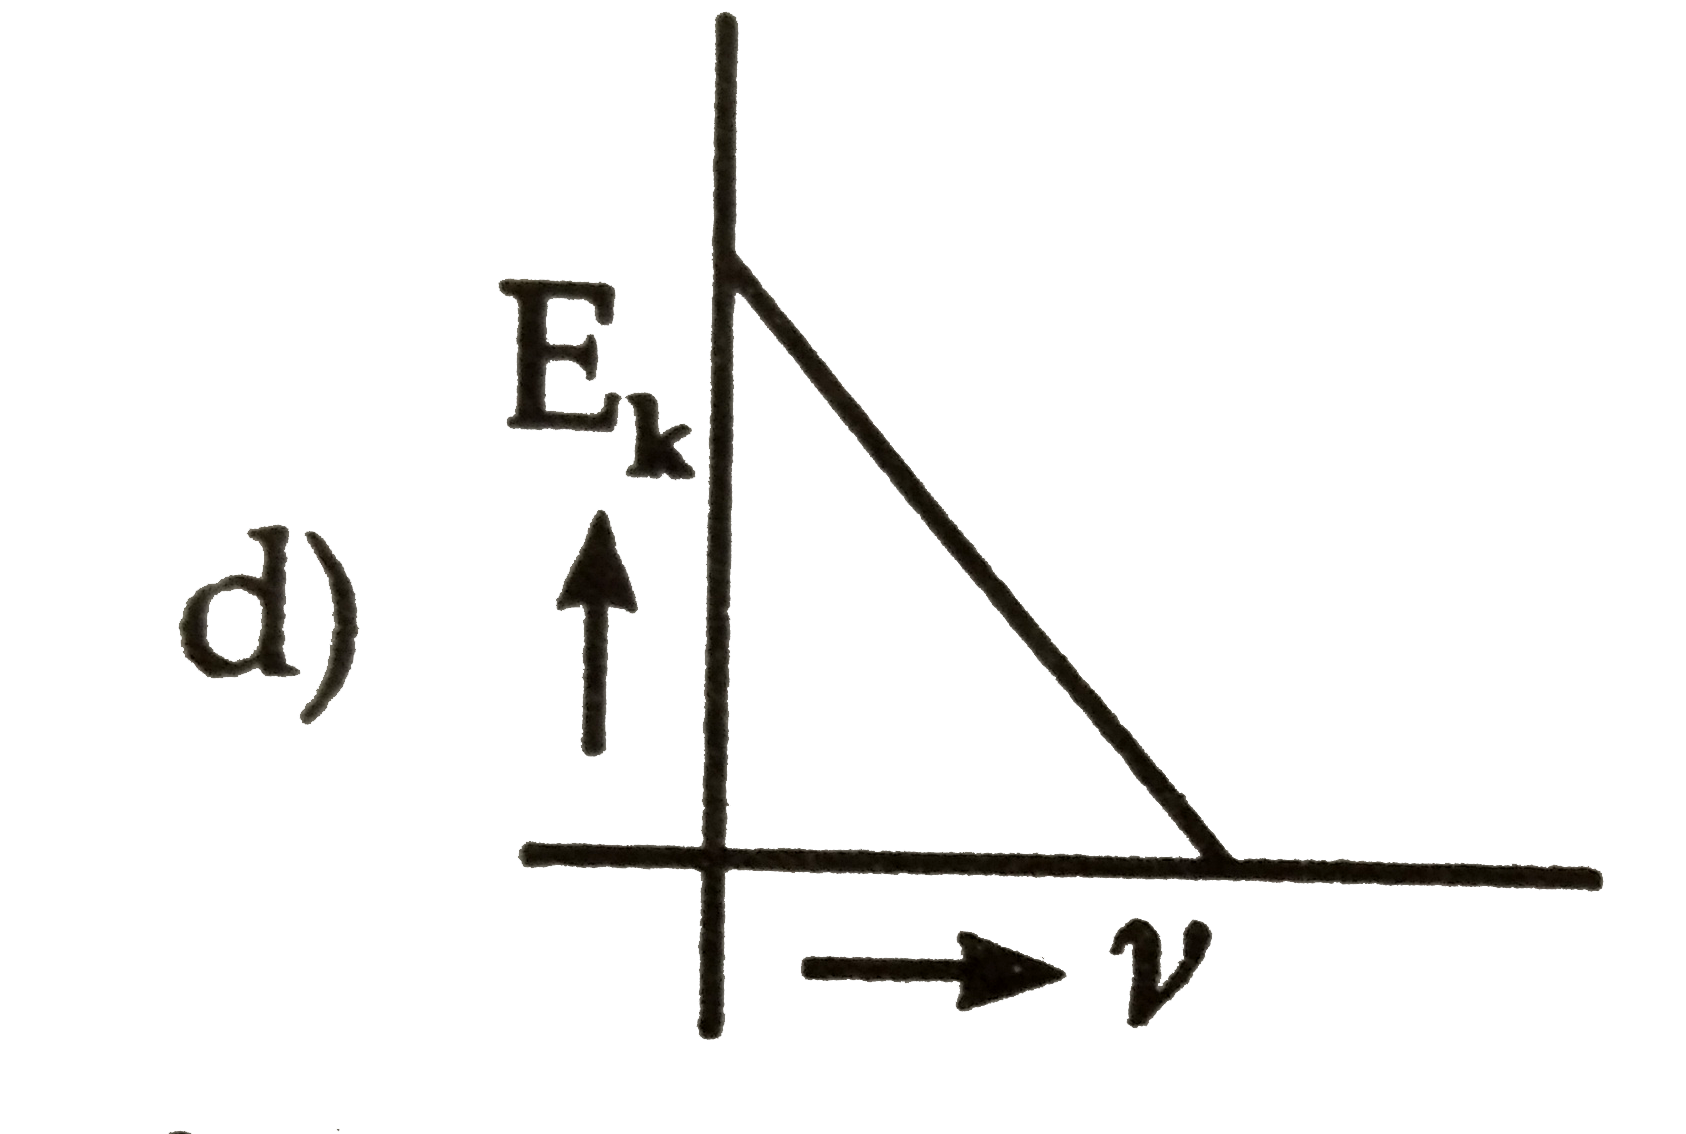
A plot of kinetic energy of the emitted electron against frequency of the incident radiation yields a straight line.t he slope of the straight line is:
A0.66×10−35B0.66×10−33C0.33×10−33D3.33×10−35The maximum kinetic energy of photoelectrons is directly proportional to . . . Of the incident radiation. The missing word can be:
AintenstiyBwavelengthCwave numberDfrequency.
The maximum kinetic energy of emitted photoelectrons from a surface depends on the ____ of incident radiation as well as the _____of the given surface.
View SolutionThe maximu kinetic energy (Ek) of the photoelectron varies with frequency (v) of the incident light as shown by the curve:
View SolutionThe kinetic energy (Ek) of a photoelectron varies with the frequency (v) of the incident radiation as which of the following graph ?
View SolutionFor the photoelectric effect, the maximum kinetic energy Ek of the emitted photoelectrons is plotted against the frequency ν of the incident photons as shown in the figure. The slope of the curve gives
View SolutionAccording to Einstein's photoelectric equation, the plot of the maximum kinetic energy of the emitted photoelectrons from a metal versus frequency of the incident radiation gives a straight line whose slope
View Solution
