Fit a straight line to the following data treating y as the dependent variable

The correct Answer is:y=14(x−105);y=22.25
Step by step video, text & image solution for Fit a straight line to the following data treating y as the dependent variable by Maths experts to help you in doubts & scoring excellent marks in Class 12 exams.
Updated on:21/07/2023Topper's Solved these Questions
- MOCK TEST PAPER -2021 Book:ICSEChapter:MOCK TEST PAPER -2021 Exercise:SECTION -B (15 MARKS )
Explore 10 Videos
- MATRICESBook:ICSEChapter:MATRICESExercise:MULTIPLE CHOICE QUESTION (Competency based questions)
Explore 25 Videos
- MODEL TEST PAPER - 10Book:ICSEChapter:MODEL TEST PAPER - 10Exercise:SECTION - C
Explore 10 Videos
Similar Questions
Knowledge Check
Which of the following graph yield a straight line?
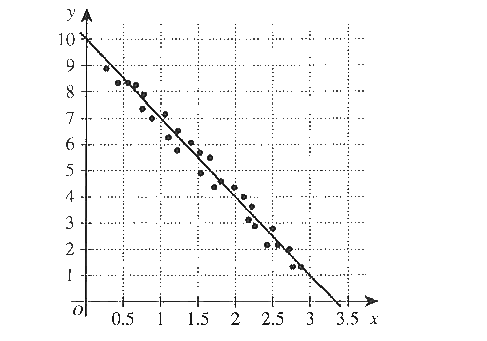
Ax/m vs pBlog x/m vs pCx/m vs log pDlog x/m vs log pThe scatterplot in the standard (x,y) coordinate plane below contains data points showning a strong linear correlation between the variables x and y. Mia drew the line shown to model the data. One of the following equations represents Mia's line. Which one?
 Ay=−3x+8By=−3x+10Cy=−2x+10Dy=2x+10
Find Cov (X,Y) for the following data :

View SolutionExpress the equation 4x−5y+20=0 in the form so that:
(i) x is dependent variable and y is the independent variable.
(ii) y is dependent variable and x is independent variable.
View SolutionA set of parallel chords of the parabola y2=4ax have their midpoint on any straight line through the vertex any straight line through the focus a straight line parallel to the axis another parabola
View SolutionIn dydx, x is independent variable and y is the dependent variable. If independent and dependent variables are interchanged dydx becomes dxdy and these two are connected by the relation dydx.dxdy=1 . Find a relation between d2ydx2 and d2xdy2
View SolutionIf the algebraic sum of perpendiculars from n given points on a variable straight line is zero then prove that the variable straight line passes through a fixed point
View Solution
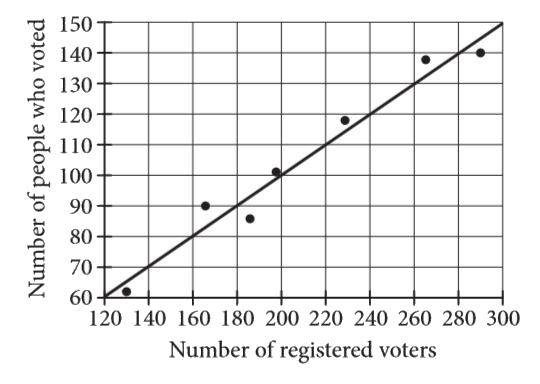
The scatterplot above shows the number of registered voters, x, and the number of people who voted in the last election, y, for seven districts in a town. A line of best fit for the data is also shown. Which of the following could be the equation of the line of best fit?
View Solution


