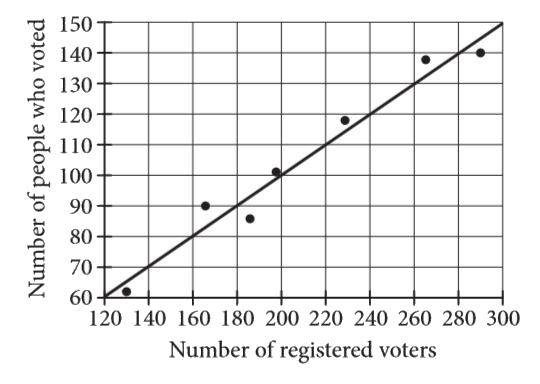
The scatterplot above shows the number of registered voters, x, and the number of people who voted in the last election, y, for seven districts in a town. A line of best fit for the data is also shown. Which of the following could be the equation of the line of best fit?
y = −0.5x
y = 0.5x
y = −2x
y = 2x
The correct Answer is:B
The slope-intercept form of a linear equation is y = mx + b, where m is the slope of the graph of the equation and b is the y-coordinate of the y-intercept of the graph. Any two ordered pairs (x1,y1) and (x2,y2) that satisfy a linear equation can be used to compute the slope of the graph of the equation using the formula m=y2−y1x2−x1. Substituting the coordinates of (120, 60) and (160, 80), which lie on the line of best fit, into this formula gives m=80−60160−120, which simplifies to 2040 , or 0.5 . Substituting this value for m in the slope-intercept form of the equation produces y = 0.5x + b. Substituting values from the ordered pair (120, 60) into this equation produces 60 = 0.5(120) + b, so b = 0. Substituting this value for b in the slope-intercept form of the equation produces y = 0.5x + 0, or y = 0.5x.
Choices A, C, and D are incorrect and may result from an error in calculation when determining the slope of the line of best fit.
Similar Questions
The inequation that best describes the graph given below is _________
View SolutionThe inequation that best describes the following graph is _________
View SolutionWhich of the following equation is best representation of given graph's? ltimg src="https://d10lpgp6xz60nq.cloudfront.net/physics_images/ALN_PHY_R04_E01_008_Q01.png" width="80%"gt
View SolutionThe equation of straight line shown in figure is :
ltimg src="https://d10lpgp6xz60nq.cloudfront.net/physics_images/ALN_PHY_R04_E01_020_Q01.png" width="80%"gt
View SolutionFor shown situation find ∠BCA :-
ltimg src="https://d10lpgp6xz60nq.cloudfront.net/physics_images/ALN_PHY_R05_E01_035_Q01.png" width="80%"gt
View SolutionFind the magnitude of the resultant of shown forces :-
ltimg src="https://d10lpgp6xz60nq.cloudfront.net/physics_images/ALN_PHY_R02_E02_009_Q01.png" width="80%"gt
View SolutionWhich of the following best describes the diagram below of a molecular orbital?
ltimg src="https://d10lpgp6xz60nq.cloudfront.net/physics_images/JM_18_CHE_P1_E02_029_Q01.png" width="80%"gt
View Solution
