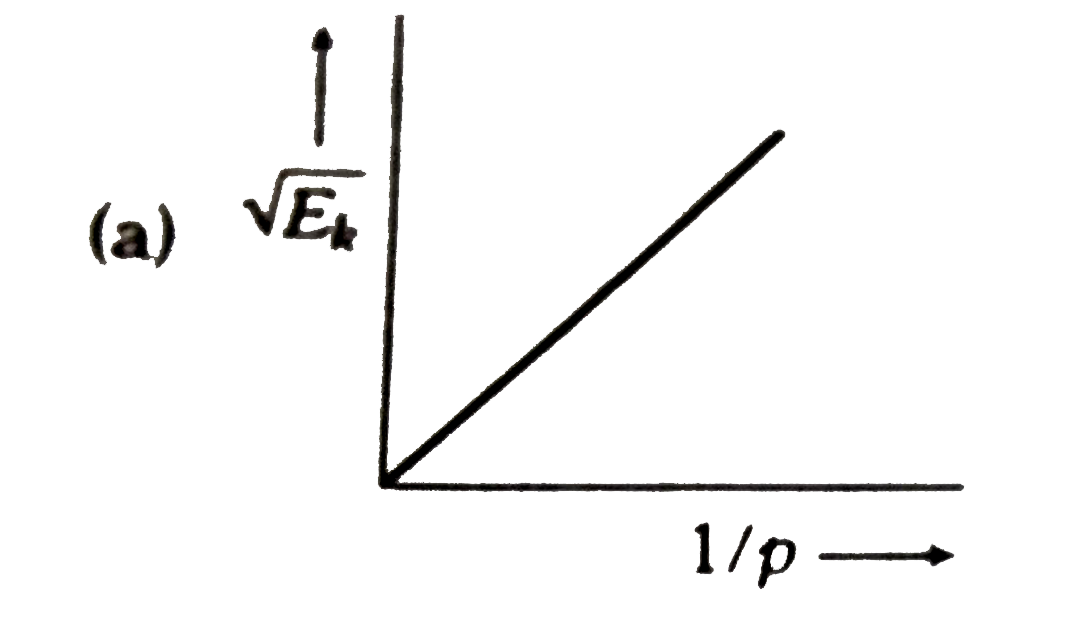
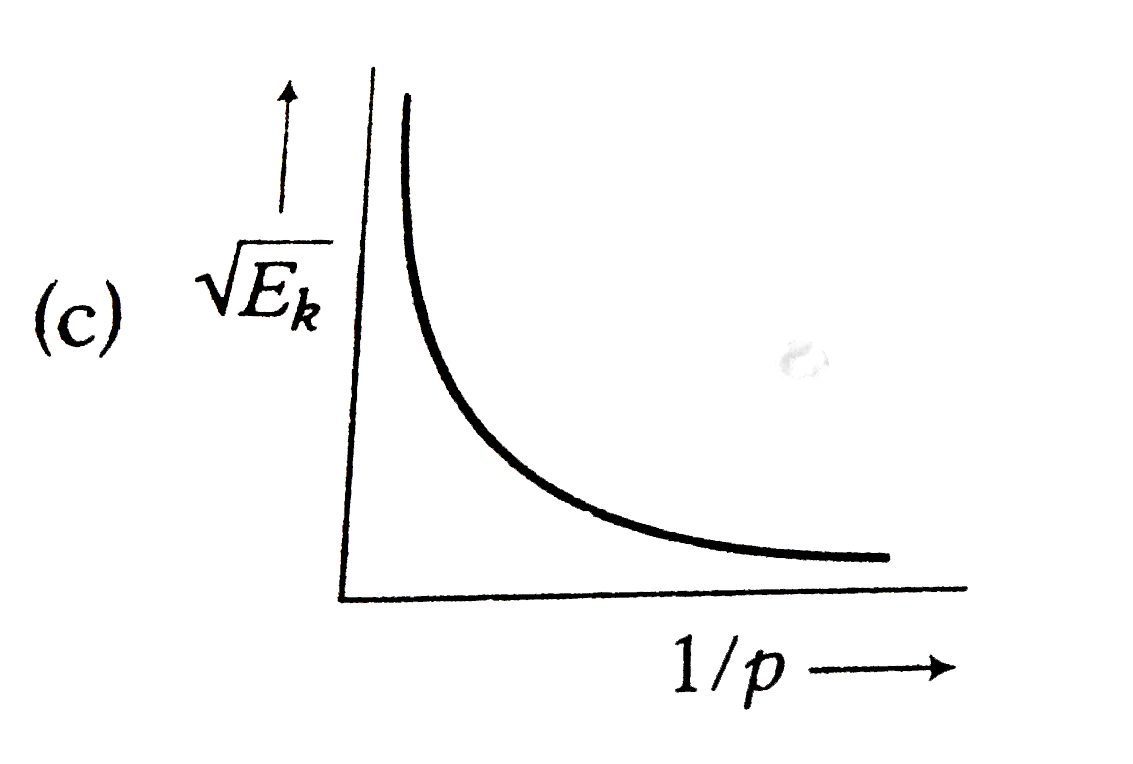
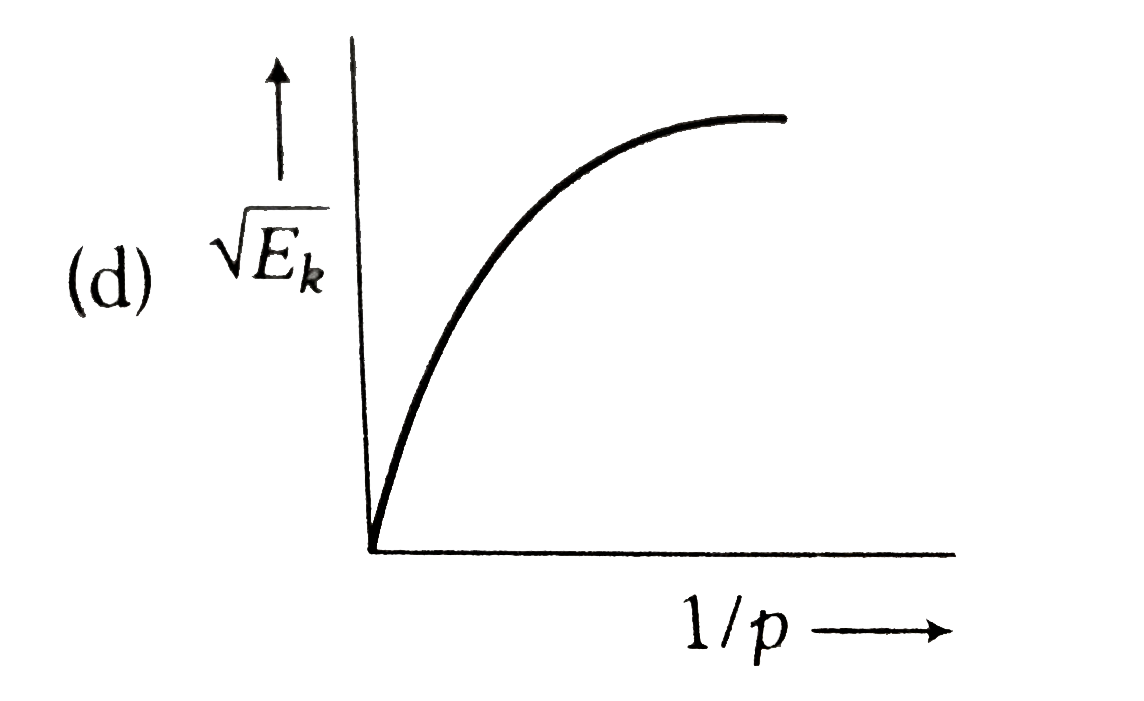
The graph betwee and is (E=kinetic energy and p= momentum)


The correct Answer is:C
To solve the problem of finding the graph between √E (where E is kinetic energy) and 1p (where p is momentum), we can follow these steps:
Step 1: Define Kinetic Energy and Momentum
The kinetic energy E of an object with mass m moving at velocity v is given by:
E=12mv2
The momentum p of the same object is given by:
p=mv
Step 2: Relate Kinetic Energy and Momentum
We can express v in terms of momentum:
v=pm
Substituting this expression for v into the kinetic energy formula gives:
E=12m(pm)2=12p2m
Step 3: Express E in terms of p
From the equation derived above, we can rearrange to express p in terms of E:
p2=2mE⟹p=√2mE
Step 4: Find the Relationship between √E and 1p
Now, we want to express √E in terms of 1p:
√E=p√2m
Taking the reciprocal of p:
1p=1√2mE
This implies:
√E=1√2m⋅11p⟹√E∝11p
Step 5: Identify the Type of Graph
From the relationship √E∝1p, we can see that as 1p increases, √E also increases. This indicates a linear relationship between √E and 1p, which can be represented graphically.
However, since we are plotting √E against 1p, we can conclude that the graph will be a hyperbola, as the relationship is inversely proportional.
Conclusion
The graph between √E and 1p is a hyperbola.
---
The kinetic energy E of an object with mass m moving at velocity v is given by:
E=12mv2
The momentum p of the same object is given by:
p=mv
We can express v in terms of momentum:
v=pm
Substituting this expression for v into the kinetic energy formula gives:
E=12m(pm)2=12p2m
From the equation derived above, we can rearrange to express p in terms of E:
p2=2mE⟹p=√2mE
Now, we want to express √E in terms of 1p:
√E=p√2m
Taking the reciprocal of p:
1p=1√2mE
This implies:
√E=1√2m⋅11p⟹√E∝11p
From the relationship √E∝1p, we can see that as 1p increases, √E also increases. This indicates a linear relationship between √E and 1p, which can be represented graphically.
The graph between √E and 1p is a hyperbola.
Topper's Solved these Questions
- WORK, ENERGY AND POWERBOOK - DC PANDEY ENGLISHCHAPTER - WORK, ENERGY AND POWEREXERCISE - CHECK POINT 6.3
10 Videos
- WORK, ENERGY AND POWERBOOK - DC PANDEY ENGLISHCHAPTER - WORK, ENERGY AND POWEREXERCISE - EXERCISES(TAKING IT TOGETHER)
83 Videos
- WORK, ENERGY AND POWERBOOK - DC PANDEY ENGLISHCHAPTER - WORK, ENERGY AND POWEREXERCISE - CHECK POINT 6.1
20 Videos
- WORK, ENERGY & POWERBOOK - DC PANDEY ENGLISHCHAPTER - WORK, ENERGY & POWEREXERCISE - Level 2 Comprehension Based
2 Videos
- WORK, POWER AND ENERGYBOOK - DC PANDEY ENGLISHCHAPTER - WORK, POWER AND ENERGYEXERCISE - E Integer Type Questions
11 Videos
Similar Questions
The momentum of a body is p and its kinetic energy is E. Its momentum becomes 2p. Its kinetic energy will be
View Solution(a) A proton is moving at a speed much less than the speed of light. It has kinetic energy K1 and momentum p1. If the momentum of the proton is doubled, so p2=2p1, how is its new kinetic energy K2 related to K−1?
(b)A photon with energy E1 has momentum p1 . if another photon has momentum p2 that is twice p1, how is the energy E2 of the second photon related to E1?
View SolutionRelation between pressure (P) and average kinetic energy per unit volume of gas (E ) is
View SolutionThe correct graph representing the variation of total energy (Et), kinetic energy (Ek) and potential energy (U) of a satellite with its distance form the centre of earth is
View SolutionWhich of the following graph is correct between kinetic energy E, potential energy (U) and height (h) from the ground of the partical
View SolutionWrite the kinetic gas equation and express it as P=23E, where E is the kinetic energy per unit volume.
View SolutionA bomb at rest explodes into two parts of masses m1 and m2. If the momentums of the two parts be P1 and P2, then their kinetic energies will be in the ratio of:
View SolutionRelationship between angular momentum L and kinetic energy E of a rigid body in pure rotation is
View SolutionIf J is the angular momentum and E is the kinetic energy, then J2E has the dimensions of
View SolutionA light mass and a heavy mass have equal momentum. Which will have more kinetic energy?
[Hint : kinetic energy K = p2/2m where p is the momentum)
View Solution
