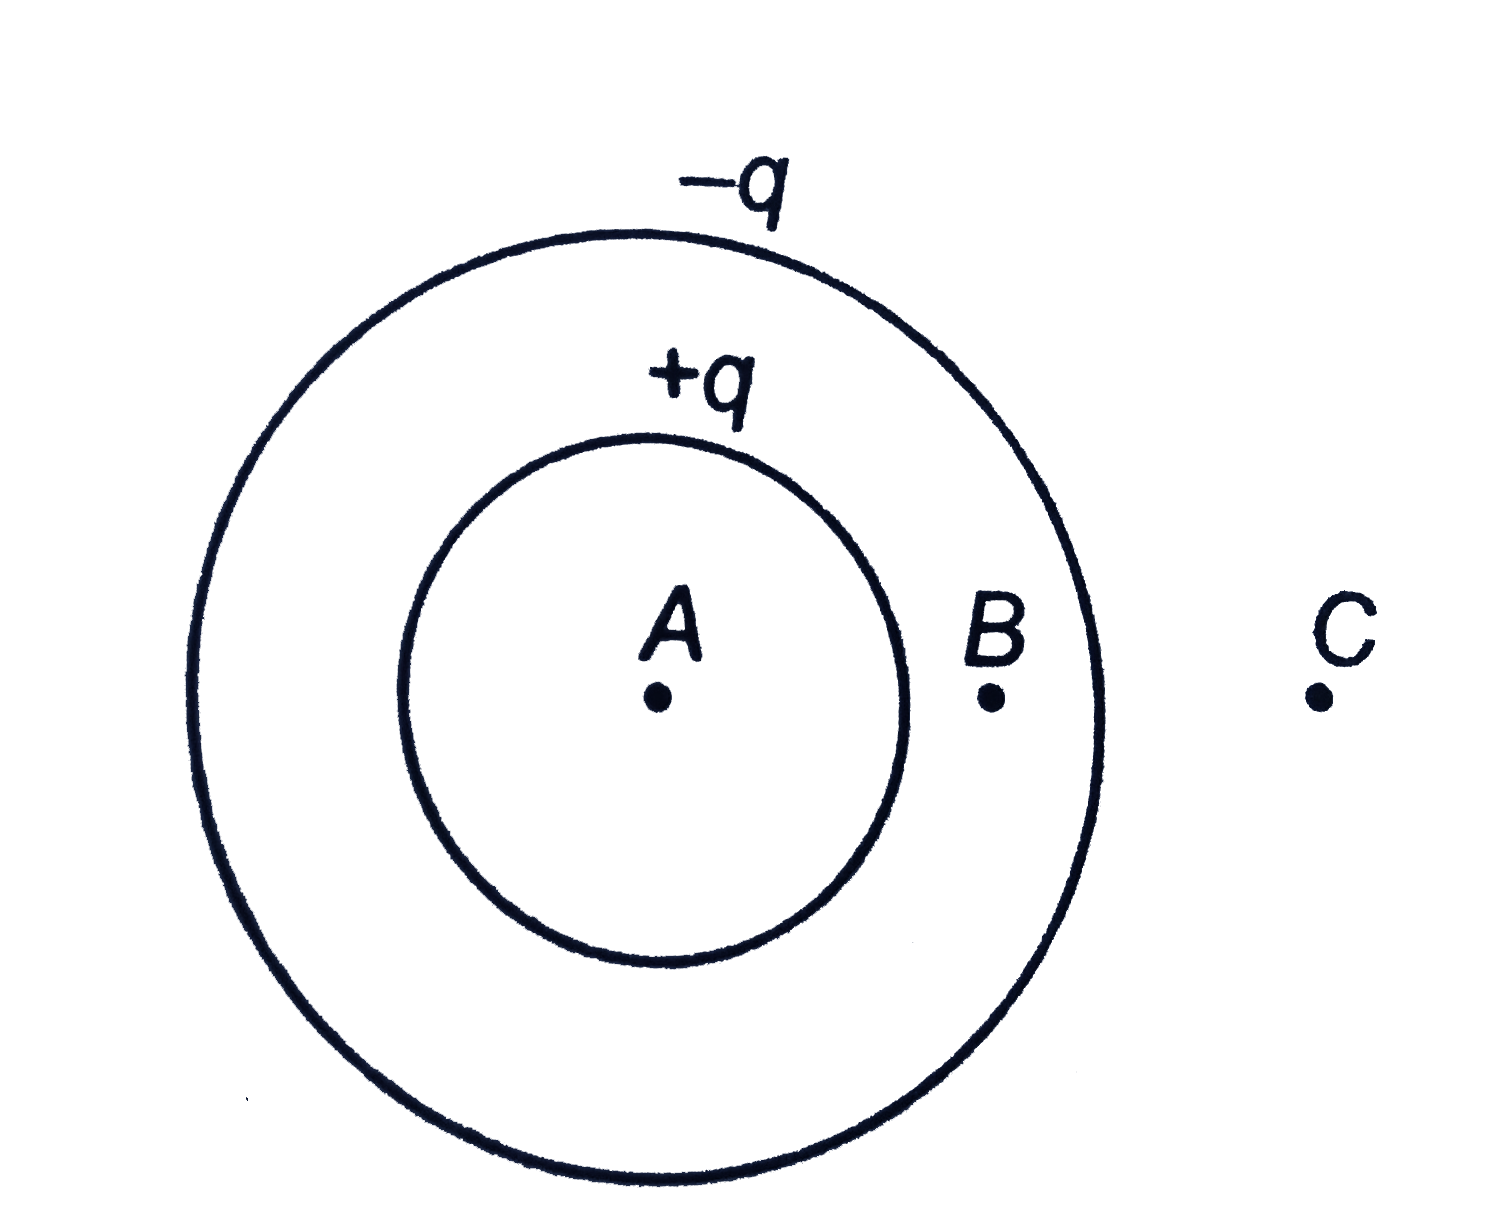
Draw E-r and V-r graphs due to two charged spherical shells as shown in figure (along the line between C and ∝) 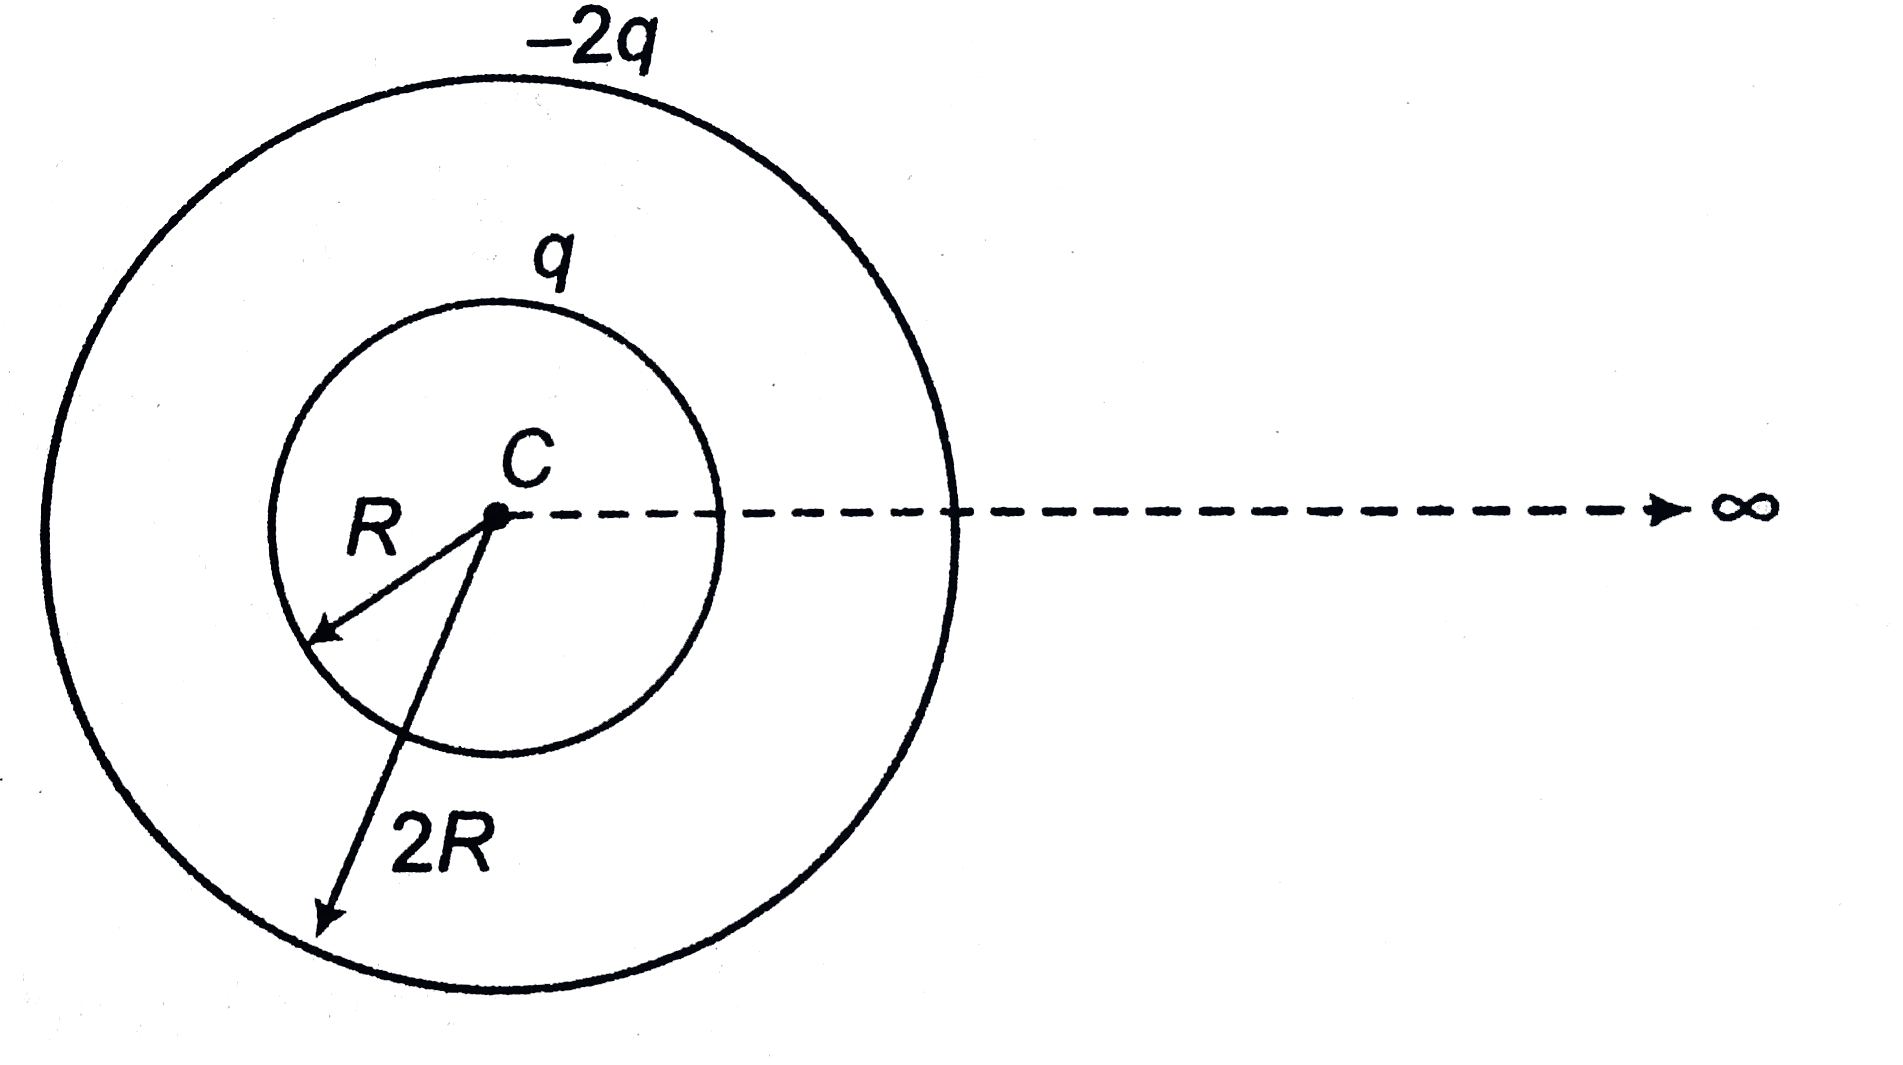
E-r graph 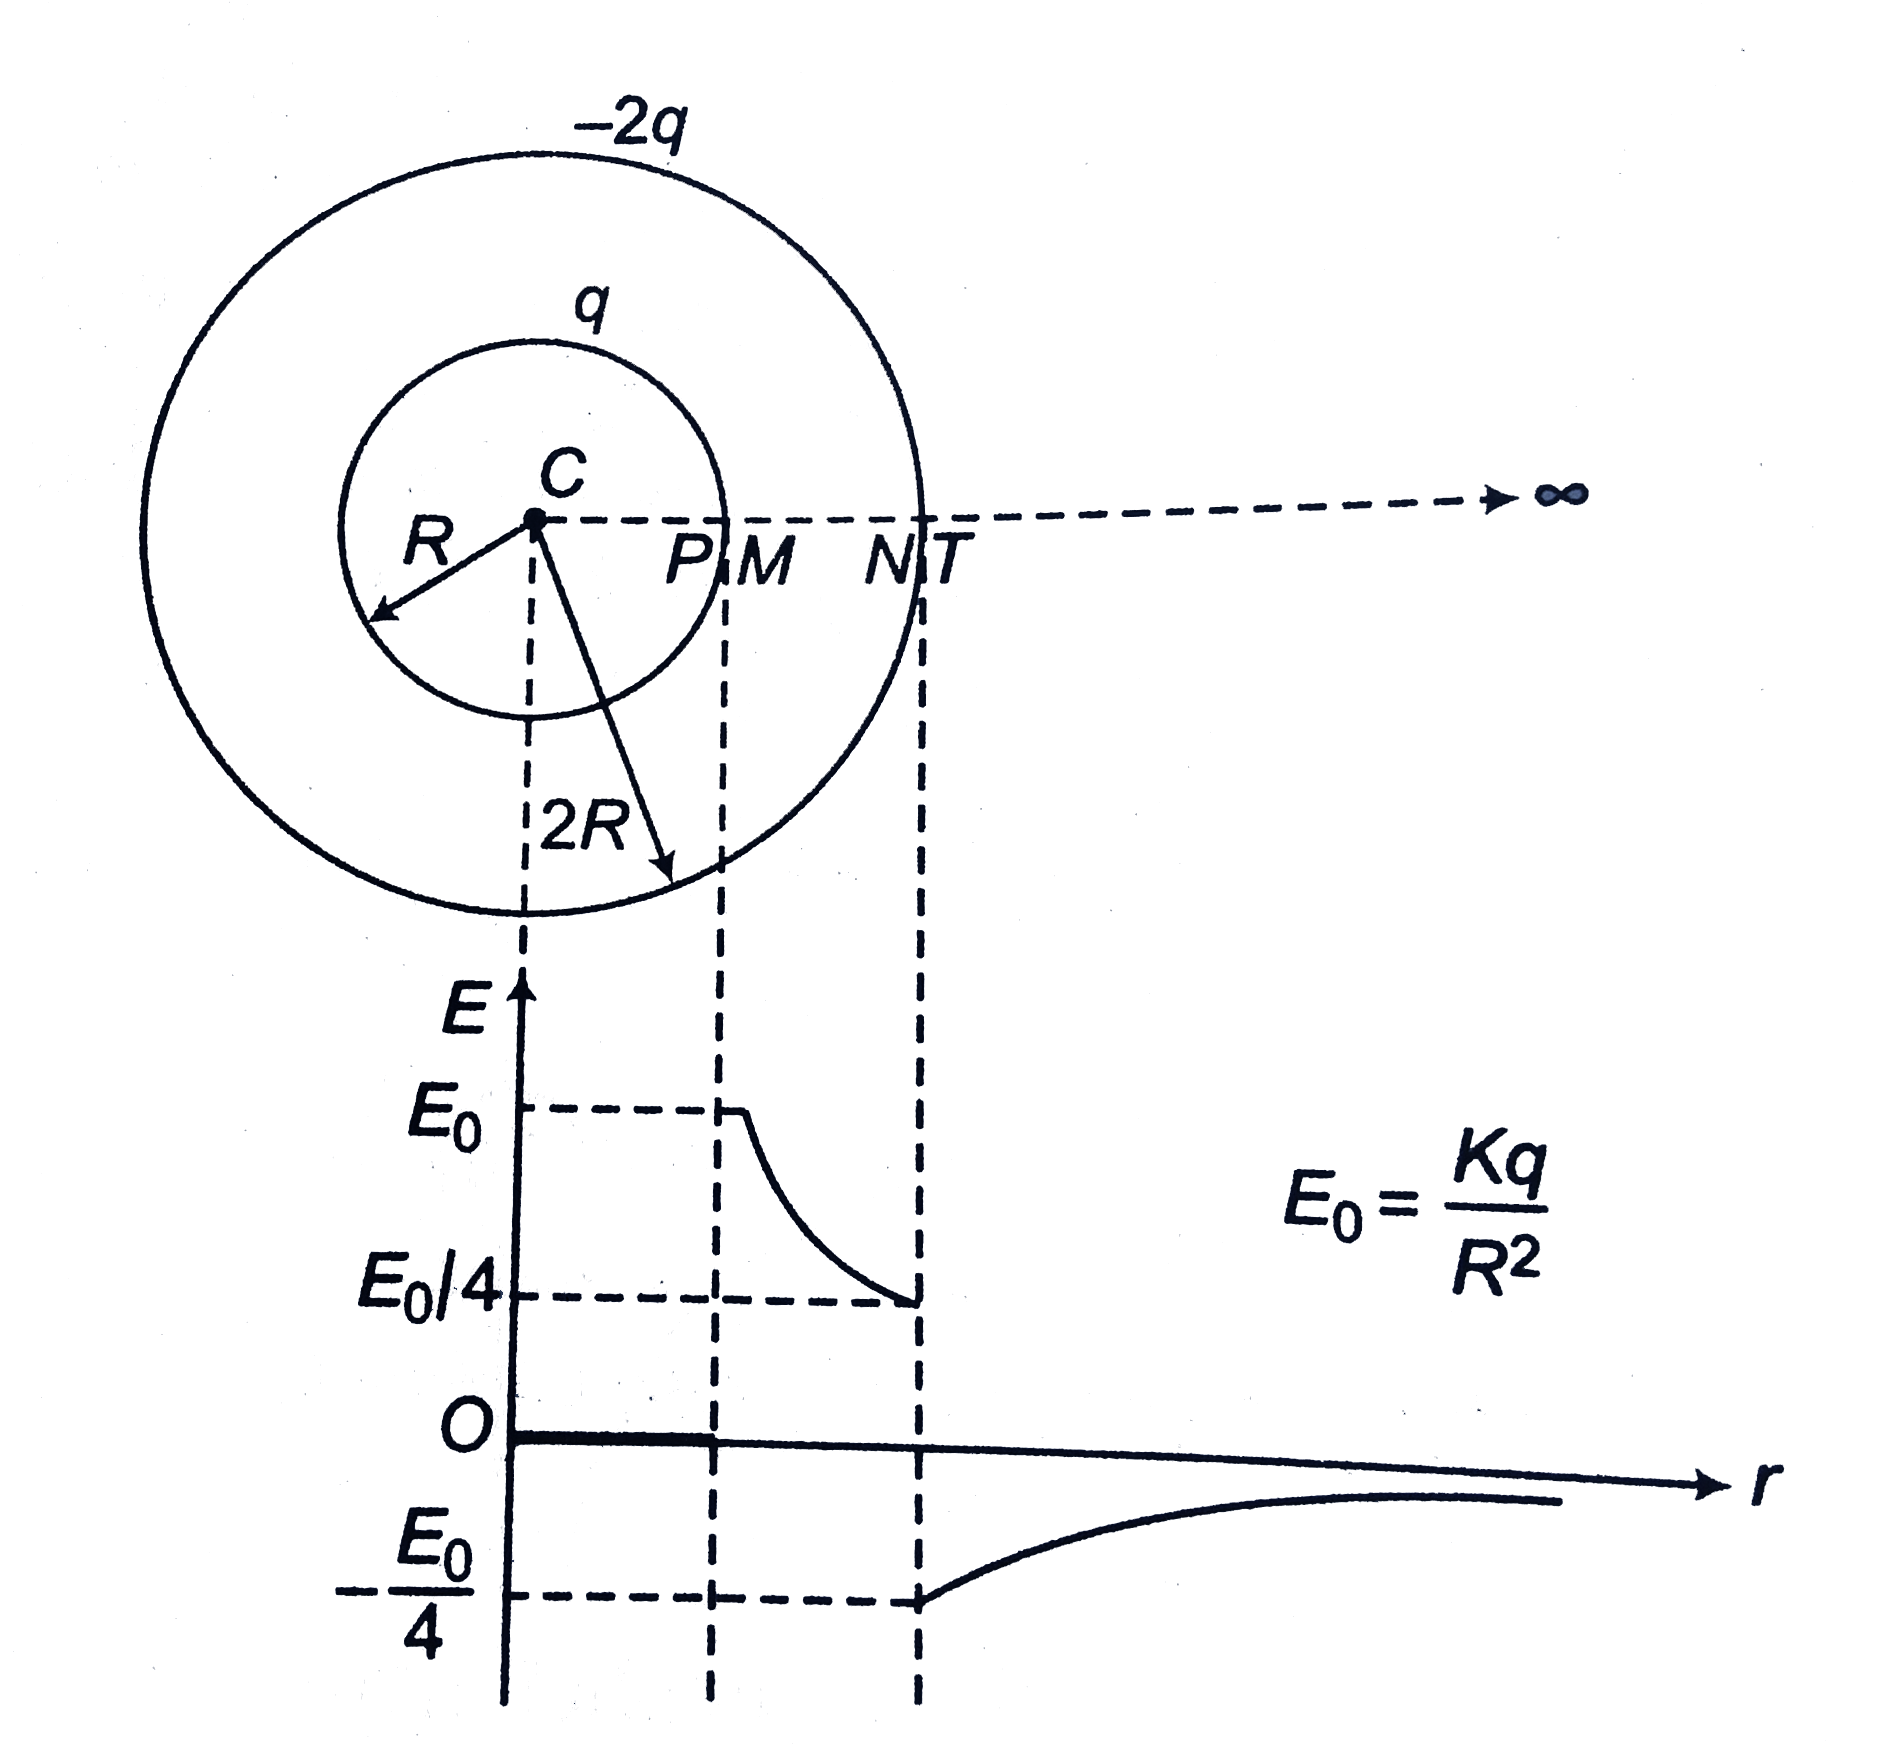
C to P qin=0⇒E=0
At M E=kqR2 (radially outwards, say positive) =E0(say)
At NE=kq(2R)2=kq4R2=E0e (radialy outwards)
From M to N value will decrease from E0 to E04
At TE=k(−2q+q)(2R2)2 (radially inwards)
=−E04
From T to ∞ Value will decrease form E0 to E04
At TE=(k(-2q+q))/((R)^2)(radially∈wards)<br>=-E_0/4<br>FromT→ooValuechan≥som-E_0/4 →zer⊙<br>V−rgraph<br>FromC→PP∮sarely∈g∈s⊥htheshells.Hence,potentialdue→⊥hshellisconstant<br>:. V=(kq)/R-(k(2q))/(2R)=0<br>FromM→Npotentialofqwilldecrease.So,≠tvaluecomesout→be¬ative.AtNorT<br>V=(kq)/(2R)-(k(2q))/(2R)<br>=-(kq)/(2R)=-V_0(say)<br>From→oovaluewillchn≥om-V_0 to zero. The correct graph is a as shown below. 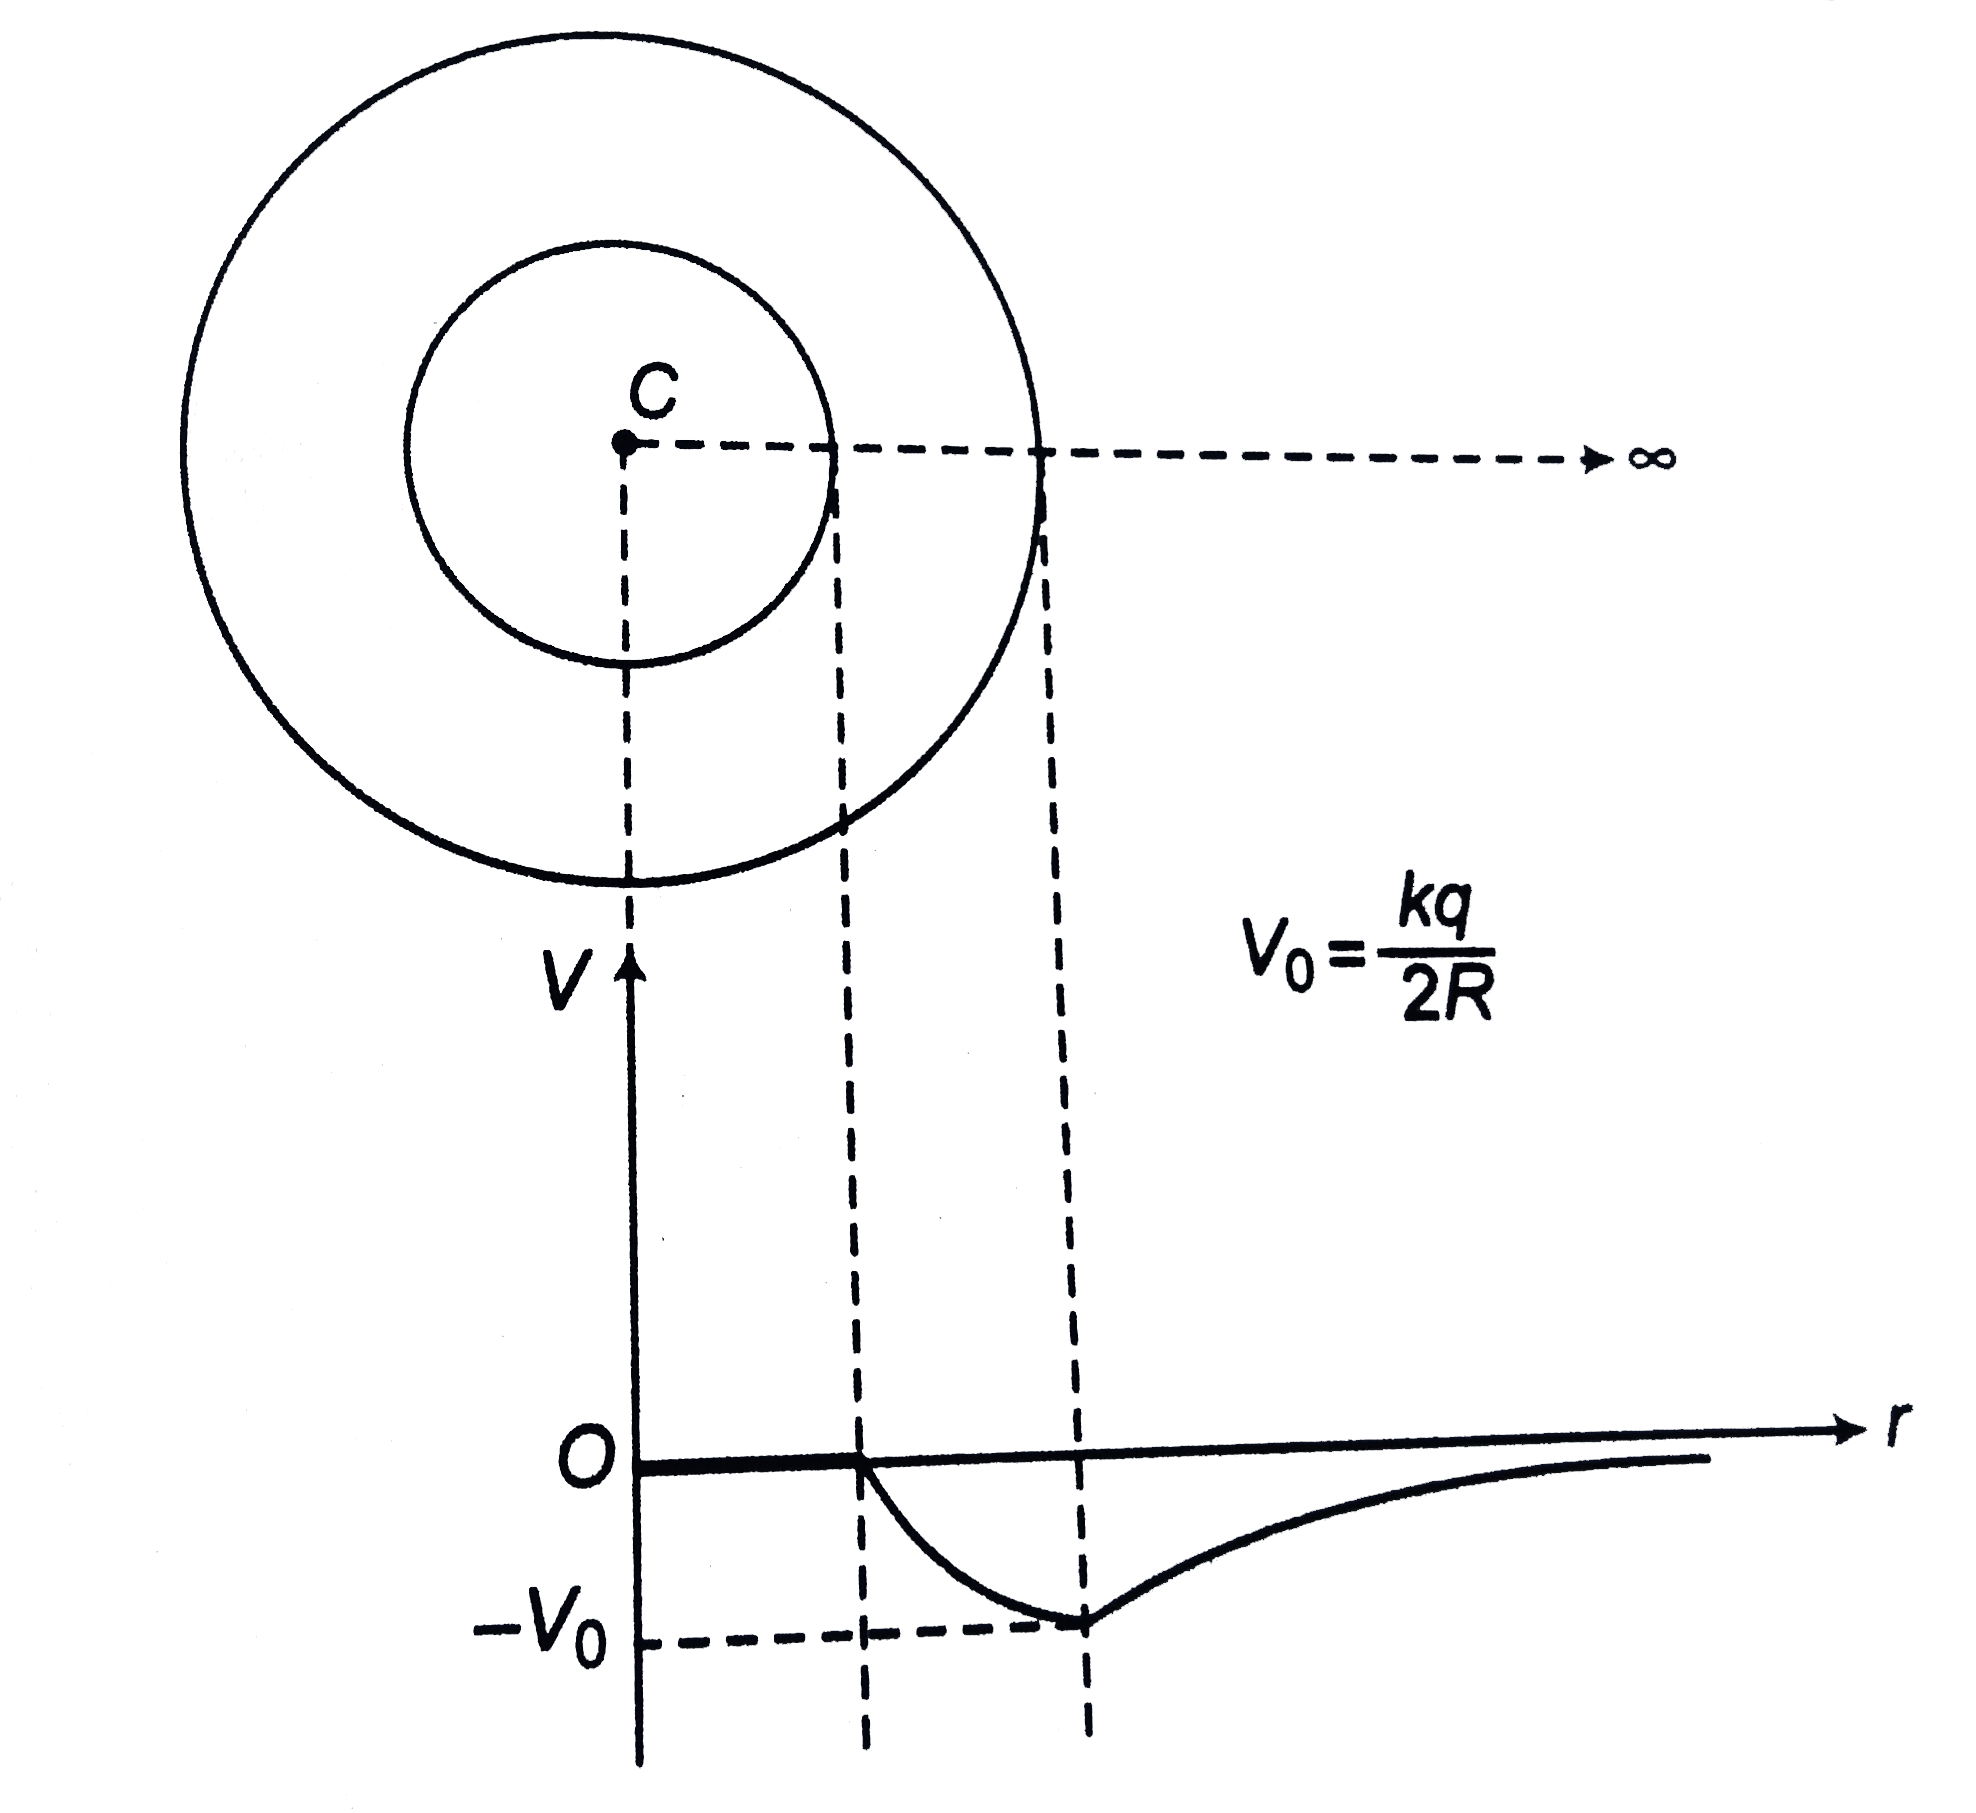
Topper's Solved these Questions
- ELECTROSTATICSBOOK - DC PANDEY ENGLISHCHAPTER - ELECTROSTATICSEXERCISE - Exercise 24.1
4 Videos
- ELECTROSTATICSBOOK - DC PANDEY ENGLISHCHAPTER - ELECTROSTATICSEXERCISE - Exercise 24.2
9 Videos
- ELECTROSTATICSBOOK - DC PANDEY ENGLISHCHAPTER - ELECTROSTATICSEXERCISE - Example Type 8
3 Videos
- ELECTROSTATIC POTENTIAL AND CAPACITORSBOOK - DC PANDEY ENGLISHCHAPTER - ELECTROSTATIC POTENTIAL AND CAPACITORSEXERCISE - (C) Chapter exercises
50 Videos
- GRAVITATIONBOOK - DC PANDEY ENGLISHCHAPTER - GRAVITATIONEXERCISE - All Questions
135 Videos
Similar Questions
Draw E−r and V−r graphs due to two point charges +q and −2q kept at some along the line joining these two charges.
View SolutionTwo concentric spherical sheels are as shown in figure. The V−r graph will be as
View SolutionThe point charge is placed outside a spherical shell as shown i the figure. Find the electric potential (in kilo volt) on the surface of shell (Take: q=1μc and R=50cm)

View SolutionDraw E and V versus r on the same graph for a point charge.
View SolutionTwo concentric spherical shells have charges +q and −q as shown in figure. Choose the correct options.
View SolutionUsing Gauss's law obtain the expression for the electric field due to uniformly charged thin spherical shell of radius R at a point outside the shell. Draw a graph showing the variation of electric tield with r, for r gt R and r lt R.
View SolutionUsing Gauss's law obtain the expression for the electric field due to uniformly charged thin spherical shell of radius R at a point outside the shell. Draw a graph showing the variation of electric tield with r, for r gt R and r lt R.
View SolutionA spherical conductor having charge q and radius r is placed at the centre of a spherical shell of radius R and having charge Q (R > r). The potential difference between the two is
View SolutionTwo concentric speherical shells are as shown in figure. The magnitude of gravitational potential (V) and field strength (E ) vary with distance ( r) from centre as

View SolutionA and B are two concentric spherical shells. If A is given a charge +Q while B is earthed as shown in figure then

View Solution
