A ball is dropped at t=0 from a height on a elastic surface. Identify the gragh which correctly represents relation of kinetic energy K with time t.
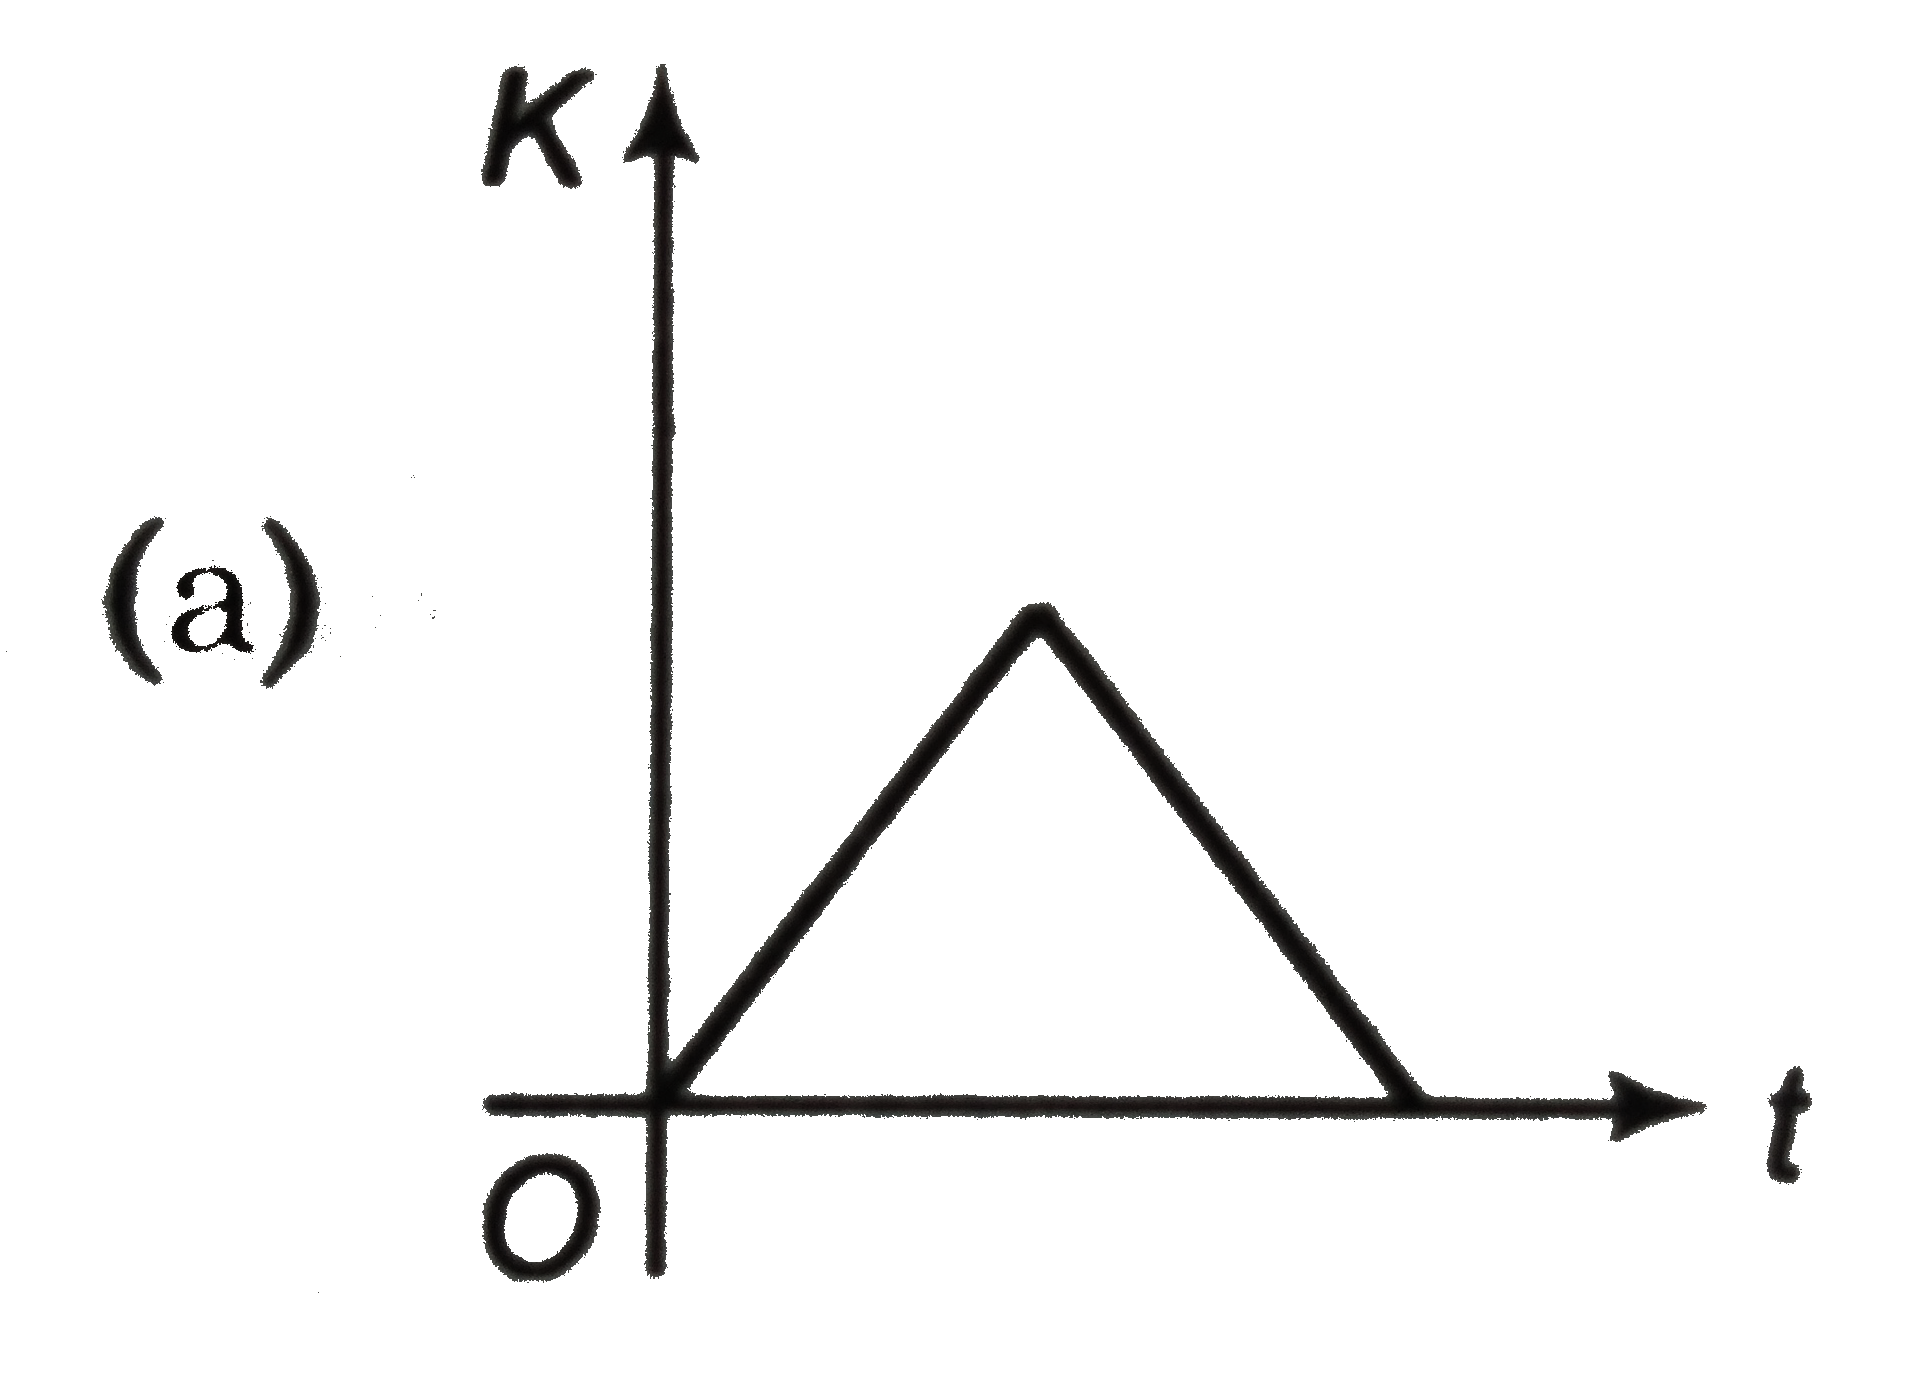
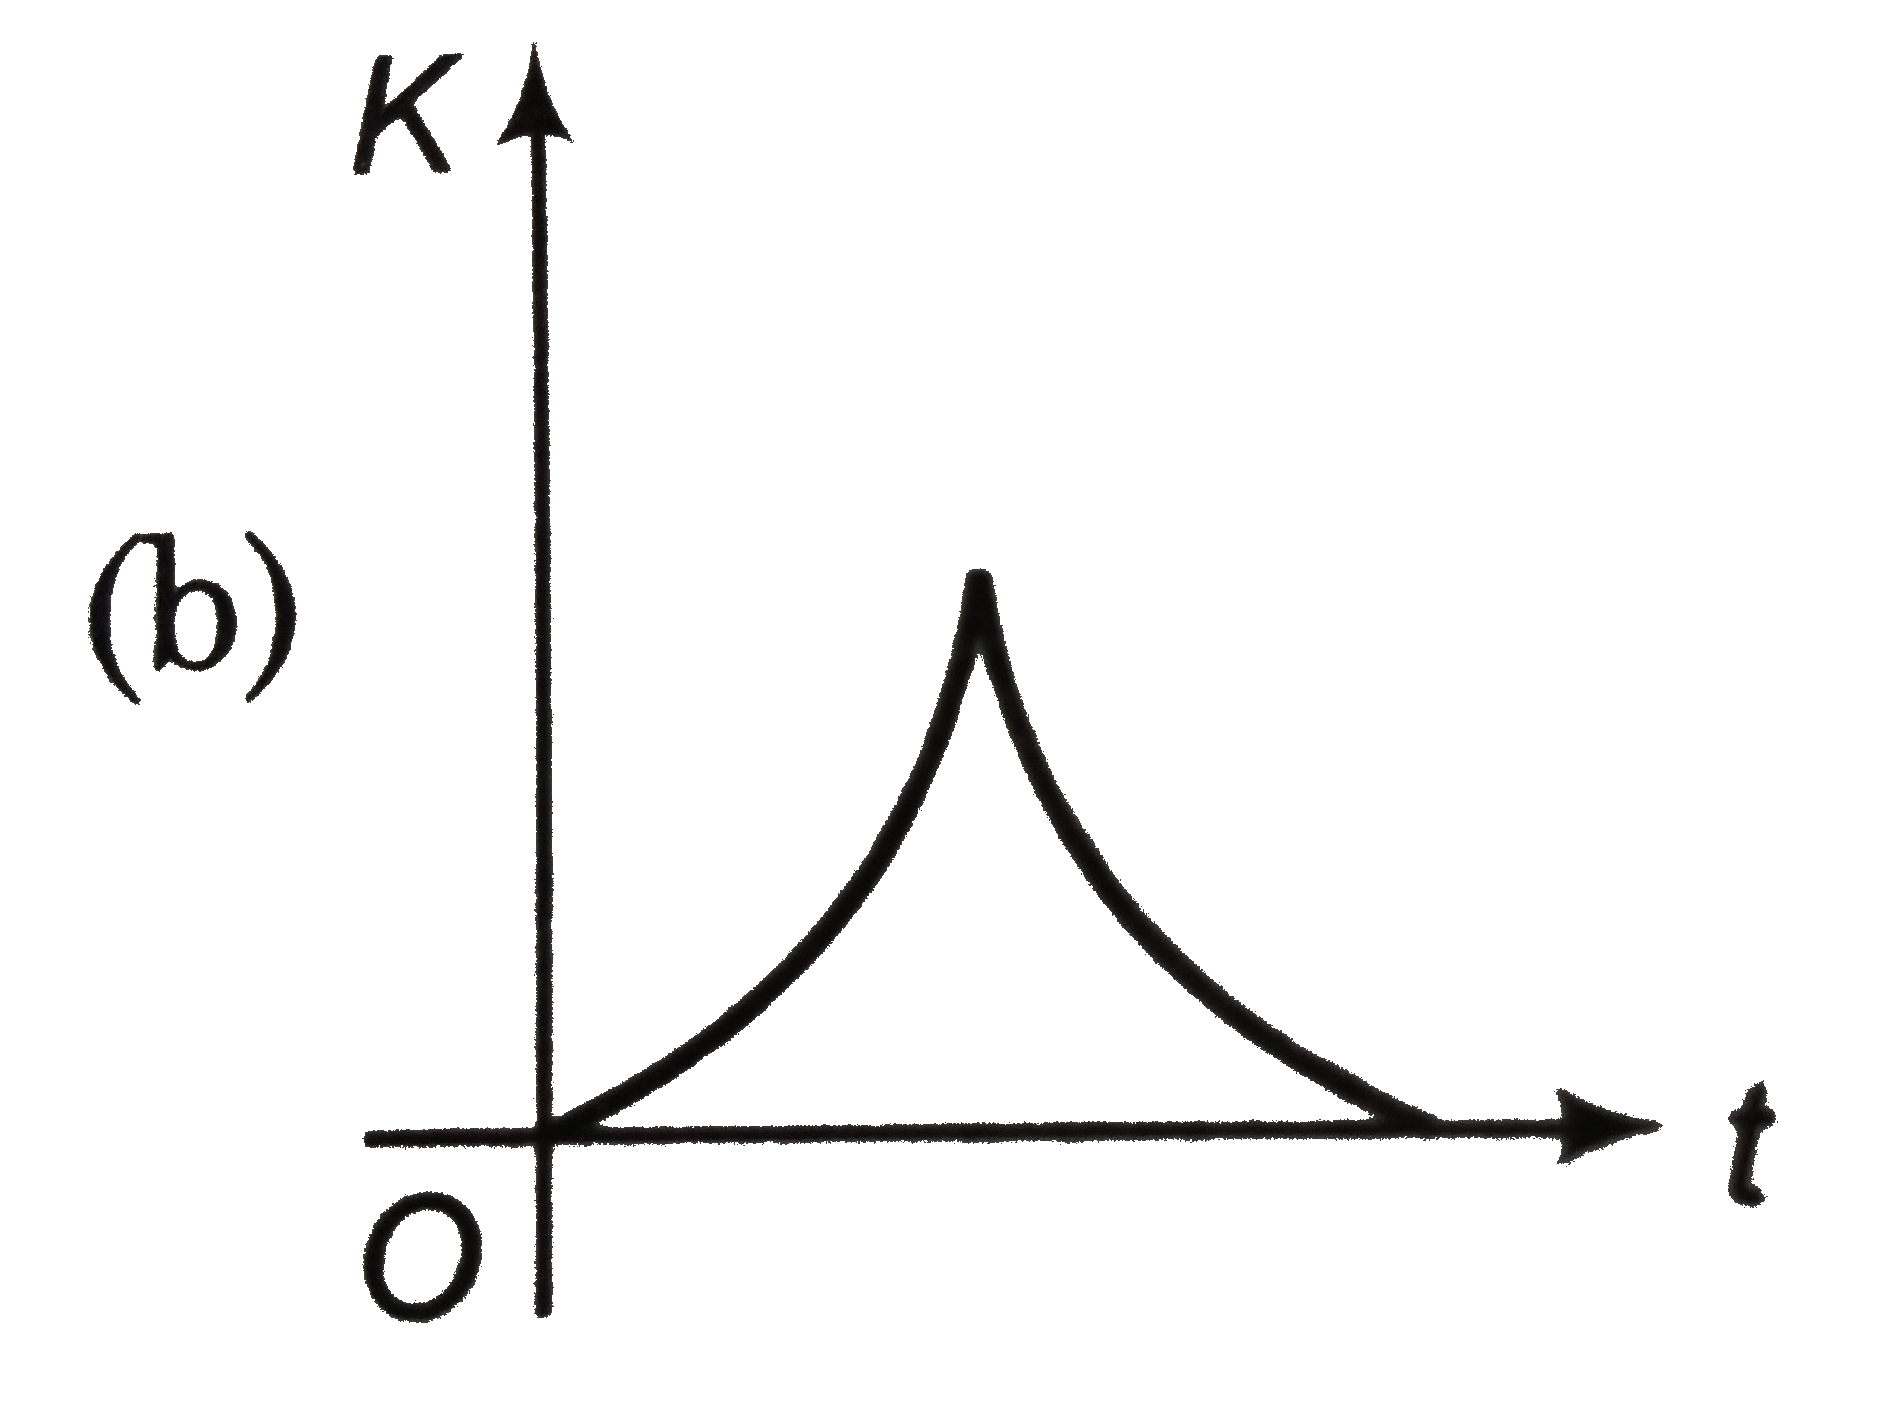
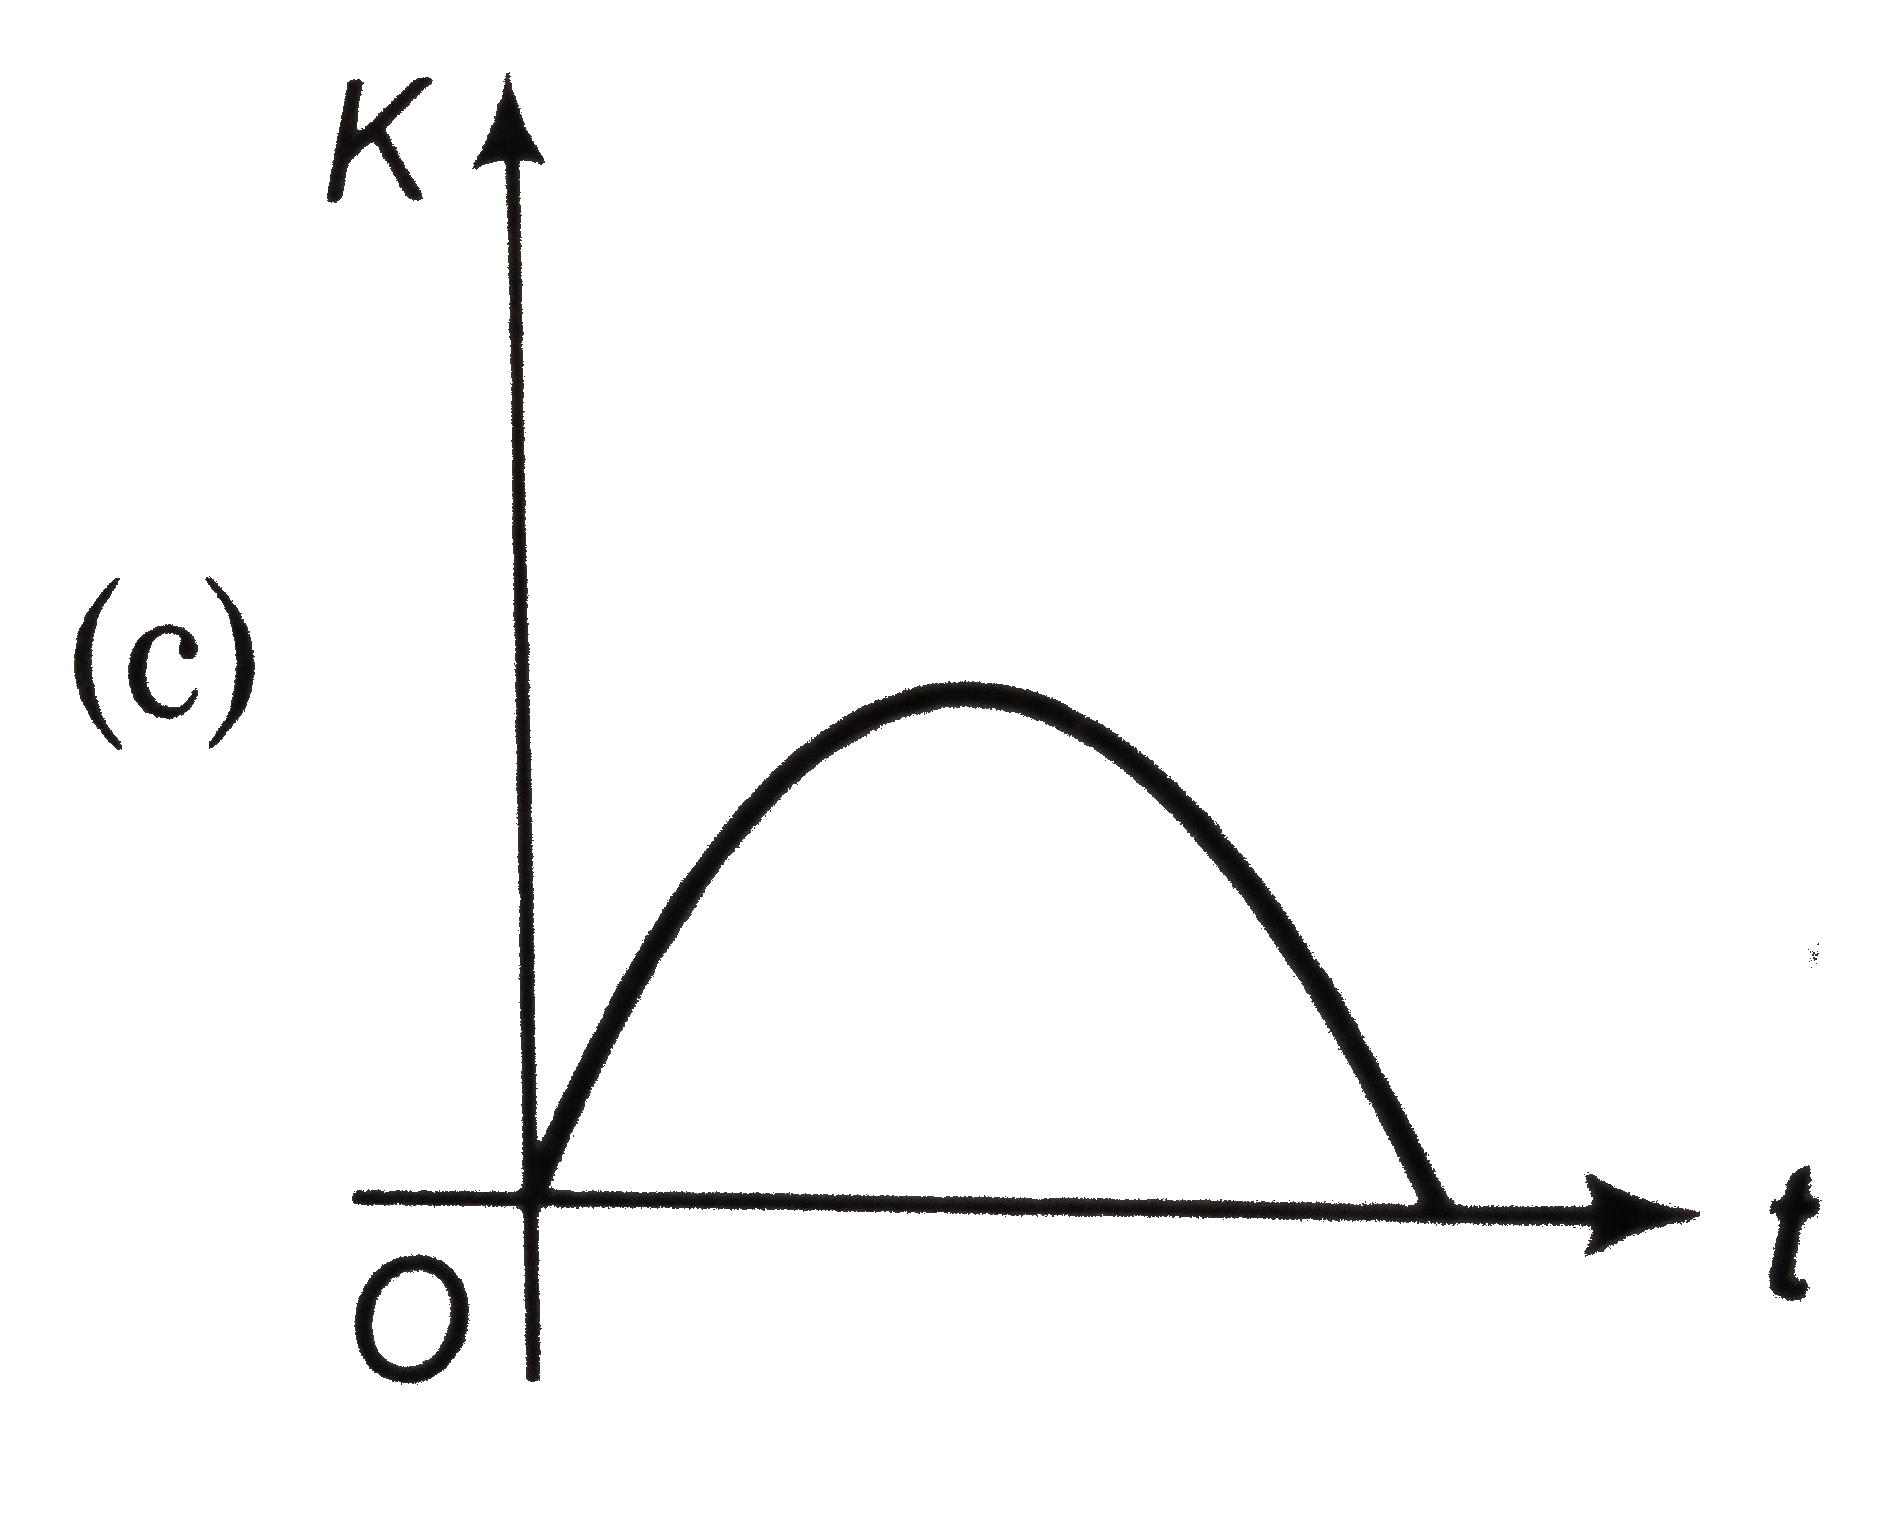

The correct Answer is:B
K=12mv2=12m(gt2)
i.e. K∝t2
i.e. during downward motion. K−t graph is a parabola passing through origin with K increasing with time. Then in upward journey K will decrease with time.
Topper's Solved these Questions
- WORK, ENERGY & POWERBOOK - DC PANDEY ENGLISHCHAPTER - WORK, ENERGY & POWEREXERCISE - Level 1 subjective
27 Videos
- WORK, ENERGY & POWERBOOK - DC PANDEY ENGLISHCHAPTER - WORK, ENERGY & POWEREXERCISE - Level 2 Objective
30 Videos
- WORK, ENERGY & POWERBOOK - DC PANDEY ENGLISHCHAPTER - WORK, ENERGY & POWEREXERCISE - Level 1 Assertion And Reason
12 Videos
- WAVE MOTIONBOOK - DC PANDEY ENGLISHCHAPTER - WAVE MOTIONEXERCISE - Integer Type Question
11 Videos
- WORK, ENERGY AND POWERBOOK - DC PANDEY ENGLISHCHAPTER - WORK, ENERGY AND POWEREXERCISE - MEDICAL ENTRACES GALLERY
33 Videos
Similar Questions
A ball is dropped from height 'H' onto a horizontal surface. If the coefficient of restitution is 'e' then the total time after which it comes to rest is
View SolutionA ball is dropped from height 'H' onto a horizontal surface. If the coefficient of restitution is 'e' then the total time after which it comes to rest is
View Solution
Knowledge Check
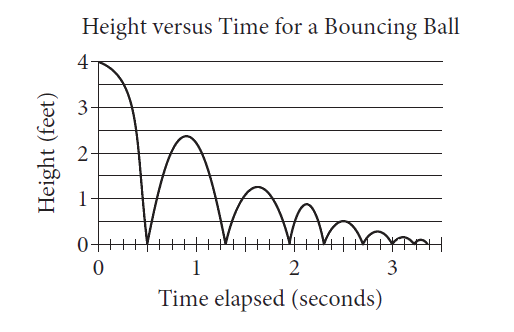
As part of an experiment, a ball was dropped and allowed to bounce repeatedly off the ground until it came to rest. The graph above represents the relationship between the time elapsed after the ball was dropped and the height of the ball above the ground. After it was dropped, how many times was the ball at a height of 2 feet?A1B2C3D4
The figure represents the voltage applied across a pure inductor. The diagram which correctly represents the variation of curent i with time t is given by
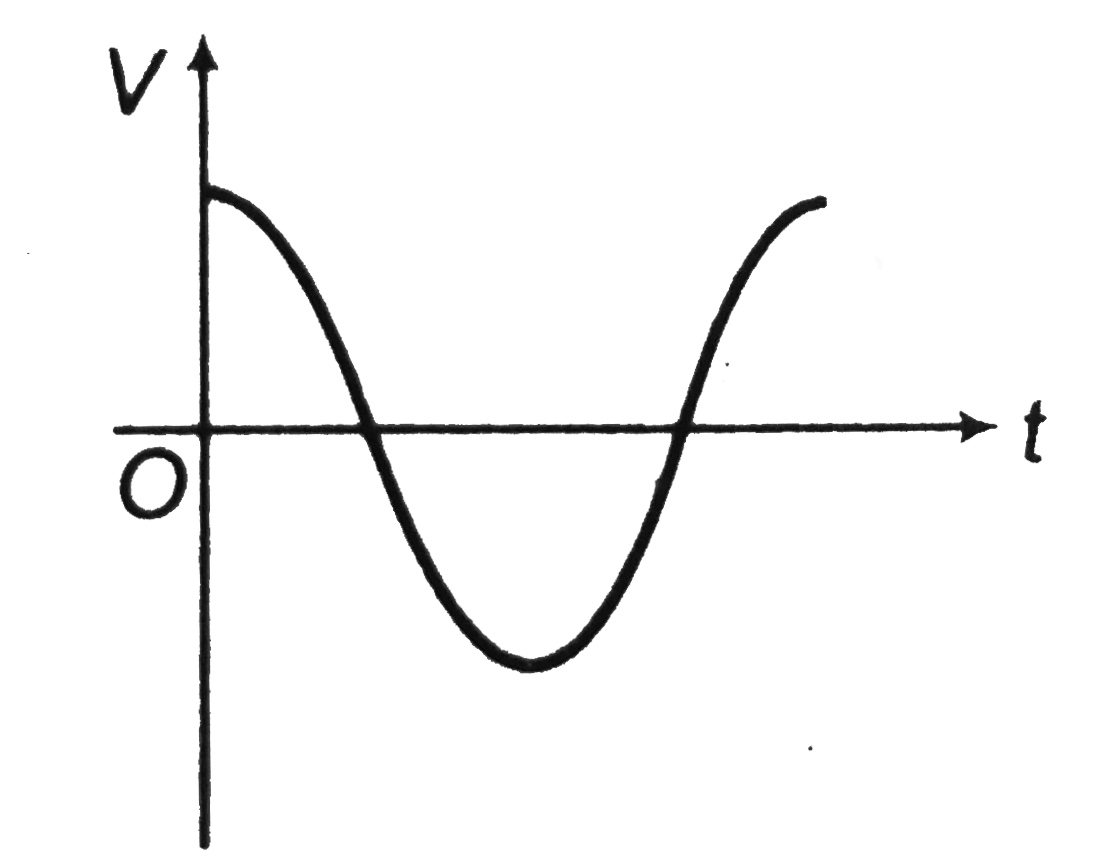 .
.
View SolutionA lead ball at 25∘C is dropped from a height of 2 km. It is heated due to air resistance and it is assumed that all of its kinetic energy is used in increasing the temperature of ball. Find the final temperature of the ball.
View SolutionA ball is projected upwards from a height h above the surface of the earth with velocity v. The time at which the ball strikes the ground is
View SolutionA ball is projected upwards from a height h above the surface of the earth with velocity v. The time at which the ball strikes the ground is
View SolutionA 500 g ball is released from a height of 4m. Each time it makes contact with the ground, it loses 25% of its kinetic energy. Find the kinetic energy it possess just after the 3rd hit
View SolutionA ball of density d is dropped on to a horizontal solid surface. It bounces elastically from the surface and returns to its original position in a time t1. Next, the ball is released and it falls through the same height before striking the surface of a liquid of density of dL
(a) If d<dL, obtain an expression (in terms of d, t1 and dL) for the time t2 the ball takes to come back to the position from which it was released.
(b) Is the motion of the ball simple harmonic?
(c) If d=dL, how does the speed of the ball depend on its depth inside the liquid? Neglect all frictional and other dissipative forces. Assume the depth of the liquid to be large.
View SolutionAn object is dropped from a height h from the ground. Every time it hits the ground it looses 50% of its kinetic energy. The total distance covered as t→∞ is -
View Solution
