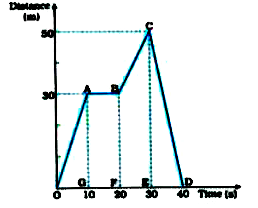
For a particle in motion, distance-time graph is shown in figure. From graph answer the following:
(i) During which time period the particle is stationary?
(ii) Find magnitude of velocity in OA, AB and BC parts.
 Solution in Gujrati
(i) From t=10s to t = 20 s
(ii) 3ms−1,0ms−1and2ms−1
Topper's Solved these Questions
- MOTION BOOK - KUMAR PRAKASHANCHAPTER - MOTION EXERCISE - FILL IN THE BLANKS
50 Videos
- MOTION BOOK - KUMAR PRAKASHANCHAPTER - MOTION EXERCISE - TEXTBOOK EXAMPLES/NUMERICALS
14 Videos
- GRAVITATIONBOOK - KUMAR PRAKASHANCHAPTER - GRAVITATIONEXERCISE - ACTIVITY 10.4
2 Videos
- QUESTION PAPER 01BOOK - KUMAR PRAKASHANCHAPTER - QUESTION PAPER 01EXERCISE - SECTION - D
5 Videos
Similar Questions
A car moving with constant speed of 72 km h 1 is said to be moving at ......... ms−1.
View SolutionAn object travels 16 m in 4s and then another 16 m in 2 s. What is the average speed of the object?
View SolutionTake an empty plastic bottle . Close the mouth of the bottle with an airtight stopper . Put it in a bucket filled with watere . The bottle floats .
Push the bottle into the water. You feel an upward push. Try to push it further down. You will find it difficult to push deeper and deeper. Water exerts a force on the bottle in upward direction. Now release the bottle. It bounces back to the surface.
Does the force due to the gravitational attraction of the earth act on this bottle? If so, why doesn't the bottle stay immersed in water after it is released ?
View SolutionThe mass of a car is 1200 kg. It comes to rest due to retardation of 2ms−2 .
What would be the force (frictional force) acting between the car and road ?
View SolutionThe velocity-time graph of a particle in straight line motion is veloity-time graph of a particle in straight line motion is shown in. The particle starts its motion from origin. . The distance of the particle from the origin after 8 s is .
View SolutionThe graph between the displacement x and time t for a particle moving in a straight line is shown in the figure. During the interval OA, AB, BC and CD the acceleration of the particle is OA, AB, BC, CD
View SolutionThe velocity-time graph of a body is shown in figure. The ratio of magnitude of average acceleration during the intervals OA and AB is

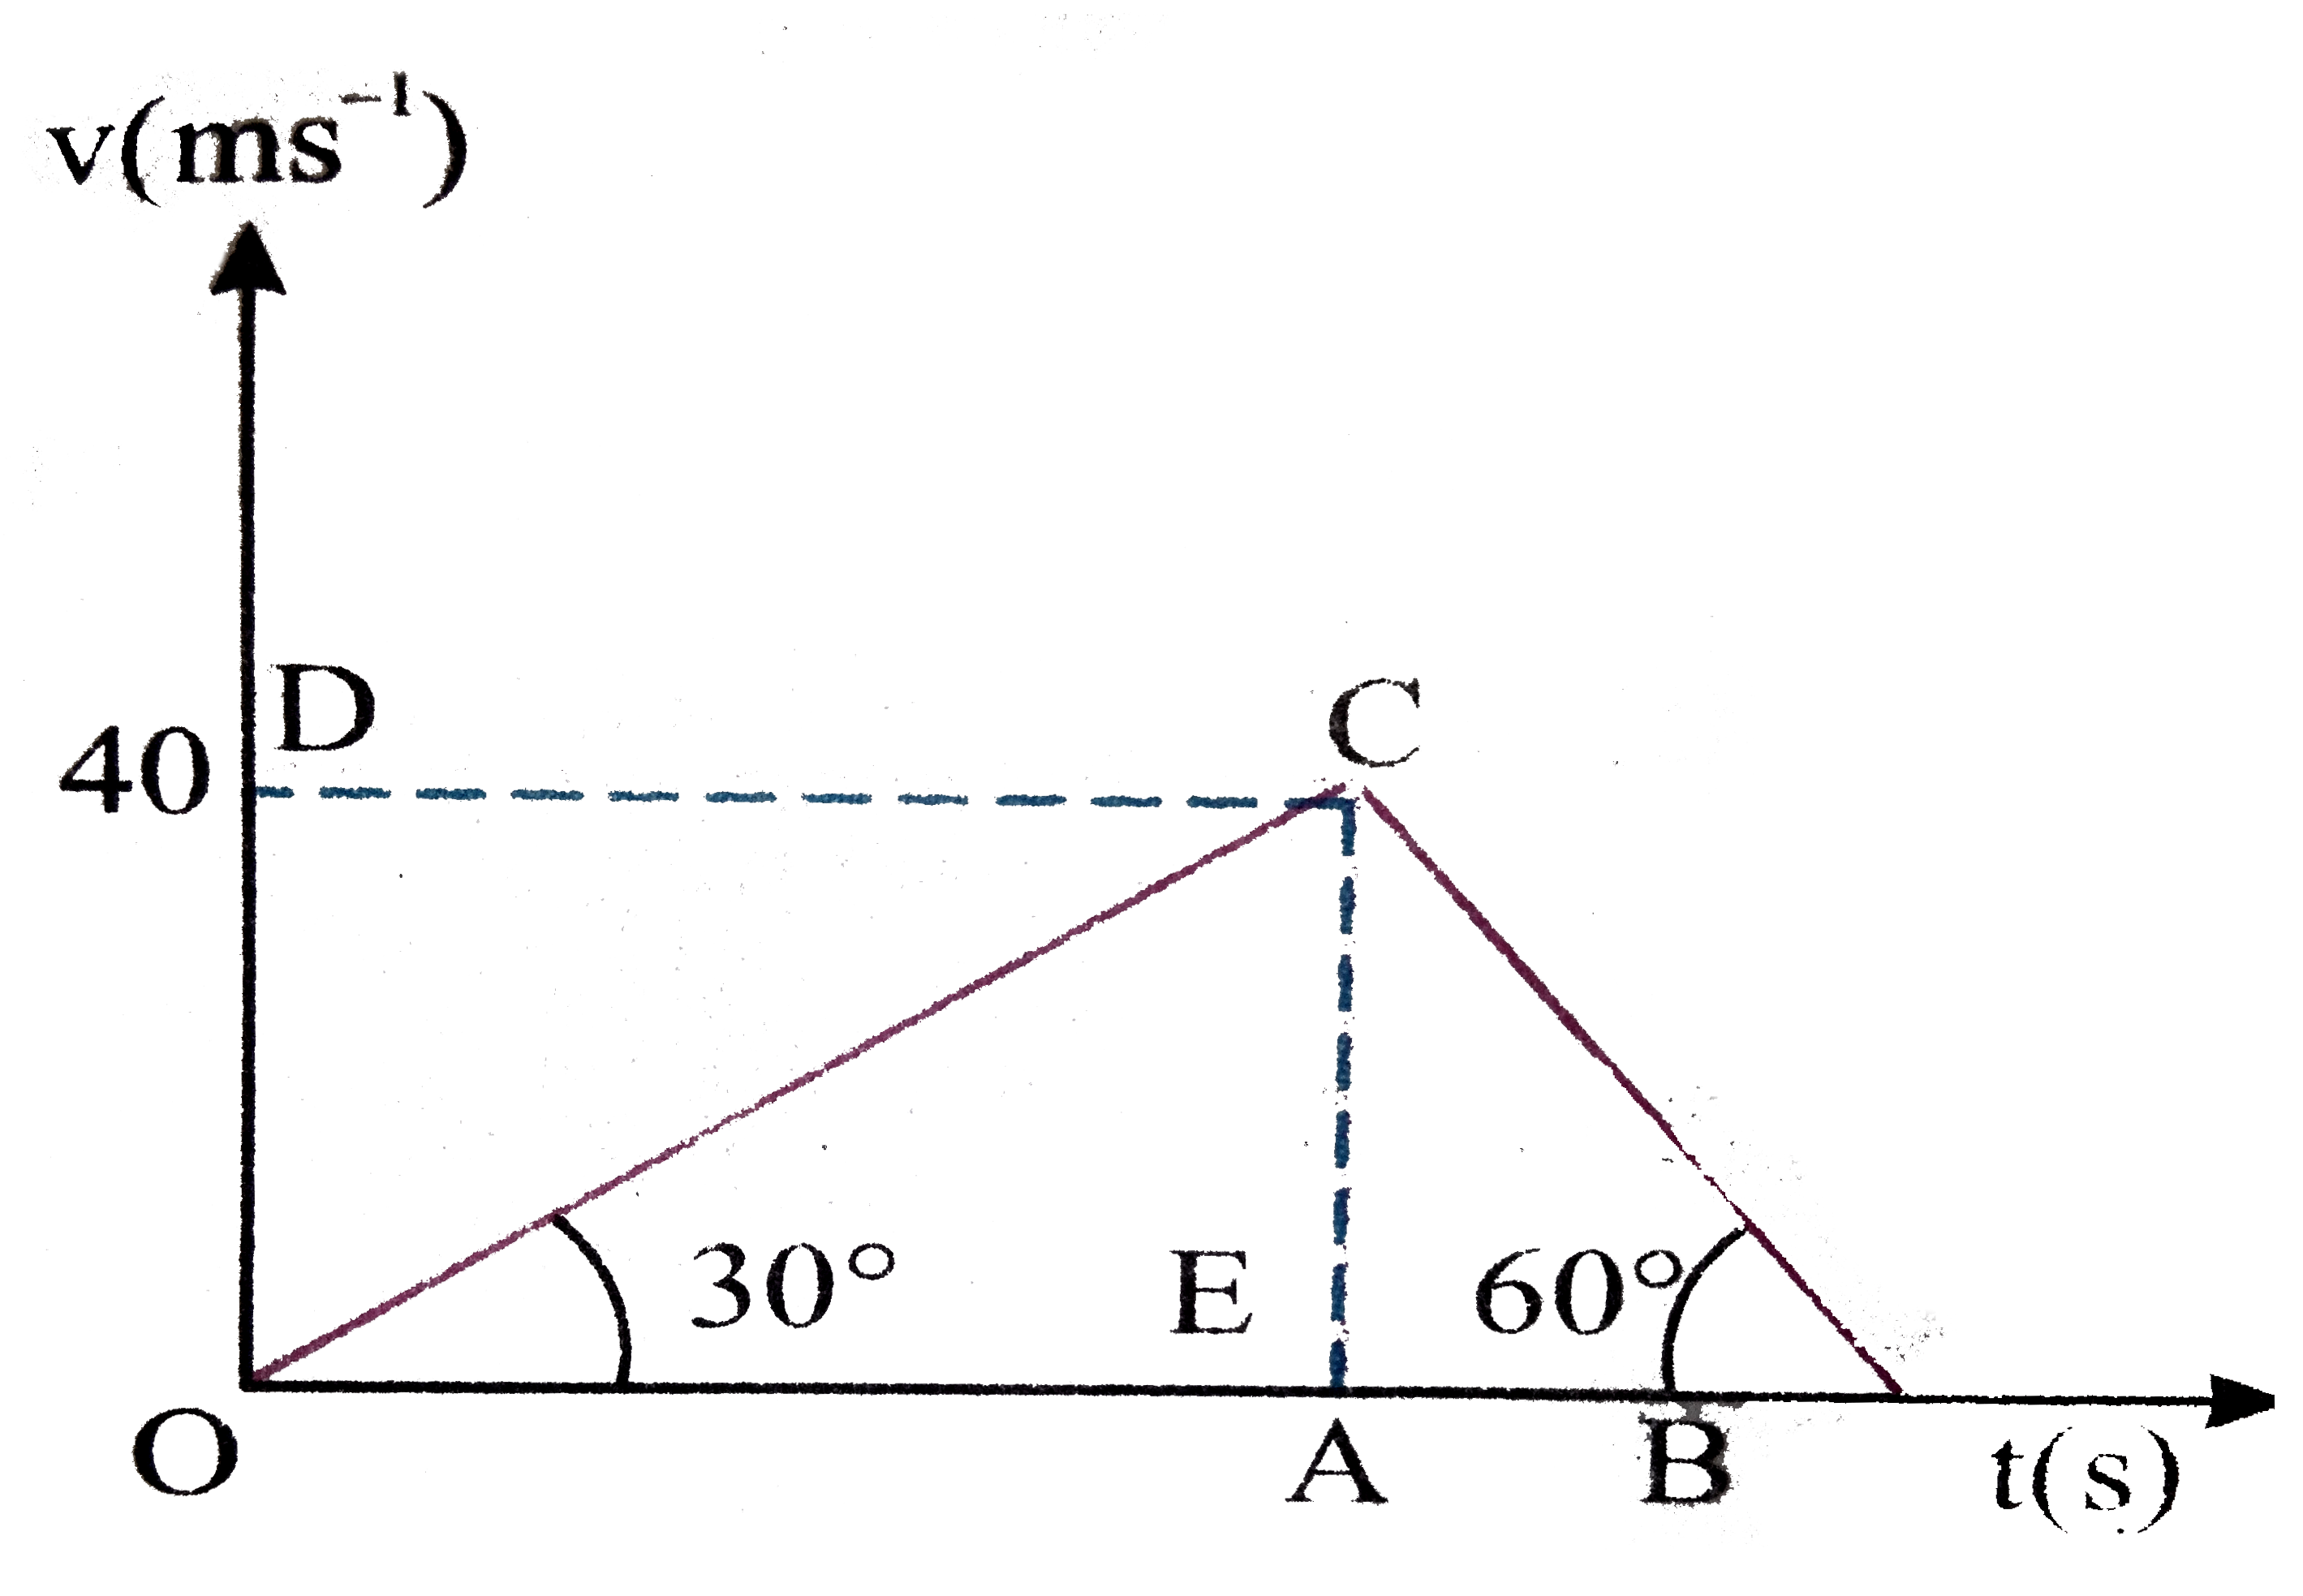
View SolutionThe velocity − time graph of a particle is as shown in figure

View Solutionएक कण मध्य स्थिति से सरल आवर्त गति प्रारम्भ करता है । सरल आवर्त गति कण का , (i ) वेग - समय ग्राफ , (ii) त्वरण - समय ग्राफ खींचिये ।
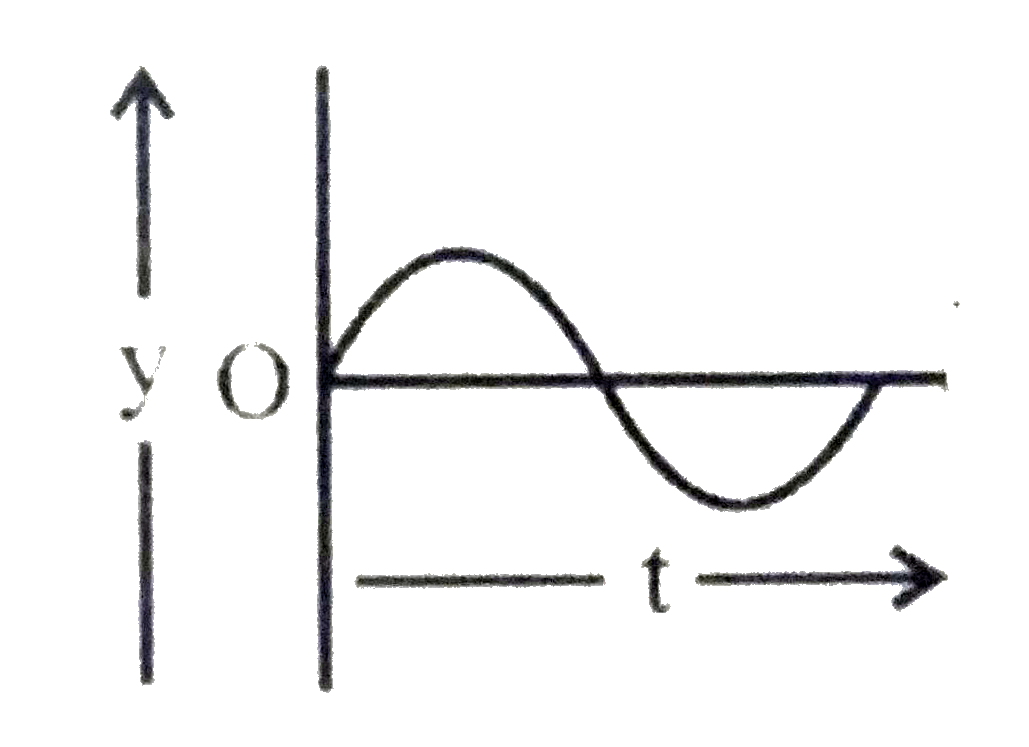
View SolutionThe displacement-time graph of a particle executing simple harmonic motion is shown in the figure

Which one of the following graphs is the correct forcetime graph for the motion of the particle ?
View Solutionएक सरल रेखीय गति करने वाले कण का वेग-समय ग्राफ चित्र में प्रदर्शित है| इस ग्राफ से ज्ञात कीजिए-
(i) वह समयांतराल जिसमे कण की गति एकसमान गति है|
(ii) भाग OA में त्वरण|
(iii) भाग AB में मंदन|
(iv) पहले 2 सेकंड में कण द्वारा तय किया गया विस्थापन|
View Solutionvelocity time graph of a particle is shown in figure. Find displacement of the particle.
View SolutionThe graph between the displacement x and time t for a particle moving in a straight line is shown in figure. During the interval OA, AB, BC and CD, the acceleration of the particles is
View Solutionसरल आवर्त गति कर रहे किसी कण के समय-विस्थापन ग्राफ को चित्र में दिखाया गया है।

इसके संगत कण का बल -समय ग्राफ है
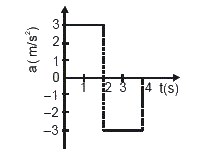
View Solutionएक कण की गति सम्बन्धित त्वरण-समय ग्राफ चित्र में प्रदर्शित है। 0-4 s समयान्तराल के लिए वेग-समय वक्र ग्राफ होगाः -

View Solution
