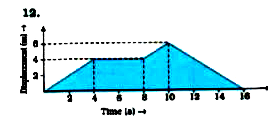
Use the data given in the following table and draw the displacement-time graph for the object :

Using the graph, find the average velocity (i) for first 4s (ii) for next 4s and (iii) for last 6 s.Solution in Gujrati

(i) For first 4s, average velocity =1ms−1
(ii) For next 4 s, average velocity =0ms−1
(iii) For last 6s, average velocity =−1ms−1
Topper's Solved these Questions
- MOTION BOOK - KUMAR PRAKASHANCHAPTER - MOTION EXERCISE - FILL IN THE BLANKS
50 Videos
- MOTION BOOK - KUMAR PRAKASHANCHAPTER - MOTION EXERCISE - TEXTBOOK EXAMPLES/NUMERICALS
14 Videos
- GRAVITATIONBOOK - KUMAR PRAKASHANCHAPTER - GRAVITATIONEXERCISE - ACTIVITY 10.4
2 Videos
- QUESTION PAPER 01BOOK - KUMAR PRAKASHANCHAPTER - QUESTION PAPER 01EXERCISE - SECTION - D
5 Videos
Similar Questions
A car moving with constant speed of 72 km h 1 is said to be moving at ......... ms−1.
View SolutionAn object travels 16 m in 4s and then another 16 m in 2 s. What is the average speed of the object?
View SolutionTake an empty plastic bottle . Close the mouth of the bottle with an airtight stopper . Put it in a bucket filled with watere . The bottle floats .
Push the bottle into the water. You feel an upward push. Try to push it further down. You will find it difficult to push deeper and deeper. Water exerts a force on the bottle in upward direction. Now release the bottle. It bounces back to the surface.
Does the force due to the gravitational attraction of the earth act on this bottle? If so, why doesn't the bottle stay immersed in water after it is released ?
View SolutionThe mass of a car is 1200 kg. It comes to rest due to retardation of 2ms−2 .
What would be the force (frictional force) acting between the car and road ?
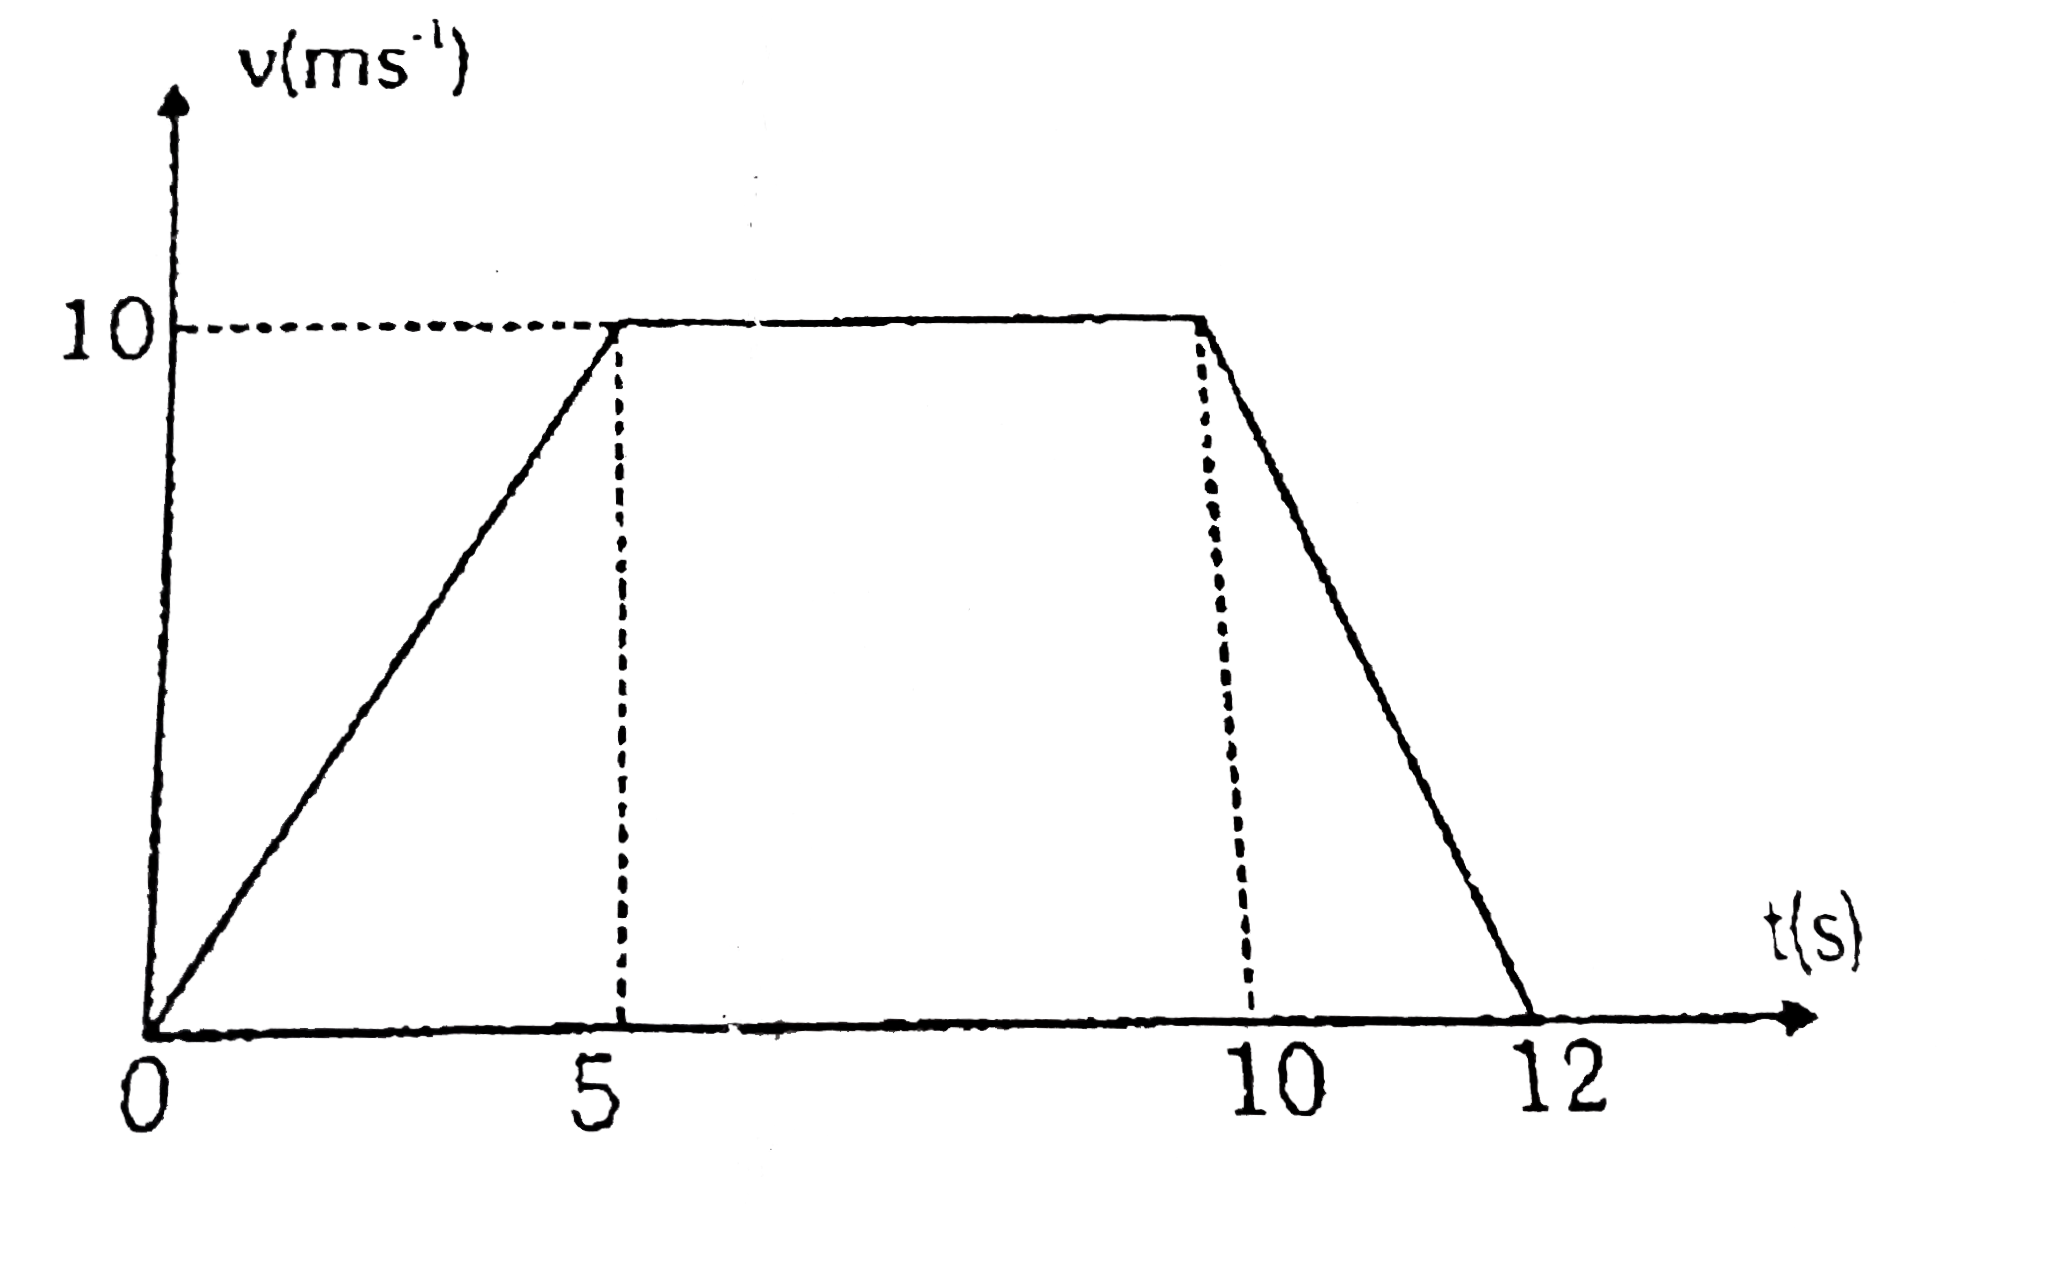
View SolutionDraw displacement time and acceleration -time graph for the given velocity-time graph

View SolutionUsing follwing data, draw time-displacement graph for a moving object. {:("Time (s)",0,2,4,6,8,10,12,14,16),("Displacement (m)",0,2,4,4,4,6,4,2,0):} Use this graph to find average velocity for first 4s, for next 4 s and for last 6 s.
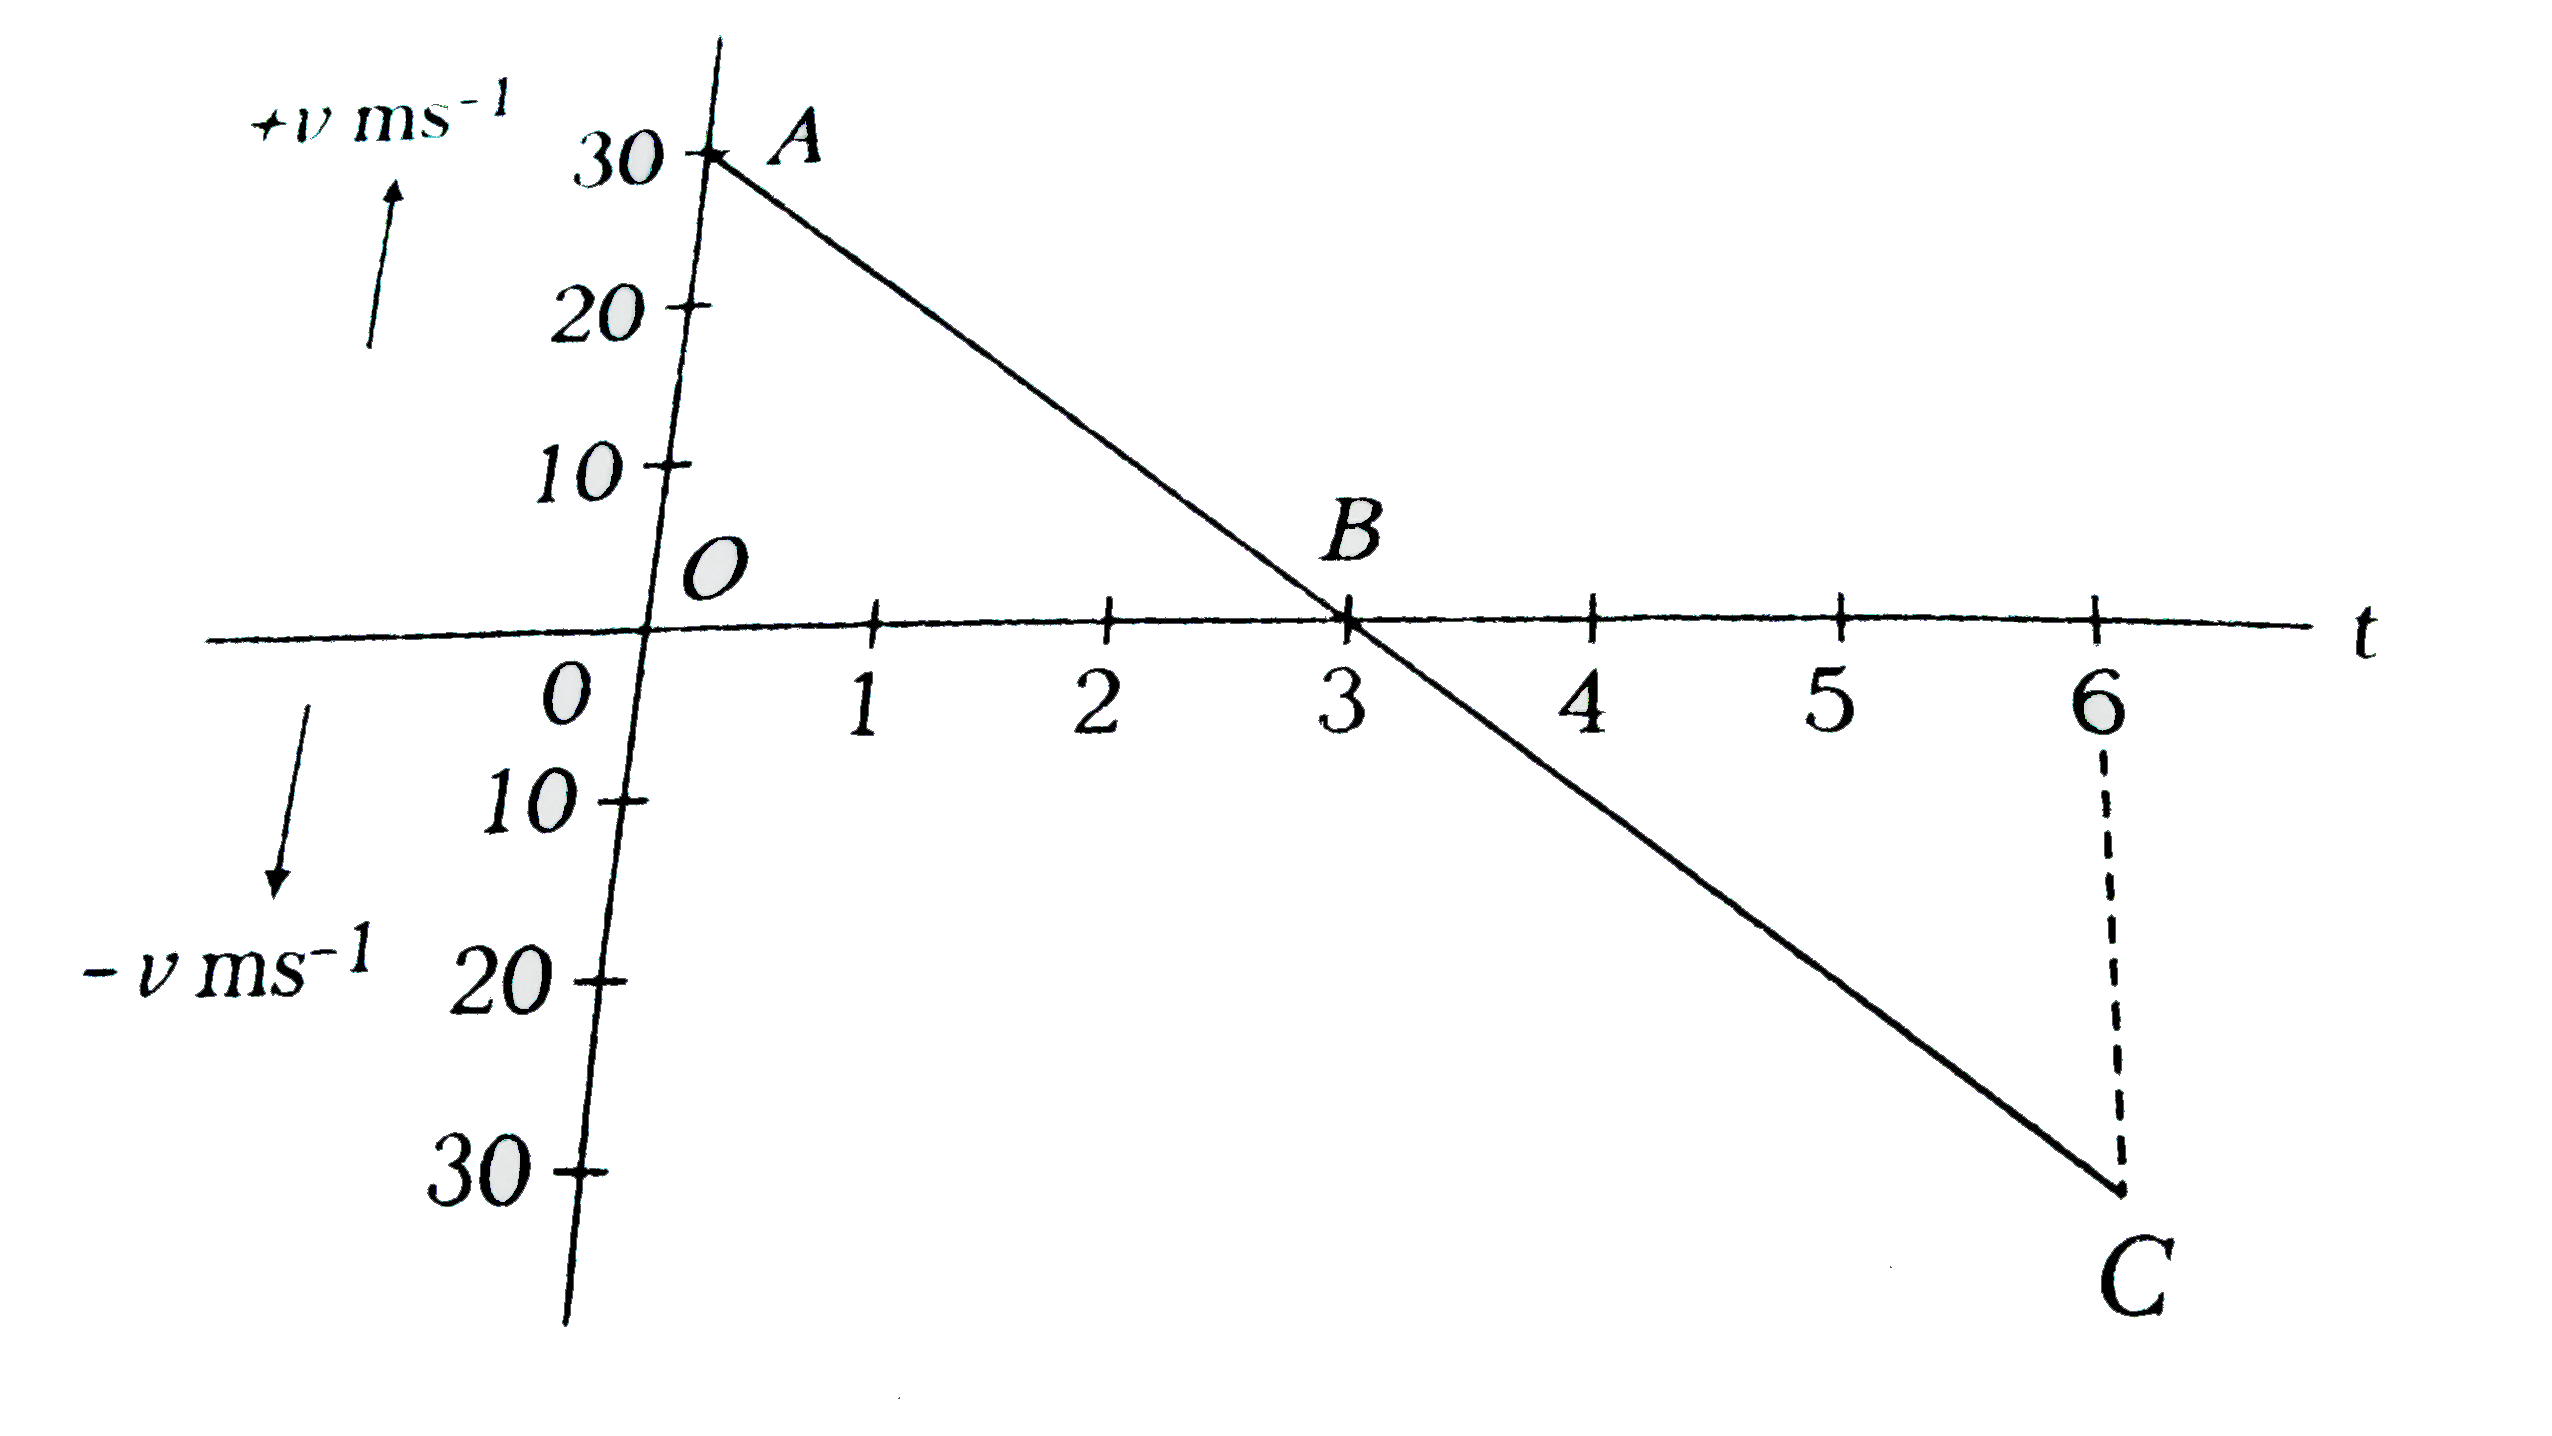
View SolutionWith the help of the given velocity - time graph, find the
(i) displacement in first three seconds and
(ii) acceleration for the graph.

View SolutionA body cover 20 m in 2 s and another 20 m in next 4s. Arrange the following steps in sequential order to find th average velocity of the body .
(A) Find the displacements of the body in first 2s and next 4 s from the given data.
(B) find the displacements of the body .
(C) find the total time taken by the body to complete the total displacement .
(D) Use the formula, average velocity = total displacement Total time taken
View SolutionThe velocity-time graph of an object is given below. Calculate the average acceleration of the object in the time interval of 4 s to 6 s.
View SolutionDraw (i) position-time (ii) velocity-time and (iii) acceleration-time graph for the motion of an object under free fall.
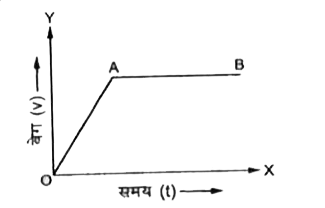
View Solutionबगल के चित्र में वेग - समय ग्राफ दर्शाया गया है। इस ग्राफ का संगत विस्थापन - समय ग्राफ खींचे।

View SolutionUsing follwing data, draw time-displacement graph for a moving object. {:("Time (s)",0,2,4,6,8,10,12,14,16),("Displacement (m)",0,2,4,4,4,6,4,2,0):} Use this graph to find average velocity for first 4s, for next 4 s and for last 6 s.
View SolutionDraw the velocity-time graph for an object in uniform motion. Show that the area under the velocity-time graph gives the displacement of the object in the given time interval.
View Solutionनीचे दिए गए आंकड़ों की सहायता से किसी गतिमान पिंड के लिए विस्थापन-समय ग्राफ खींचिए|
समय (s)0246810121416विस्थापन (m)024446320
इस ग्राफ का उपयोग करके पहले 4 s के लिए अगले 4 s के लिए तथा अंतिम 6s के लिए पिंड का औसत वेग ज्ञात कीजिए|
View SolutionUse the data given in the following table and draw the displacement-time graph for the object :

Using the graph, find the average velocity (i) for first 4s (ii) for next 4s and (iii) for last 6 s.
View Solution