Using follwing data, draw time-displacement graph for a moving object.
Time (s)0246810121416Displacement (m)024446420
Use this graph to find average velocity for first 4s, for next 4 s and for last 6 s.
The correct Answer is:(a) 1 m/s (b) 0 m/s (c) -1 m/s

Average velocity for first 4s = Change in displacementTotal time takan
v = 4−04−0=4m4s=1ms−1
Average velocity for next 4s (i.e., in the interval of 4 s to 8 s ), v = 4−48−4=04=0
Average velocity for last 6 s = (0−6)m(16−10)s=(−66)=−1ms−1
Topper's Solved these Questions
Similar Questions
Find out the average of 2, 4, 6, 8,10,12 and 14.
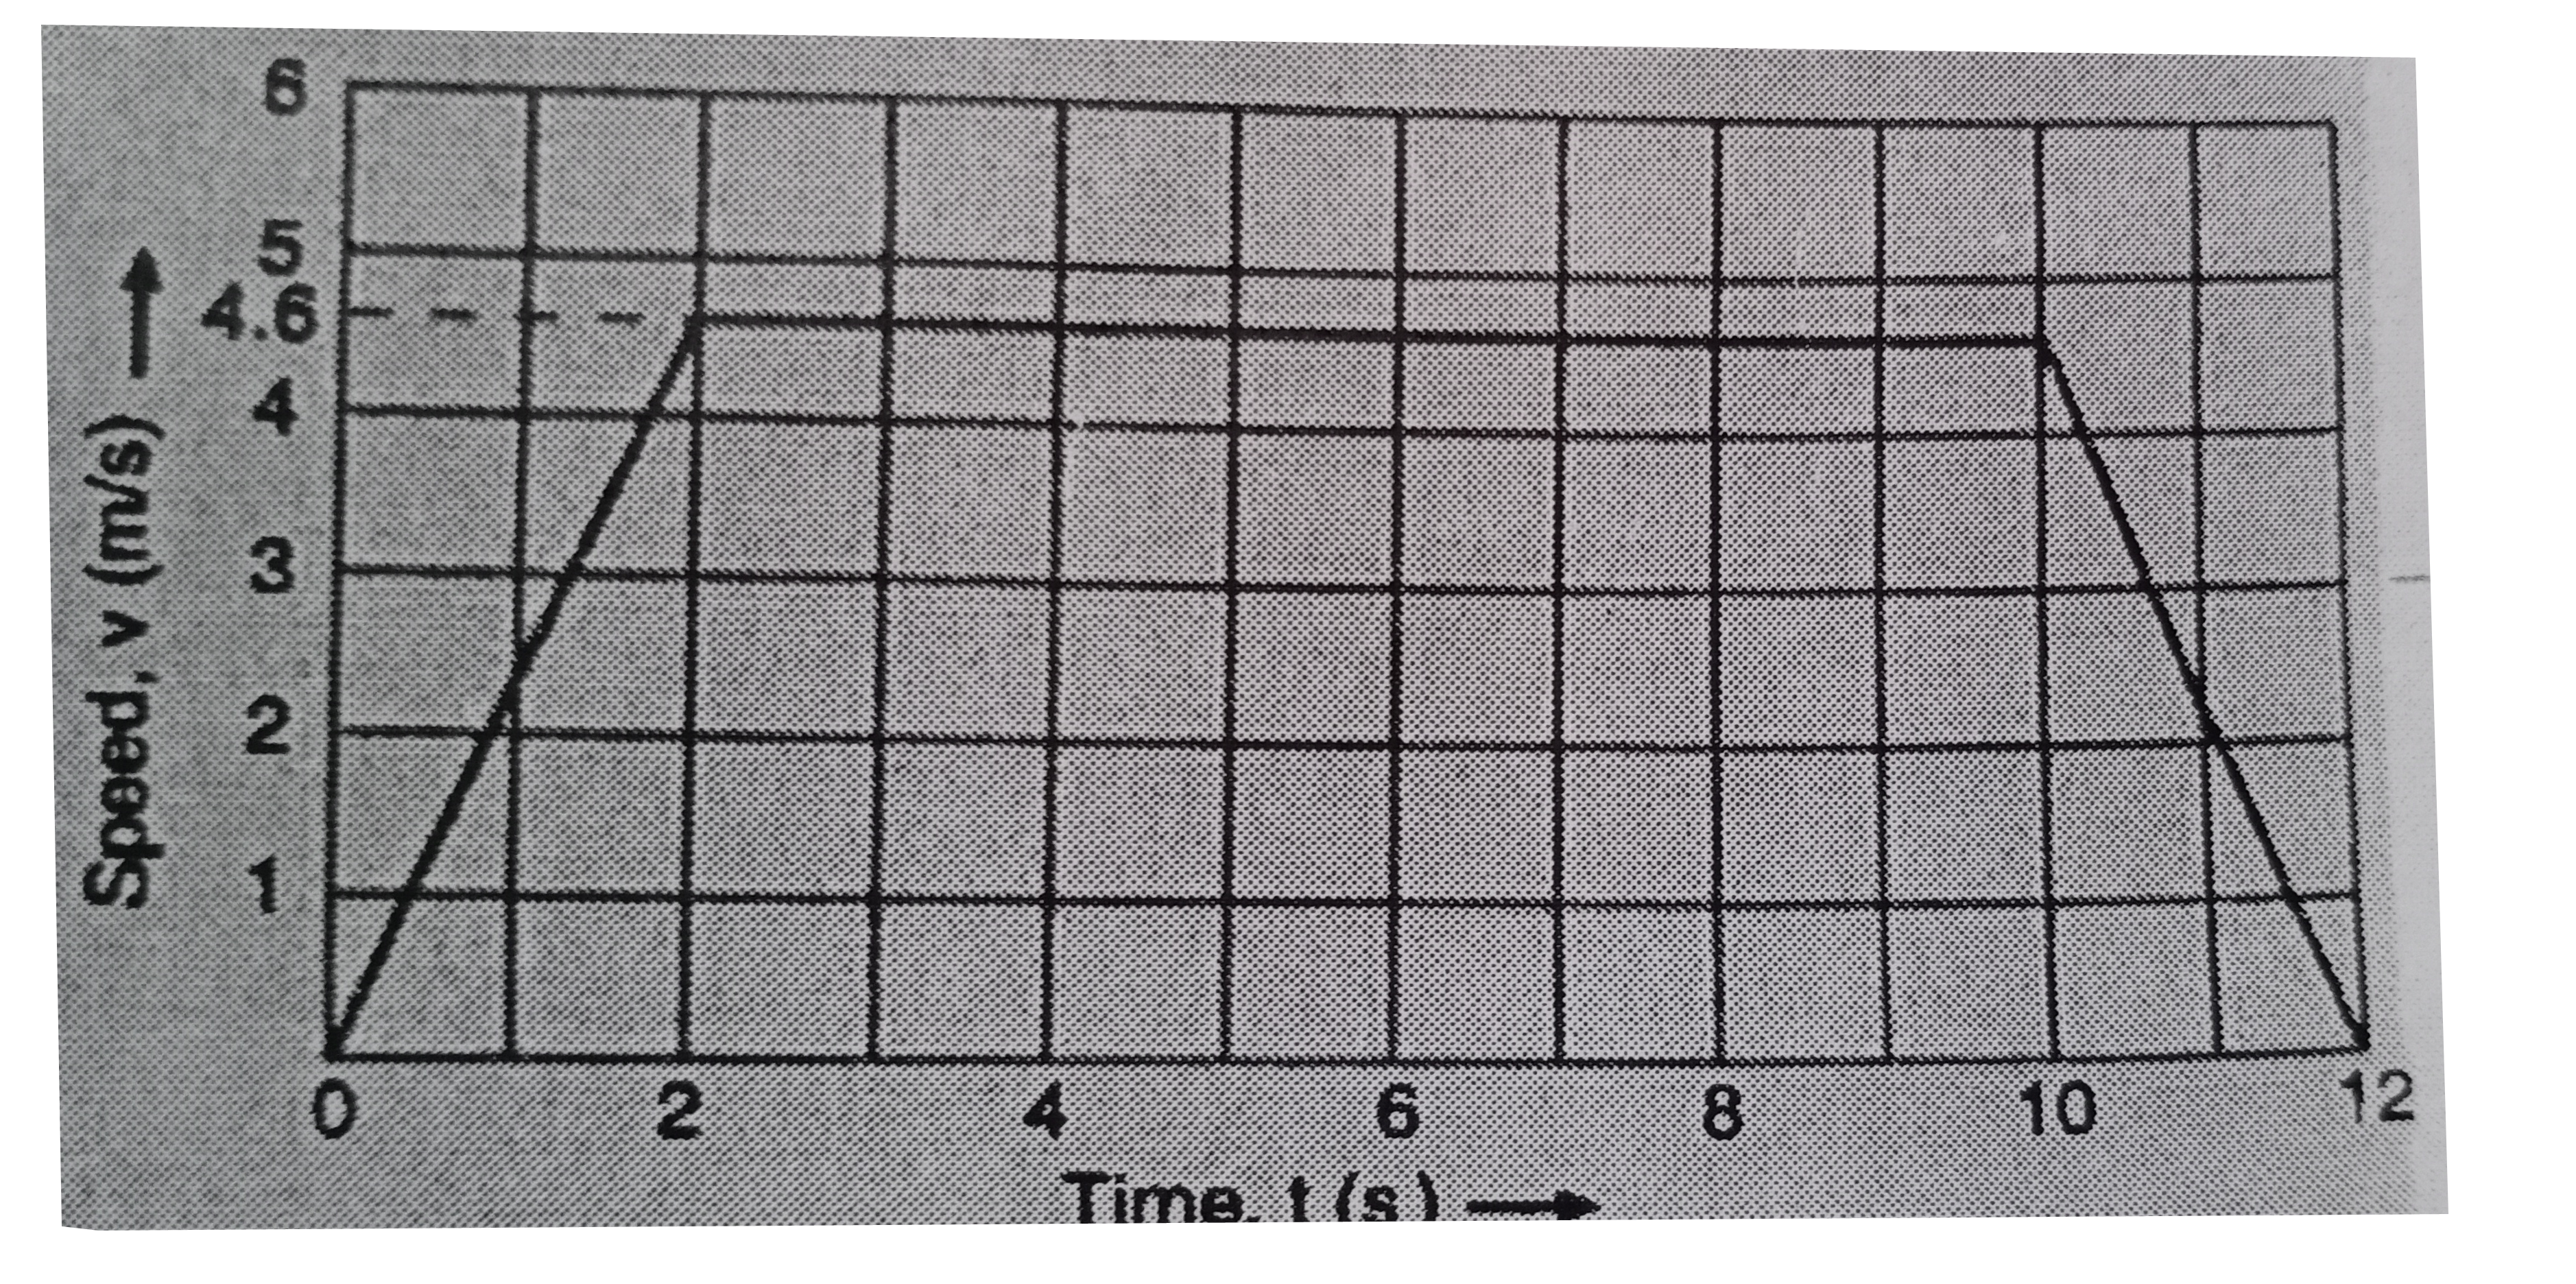
View SolutionA car is moving on a straight road with uniform acceleration. The speed of the car varies with time as follows :
Time(s) :0246810Speed(m/s) :4812162024
Draw the speed-time graph by choosing a convenient scale. From this graph :
(i) Calculate the acceleration of the car.
(ii) Calculate the distance travelled by the car in 10 seconds.

View Solution
Knowledge Check
The speed of a car travelling on a straight road is listed below at successive intervals of 1 is :
Time(s)01234Speed (m/s)02468
Which of the following is/are correct? The car travels
1. with a uniform acceleration of 2 m/s2.
2. 16 m in 4 s.
3. with an average speed of 4 m/s.
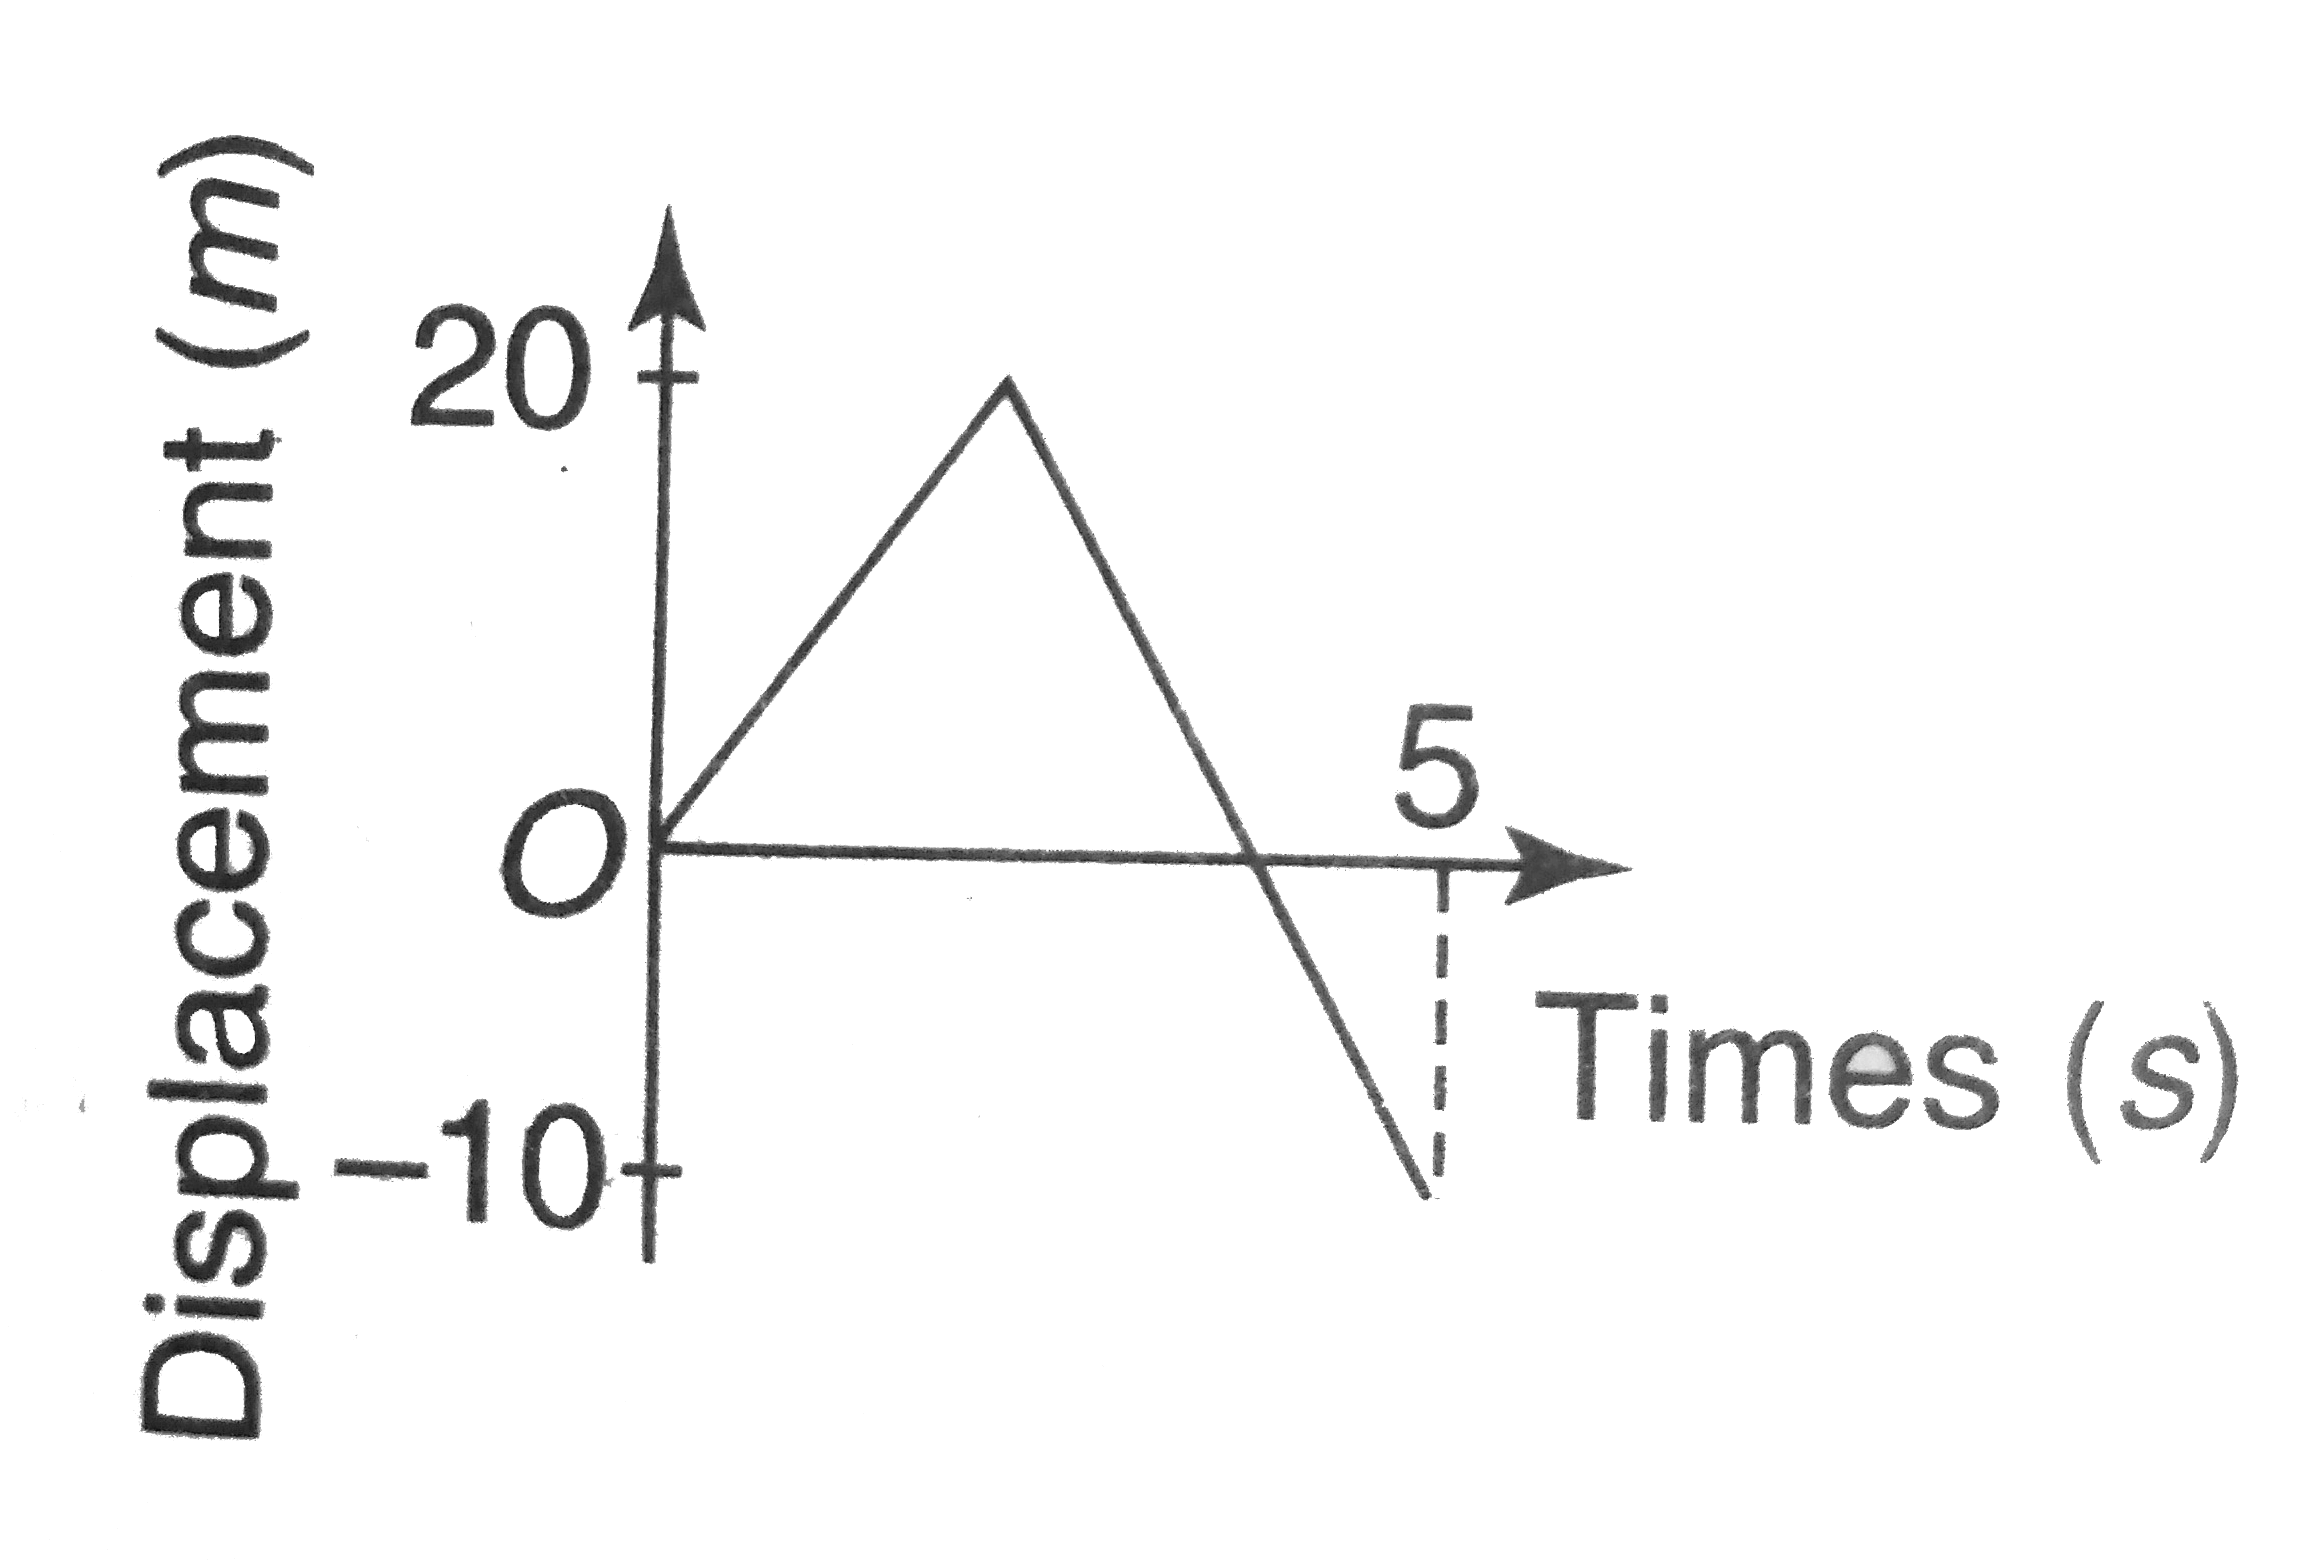
Select the correct answer using the code given below:A1 , 2 and 3B2 and 3 onlyC1 and 2 onlyD1 onlyThe diagram shows the displacement-time graph for a particle moving in a straight line. Find the average velocity for the interval from t=0 to t=5s.
 A−2ms−1B2ms−1C−4ms−1D4ms−1
The diagram shows the displacement-time graph for a particle moving in a straight line. Find the average velocity for the interval from t=0 to t=5s.
 A−2ms−1B2ms−1C−4ms−1D4ms−1
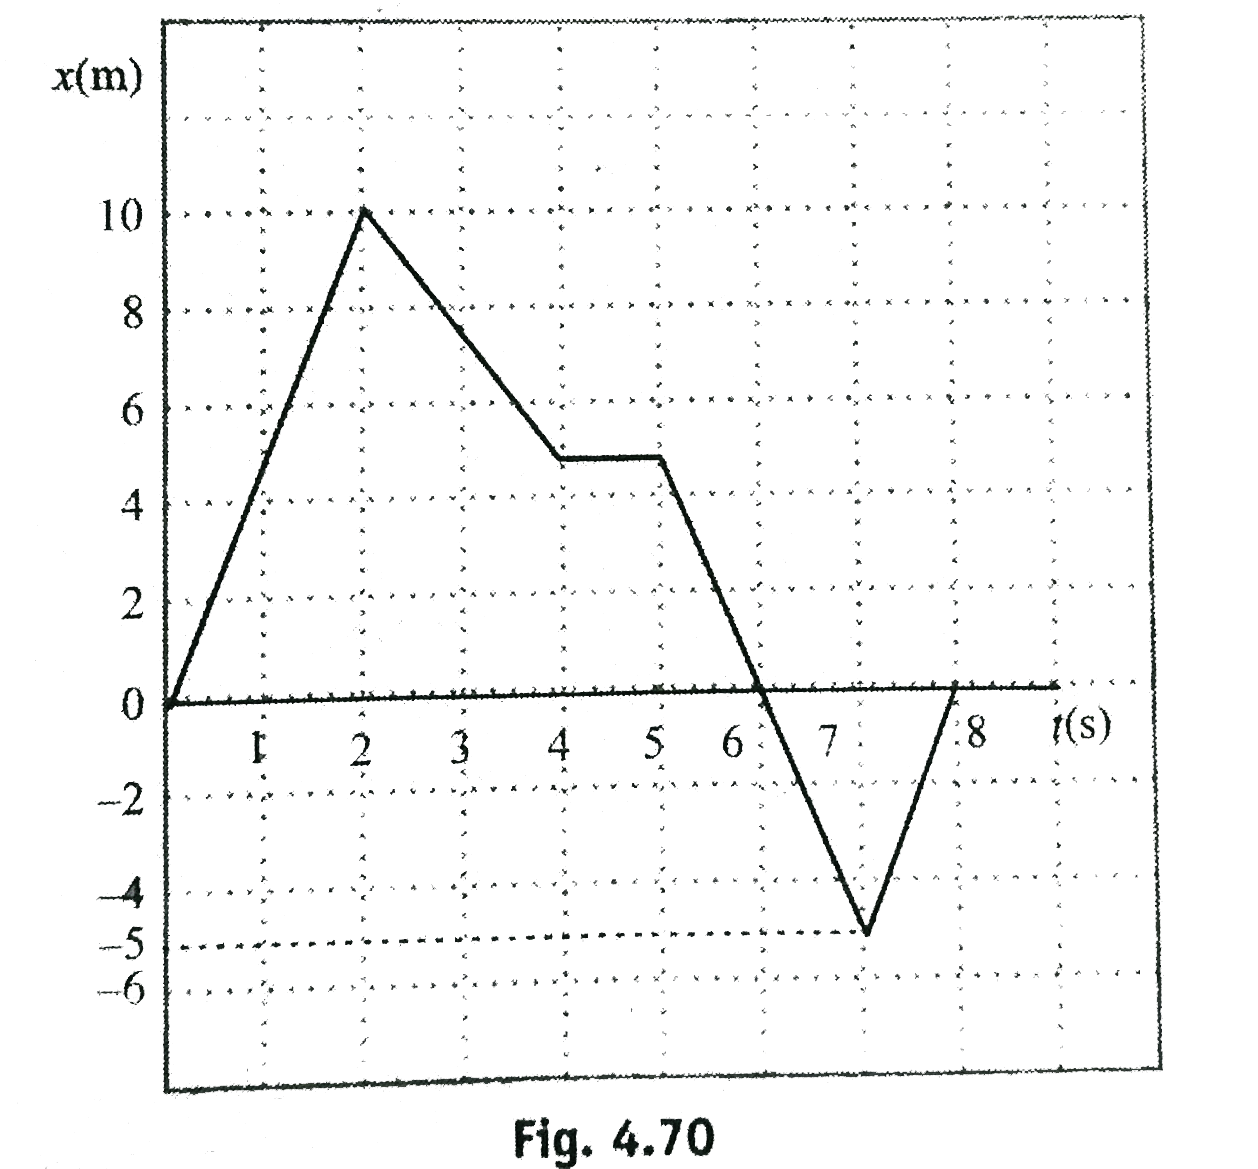
The position verus time graph time graph for a certain particle moving along the x-axis is shown in . Find the average velocity in the time intervals (a) 0 to 2s, (b) 2s to 4s, and (c) 4,s to 7s,
 .
.
View SolutionIf S={2,4,6,8,10,12} and A={4,8,12} find P(A) .
View SolutionThe r.m.s. of speed of a group of 7 gas molecules having speed (6, 4, 2, 0,-2,-4,-6) m/s is
View SolutionThe following table represents the position of a car with time in a fixed direction.

Plot displacement-time graph and find graphically
(i) the velocity of the car
(ii) the displacement of the car at 3.5 s and 4.5 s
View SolutionA body cover 20 m in 2 s and another 20 m in next 4s. Arrange the following steps in sequential order to find th average velocity of the body .
(A) Find the displacements of the body in first 2s and next 4 s from the given data.
(B) find the displacements of the body .
(C) find the total time taken by the body to complete the total displacement .
(D) Use the formula, average velocity = total displacement Total time taken
View Solution
