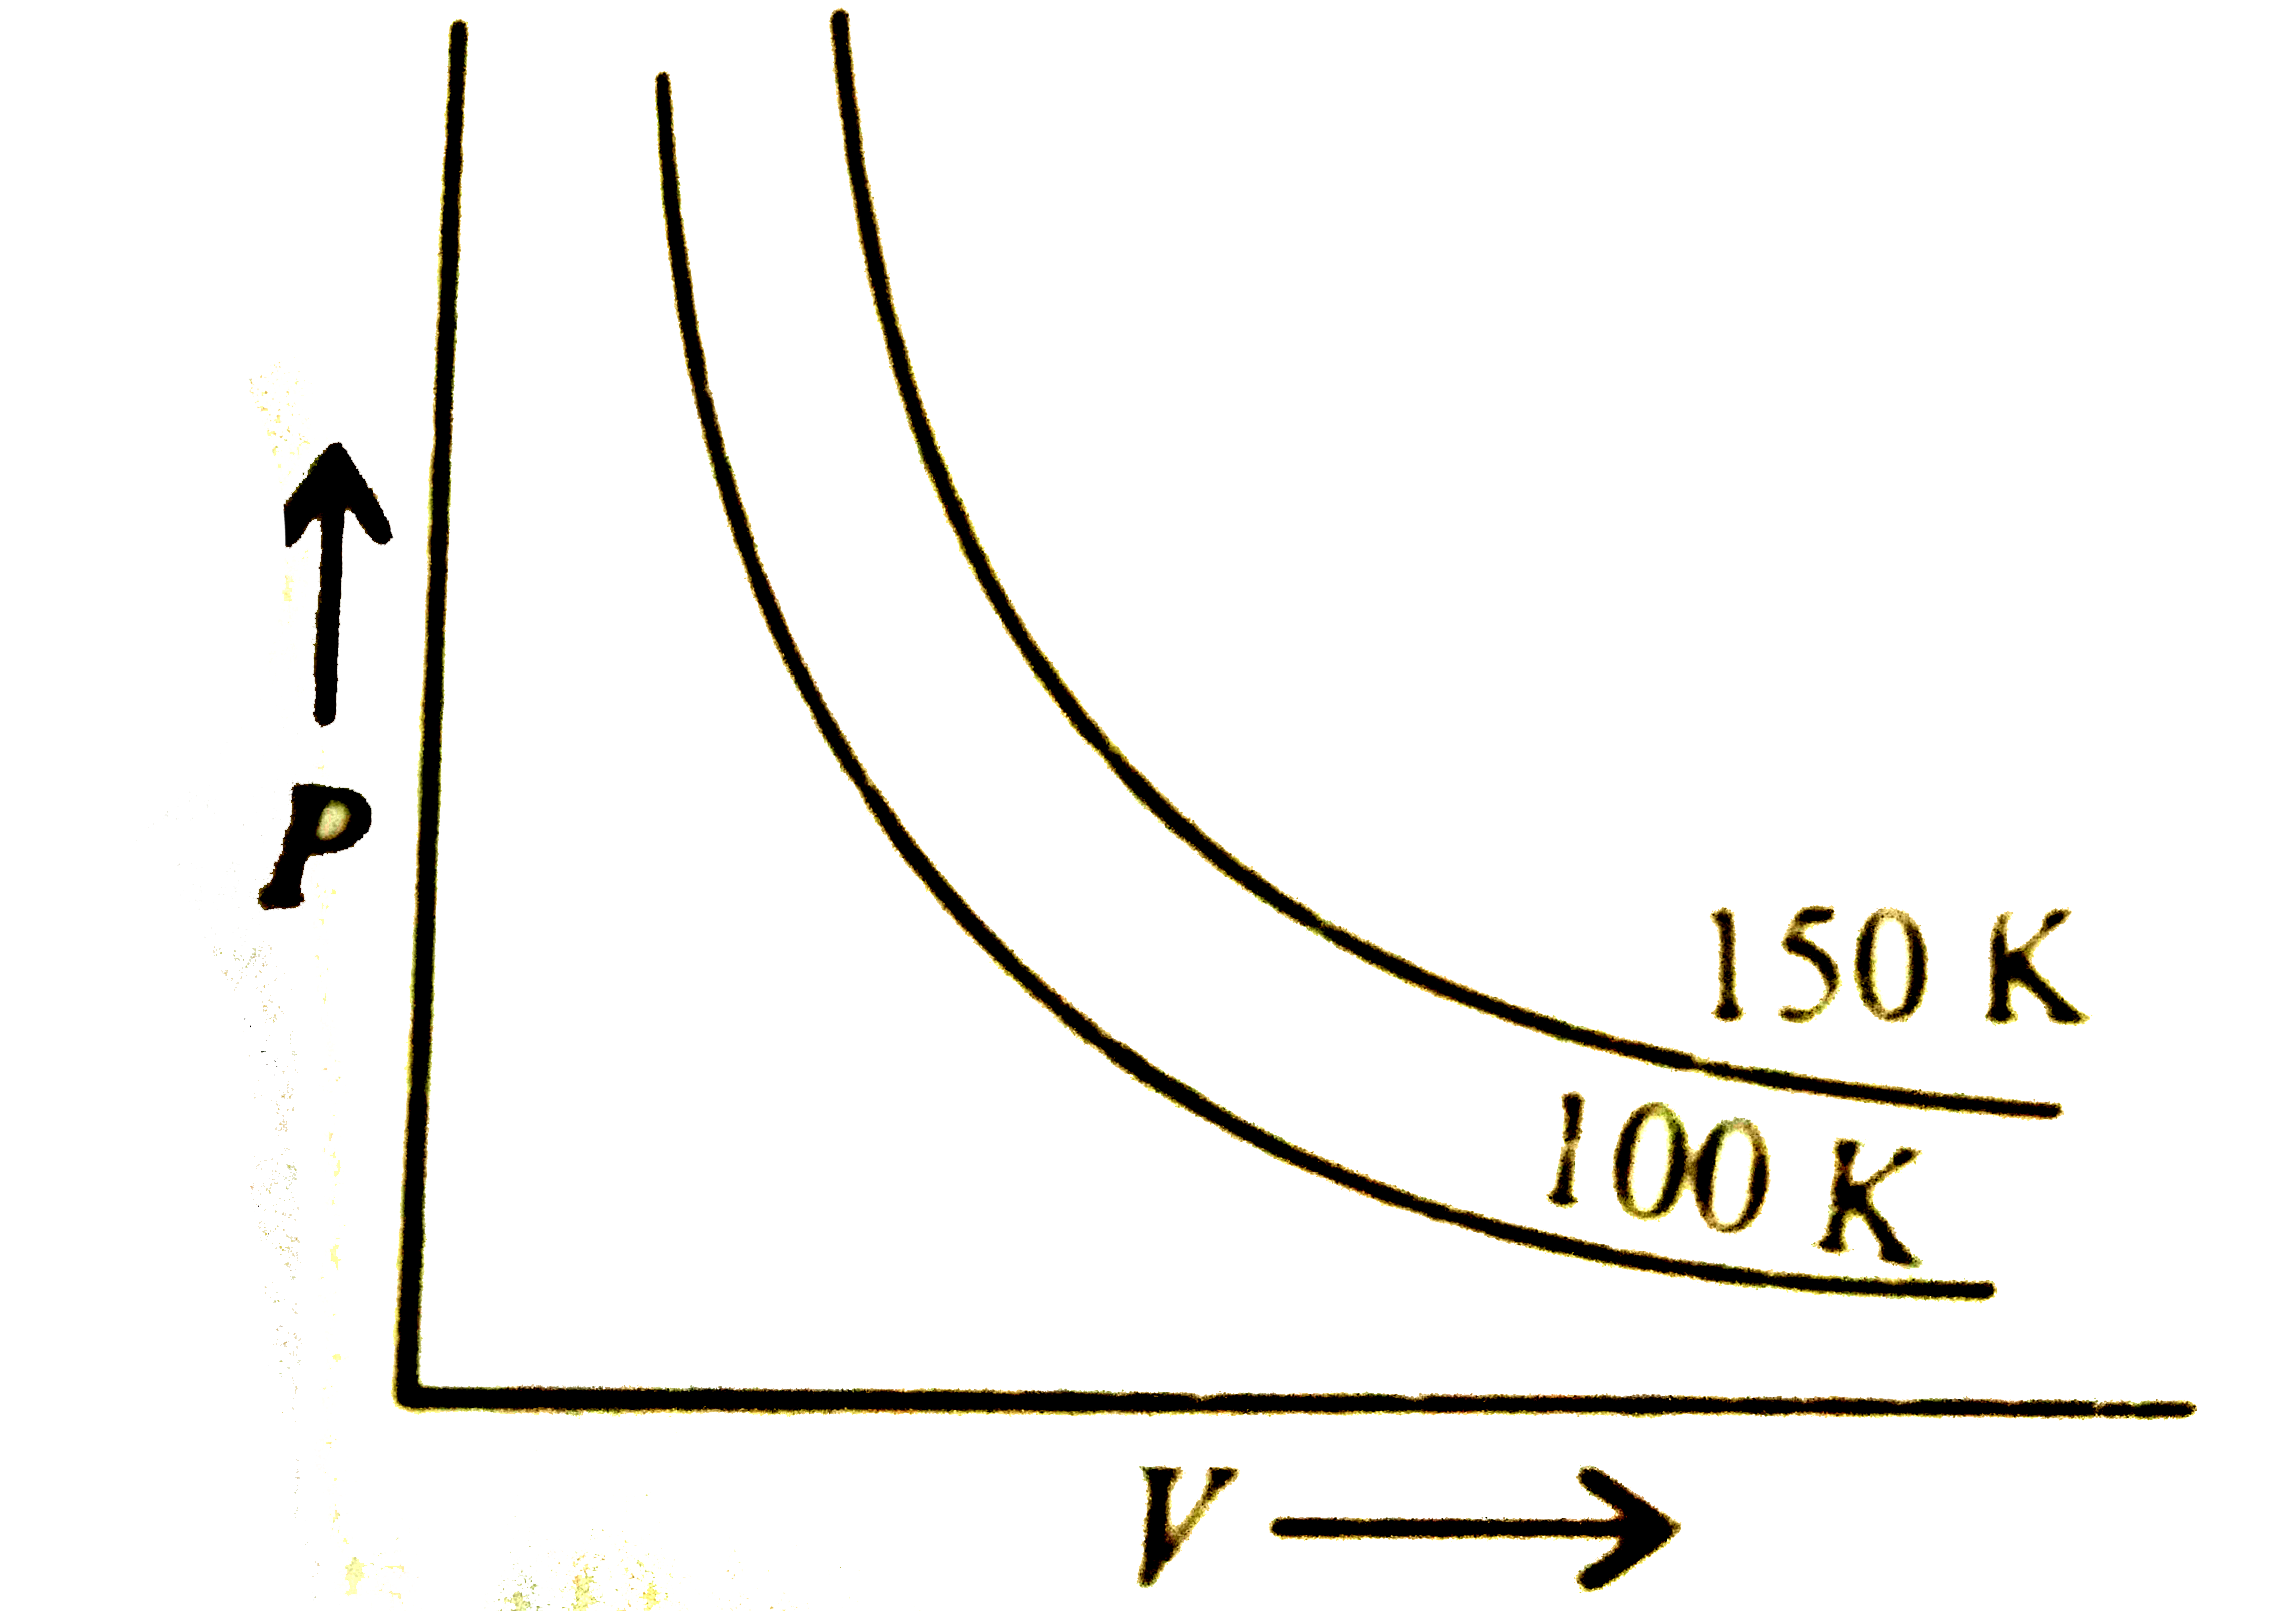
What is the shape of graph between volume and temperature, if pressure is kept constant?Solution in Malayalam
Step by step video & image solution for What is the shape of graph between volume and temperature, if pressure is kept constant? by Physics experts to help you in doubts & scoring excellent marks in Class 11 exams.
Topper's Solved these Questions
Similar Questions
If a satellite of mass m is revolving around the earth with distance r from centre, then total energy is
02:06View SolutionDerive F=ma from Newton's law.
View Solution740 मिमी दाब पर किसी गैस का आयतन 200 मिली है। यदि ताप को स्थिर रखे, तो किस दाब पर गैस का आयतन दो गुना हो जाएगा?
03:52View SolutionAccording to Boyles's law , the shape of the graph between pressure and reciprocal of volume is ____________.
01:10View SolutionA graph is plotted between pressure and volume at different temperature. On the basis of the graph what changes will you observe in the volume if (i) the pressure is increased at constant temperature (ii) the temperature is decreased at constant pressure
01:58View SolutionPressure vs volume graph at constant temperature is known as…………….
01:55View SolutionAccording to Boyle's law, the shape of the graph between pressure and reciprocal of volume is ............
View SolutionThe volume of a given mass of a gas is 100ml at 100∘C. If pressure is kept constant at what temperature will the sample have the volume of 200ml?
View SolutionWhat is the nature of the graph in the following :
i) pressure and volume, keeping temperature constant.
ii) pressure and reciprocal volume, keeping temperature constant.View SolutionWhat is the natuer of the graph in the following : i) volume and temperature on Kelvin scale, keeping pressure constant. ii) pressure and temperature on Kelvin scale, keeping volume constant.
View SolutionState the nature of the graph drawn between volume and temperature at constant pressure. When the graph is extrapolated, at what temperature it meet the temperature axis ?
View SolutionWhat is the nature of the graph plotted between volume and absolute temperature at constant pressure. Which law it will indicate ?
03:39View SolutionState the nature of the graph drawn between pressure and temperature at constant volume. When the graph is extrapolated, at what temperature it meet the temperature axis ?
02:46View SolutionA graph is plotted between pressure and volume at different temperatures . On the basis of the graph what changes will you observe in the volume if
(i) the pressure is increased at constant temperature .
(ii) the temperature is decreased at constant pressure .
 03:12View Solution
What is the shape of graph between pressure pand IV for a perfect gas at constant temperature?
02:55View Solution

