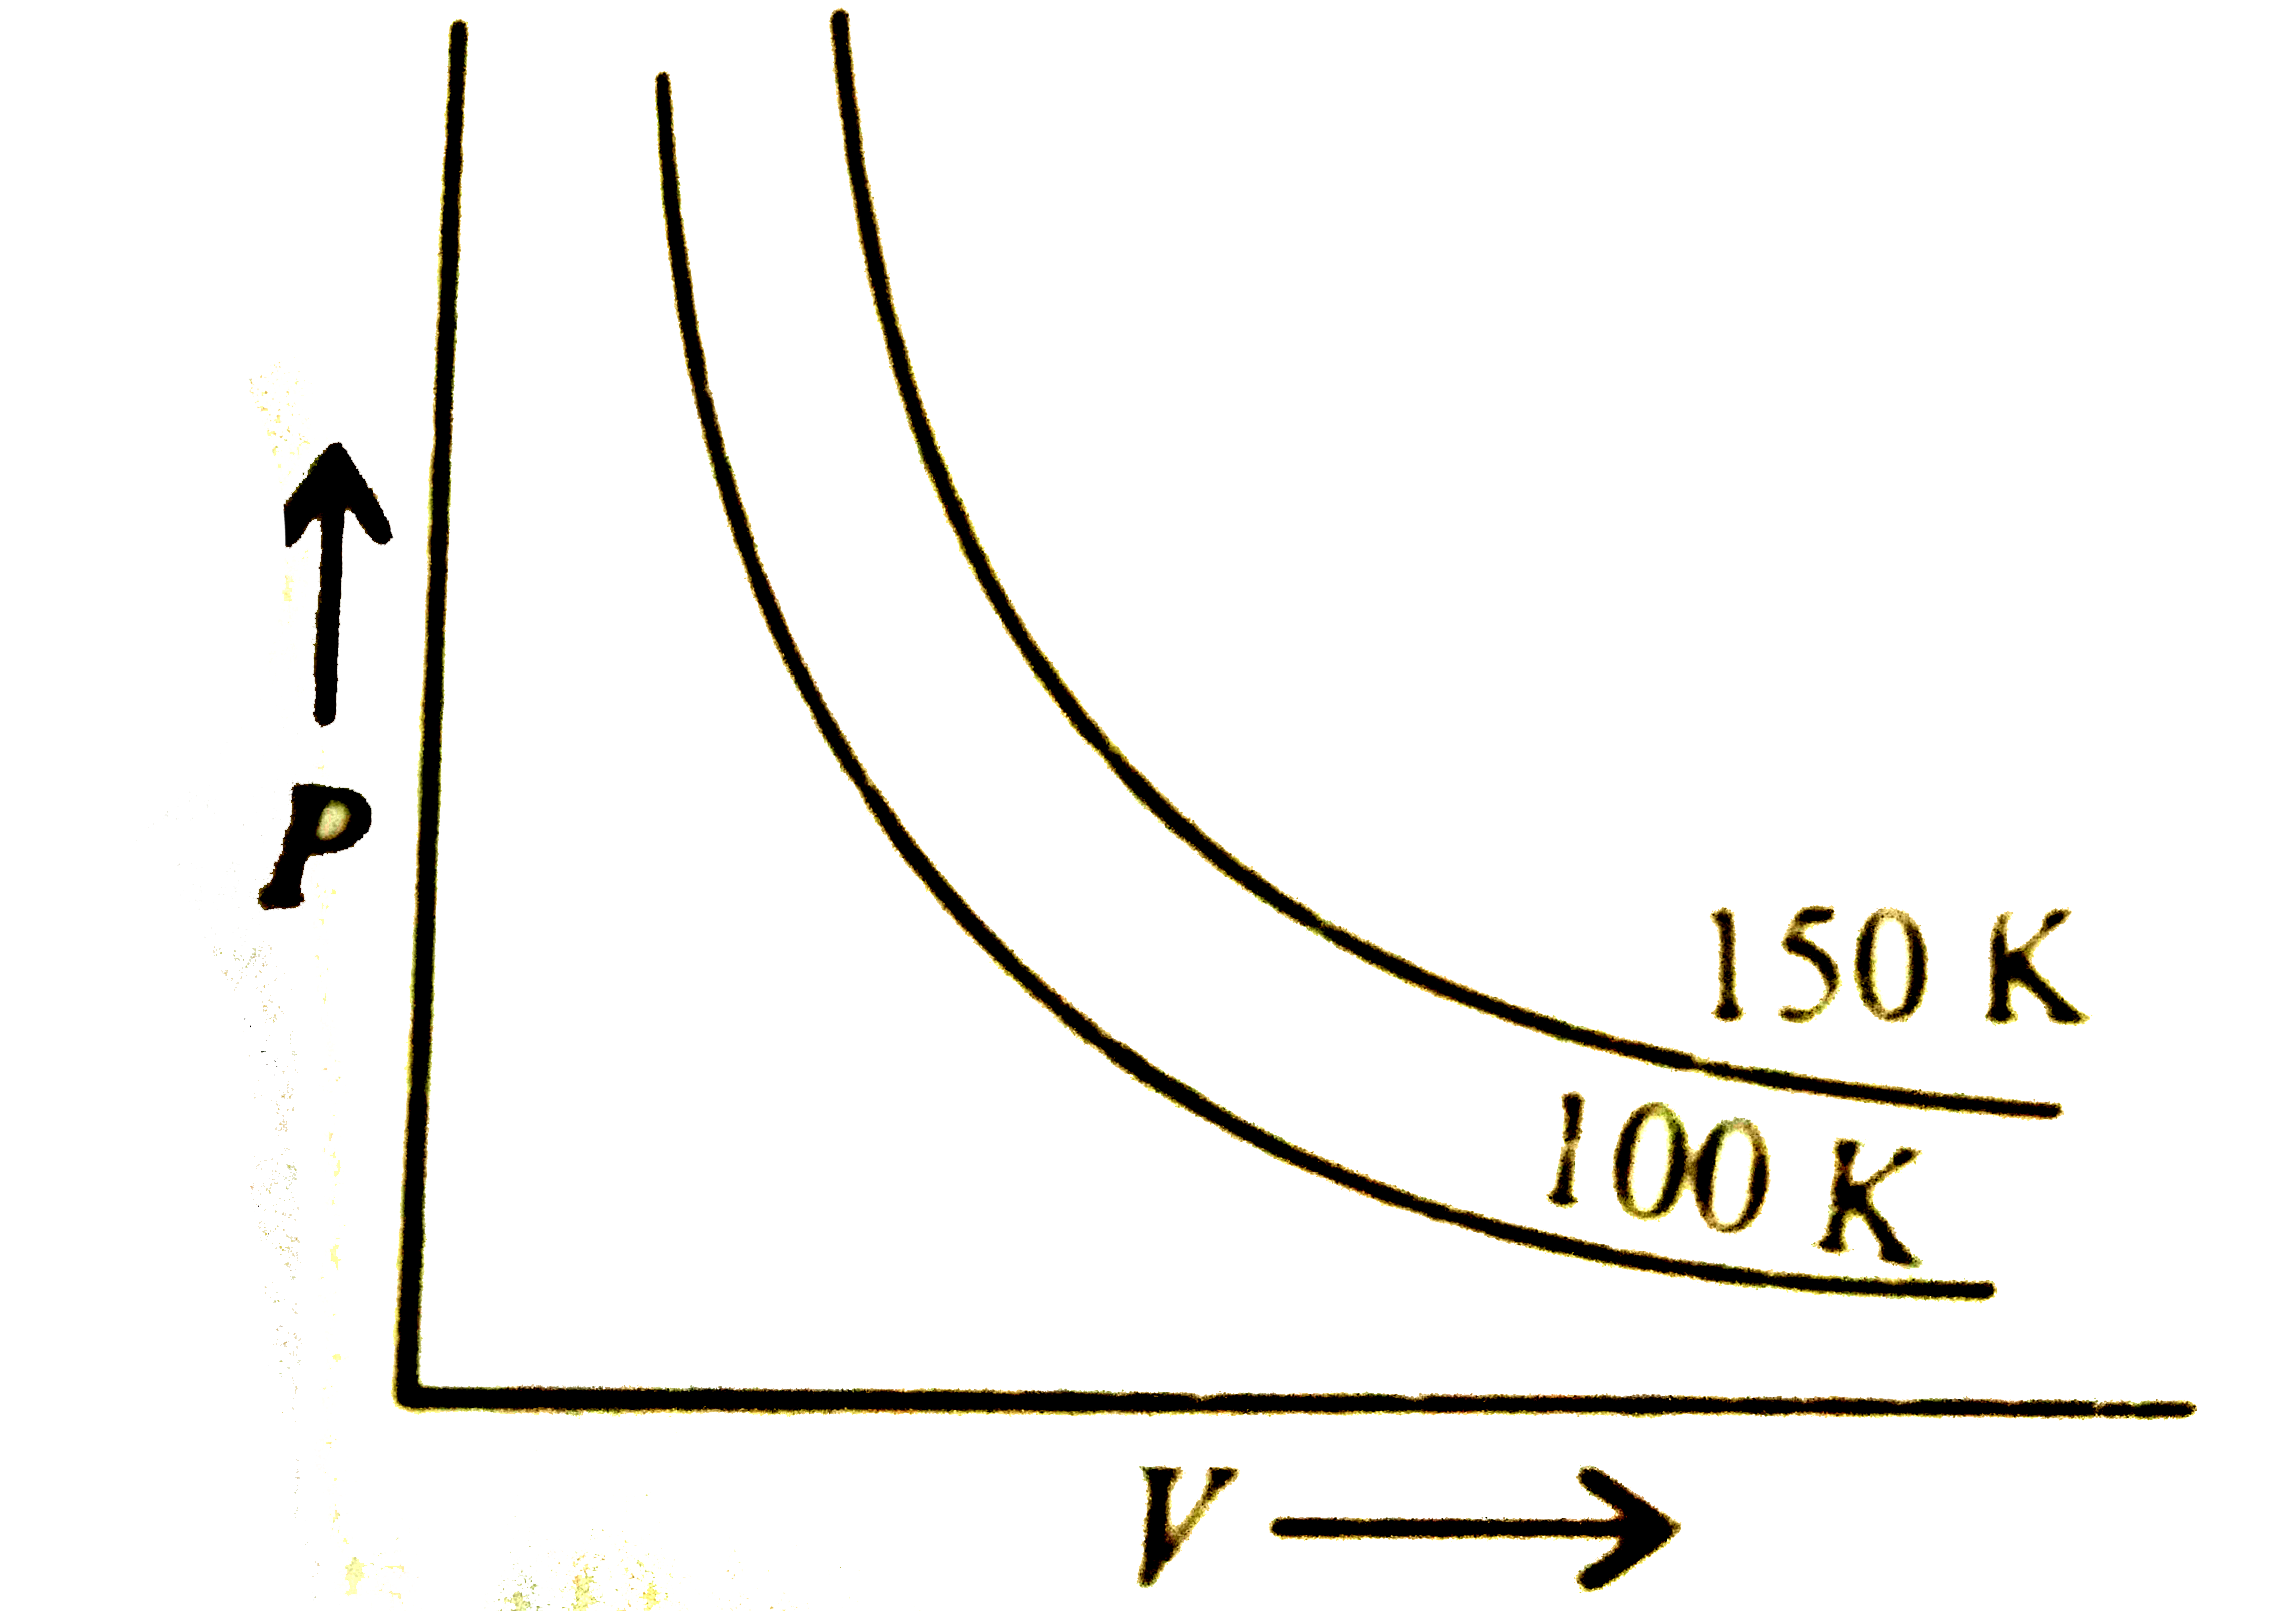
A graph is plotted between pressure and volume at different temperatures . On the basis of the graph what changes will you observe in the volume if
(i) the pressure is increased at constant temperature .
(ii) the temperature is decreased at constant pressure .

volume increases in both the cases
volume decrease in both the cases
volume increase in (i) and decreases (ii)
volume decreases in (i) and increases in (ii) .
The correct Answer is:B
Volume decreases when pressure is increased at constant temperature. When temperature is decreased at constant pressure, the volume decreases.
Topper's Solved these Questions
- STATES OF MATTER Book:NCERT FINGERTPS ENGLISHChapter:STATES OF MATTER Exercise:HOTS (HIGHER ORDER THINKING SKILLS)
Explore 10 Videos
- STATES OF MATTER Book:NCERT FINGERTPS ENGLISHChapter:STATES OF MATTER Exercise:NCERT (EXEMPLAR PROBLEMS)
Explore 11 Videos
- SOME BASIC CONCEPTS OF CHEMISTRY Book:NCERT FINGERTPS ENGLISHChapter:SOME BASIC CONCEPTS OF CHEMISTRY Exercise:NCERT Exemplar
Explore 11 Videos
- STRUCTURE OF ATOM Book:NCERT FINGERTPS ENGLISHChapter:STRUCTURE OF ATOM Exercise:Assertion And Reason
Explore 15 Videos
Similar Questions
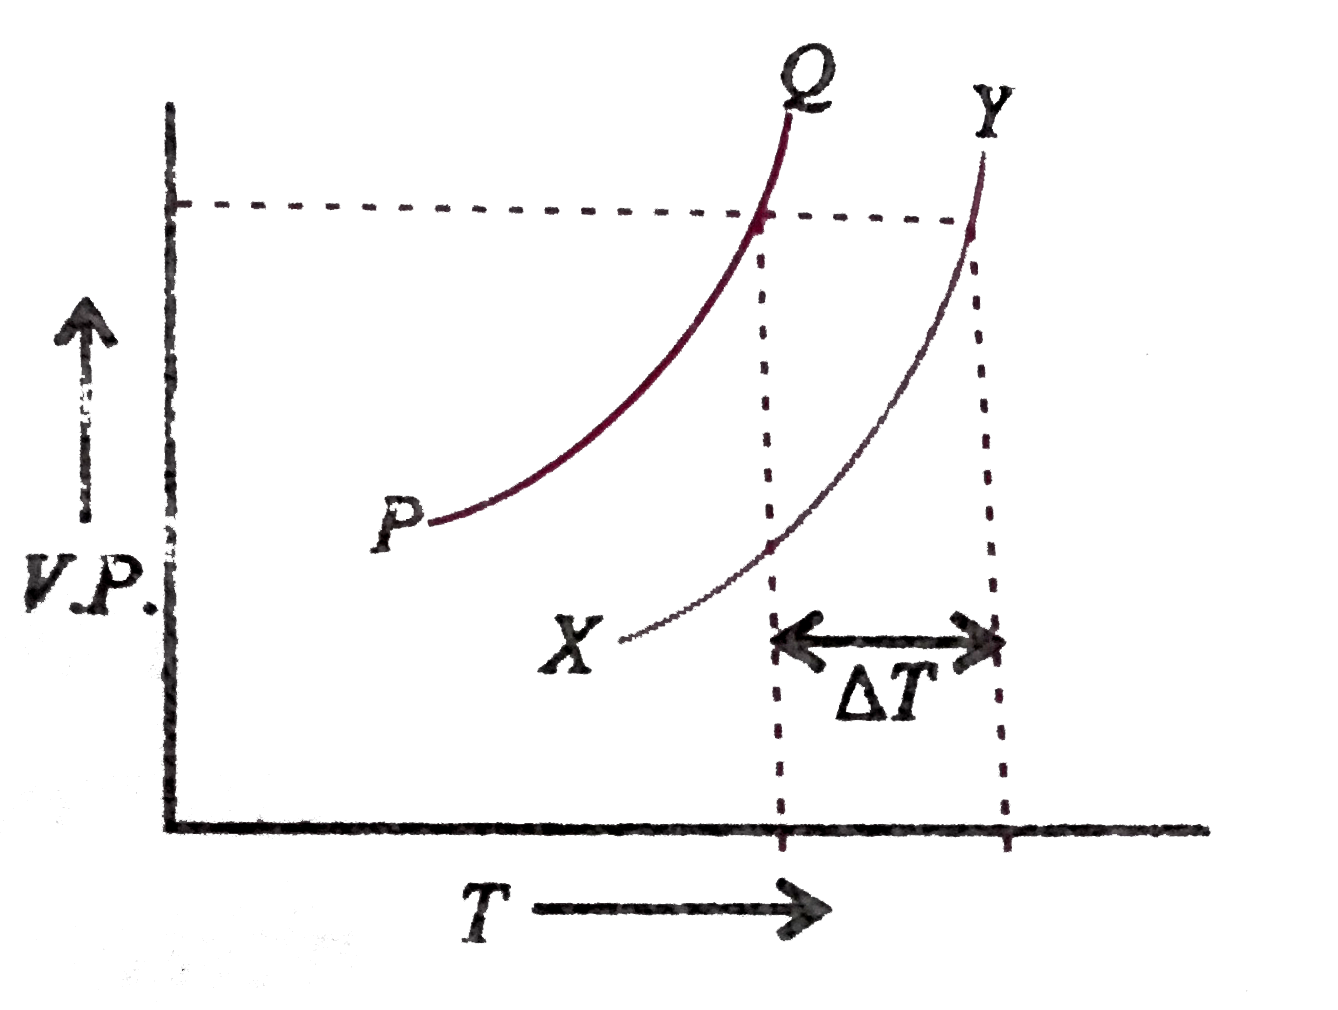
In the graph plotted between vapour pressure (V.P.) and temperature (T),

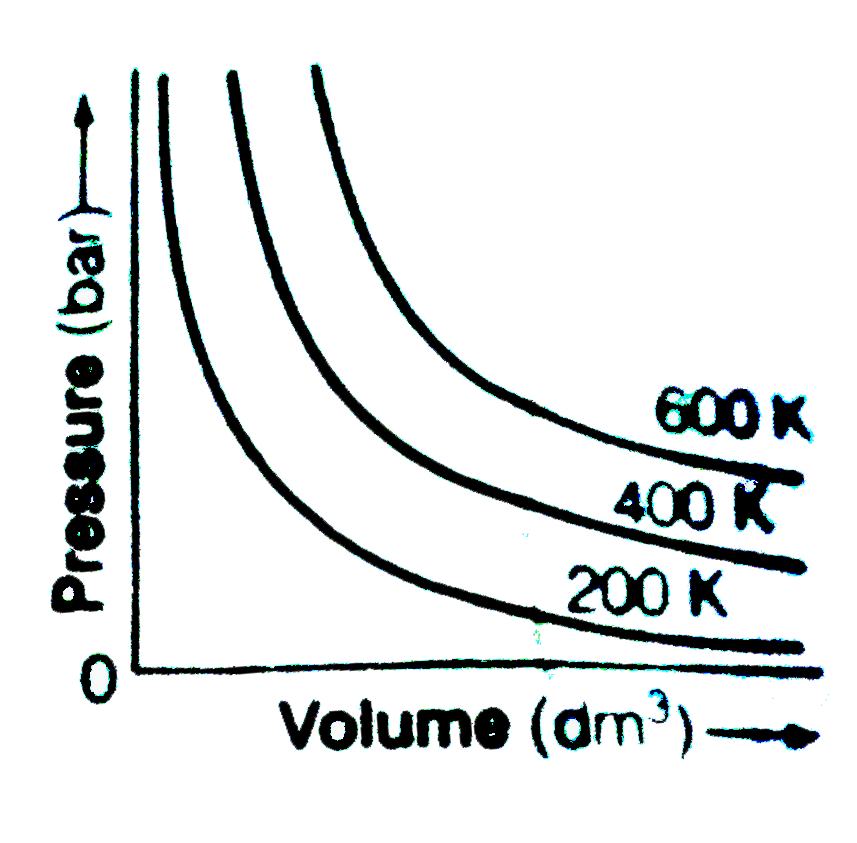
View SolutionThe variation of pressure with volume of the gas at different temperatures can be graphically represented as shown in figure. On the basis of this graph answer the following question.
(i) How will the volume of a gas change if its pressure is increased at constant temperature ?
(ii) At a constant pressure, how will the volume of a gas change if the temperature is increased from 200 K to 400 K ?

View Solution
Knowledge Check
What is the effect on the pressure of a gas if its temperature is increased at constant volume ?
AThe pressure of the gas increases.BThe pressure of the gas decreases .CThe pressure of the gas remains same .DThe pressure of the gas becomes half.
If the volume of a given mass of a gas at constant temperature becomes three times, the pressure will be
View SolutionGraph between speed v of sound in air and pressure P at a constant temperature is given by
View SolutionThe volume of a given mass of a gas in a vessel is reduced to half at constant temperature what is the change in pressure?
View SolutionWhen volume of system is increased two times and temperature is decreased half of its initial temperature, then pressure becomes ………….
View SolutionOn the basis of the kinetic theory explain why the pressure of a gas at constant volume increases with rise in temperature?
View SolutionA gas occupies 20 litre of volume under STP. What will be its volume if the pressure is increased four times keeping the temperature constant?
View SolutionBy increasing temperature of a gas by 6∘C its pressure increases by 0.4%, at constant volume. Then initial temperature of gas is
View Solution

