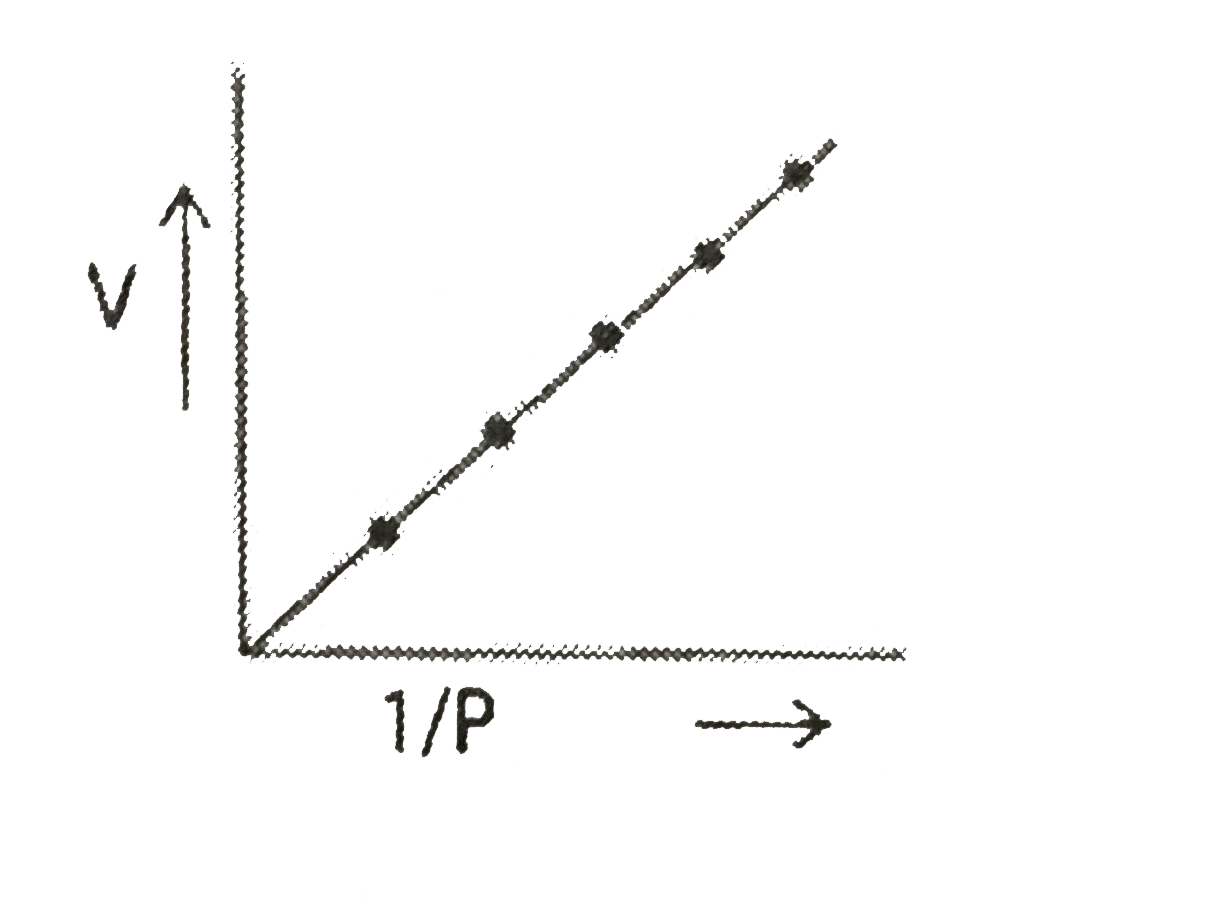
Pressure vs volume graph at constant temperature is known as…………….
Step-by-Step Solution:
1. Understanding the Terms: The question asks about a graph that plots pressure against volume while keeping the temperature constant.
2. Identifying the Process: In thermodynamics, when we refer to a process where temperature remains unchanged, it is specifically termed as an "isothermal process."
3. Breaking Down the Term: The word "isothermal" can be broken down into two parts:
- "Iso" means constant or unchanged.
- "Thermal" relates to temperature.
4. Conclusion: Therefore, the pressure vs volume graph at constant temperature is known as an isothermal process.
Final Answer: The pressure vs volume graph at constant temperature is known as an isothermal process.
---
- "Iso" means constant or unchanged.
- "Thermal" relates to temperature.
Topper's Solved these Questions
- STATES OF MATTER : GASES, LIQUIDS AND SOLIDSBook:CBSE COMPLEMENTARY MATERIALChapter:STATES OF MATTER : GASES, LIQUIDS AND SOLIDSExercise:TRUE AND FALSE TYPE QUESTIONS
Explore 9 Videos
- STATES OF MATTER : GASES, LIQUIDS AND SOLIDSBook:CBSE COMPLEMENTARY MATERIALChapter:STATES OF MATTER : GASES, LIQUIDS AND SOLIDSExercise:MATCH THE COLUMNS
Explore 2 Videos
- STATES OF MATTER : GASES, LIQUIDS AND SOLIDSBook:CBSE COMPLEMENTARY MATERIALChapter:STATES OF MATTER : GASES, LIQUIDS AND SOLIDSExercise:HOTS QUESTIONS
Explore 4 Videos
- SOME BASIC CONCEPTS OF CHEMISTRY Book:CBSE COMPLEMENTARY MATERIALChapter:SOME BASIC CONCEPTS OF CHEMISTRY Exercise:UNIT TEST
Explore 12 Videos
- STRUCTURE OF ATOMBook:CBSE COMPLEMENTARY MATERIALChapter:STRUCTURE OF ATOMExercise:UNIT TEST
Explore 8 Videos
Similar Questions
Assertion: The plot of volume (V) versus pressure (P) at constant temperature is a hyperbola in the first quadrant.
Reason: V∝1/P at constant temperature.
View SolutionThe slope of a given straight lime graph with constant temperature is found to be 0.2 L atm at 5 atm pressure. Calculate the volume of gas at that pressure.

View Solution
Knowledge Check
Which one of the following relationships when graphed does not give a straight line for helium gas?
I. K.E. and T at constant pressure and volume
II. P v/s V at constant temperature for a constant mass
III. V v/s 1/T at constant pressure for a constant massAIIBII and IIICIIIDIHow is pressure related to volume at constant temperature?
AP∝VBP∝1VCP=VDNo relationAssertion : The pressure of a gas is inversely proportional to its volume at constant temperature and n.
Reason : The gas volume is directly proportional to n at constant temperature and pressure .AIf both the assertion and reason are true statement and reason is correct explanation of the assertion .BIf both the assertion and reason are true statement but reason is not a correct explanation of the assertion .CIf the assertion is true but the reason is a false statement.DIf both assertion and reason are false statements.
The heat energy exchanged between the system and surroundings at constant temperature and pressure is known as…..
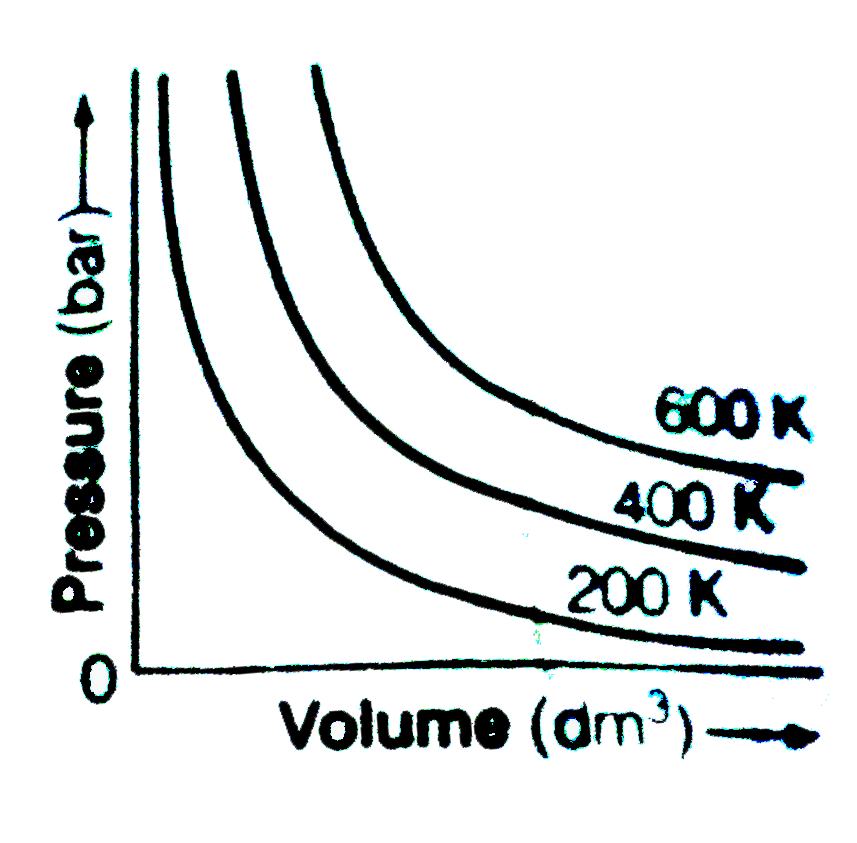
View SolutionThe variation of pressure with volume of the gas at different temperatures can be graphically represented as shown in figure. On the basis of this graph answer the following question.
(i) How will the volume of a gas change if its pressure is increased at constant temperature ?
(ii) At a constant pressure, how will the volume of a gas change if the temperature is increased from 200 K to 400 K ?

View SolutionName the gas law which relates volume and pressure of gas at constant temperature.
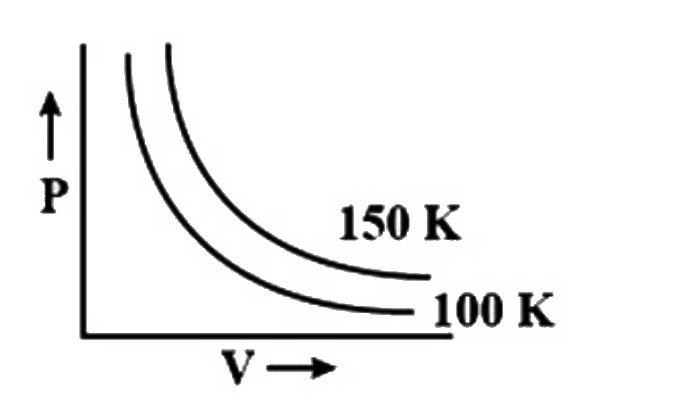
View SolutionA graph is plotted between pressure and volume at different temperature. On the basis of the graph what changes will you observe in the volume if
(i) the pressure is increased at constant temperature
(ii) the temperature is decreased at constant pressure

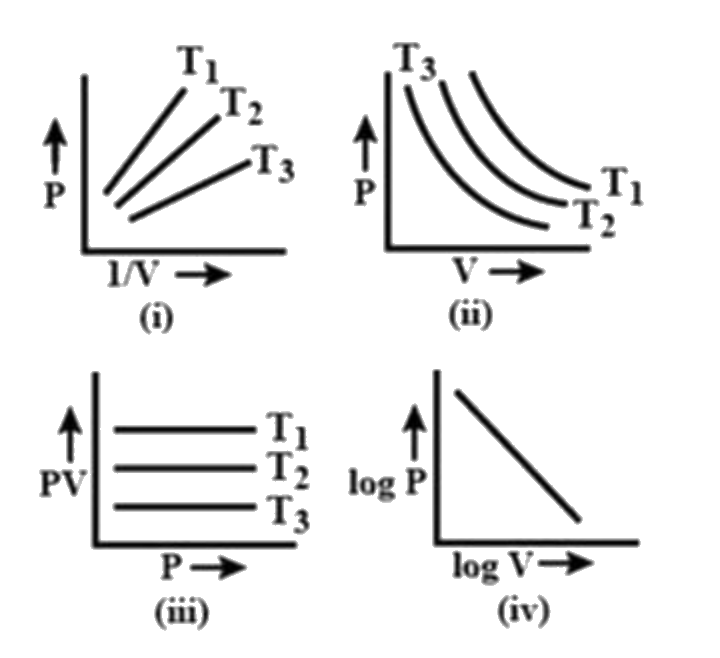
View SolutionGraph between pressure and volume are plotted at different temperature. Which of the following isotherms represent Boyle's law as PV = constant?

View Solution

