Two plots are shown below between concentration and time t. Which of the given orders are shown by the graphs respectively?

Zero order and first order
first order and second order
zero order and second order
frist order and first order
The correct Answer is:C
Linear plots are obtained in the graph of (A - x) vs t for zero order reaction and 1a−x vs t for second reaction
Topper's Solved these Questions
- CHEMICAL KINETICSBOOK - NCERT FINGERTPS ENGLISHCHAPTER - CHEMICAL KINETICSEXERCISE - Higher Order Thinking Skills
9 Videos
- CHEMICAL KINETICSBOOK - NCERT FINGERTPS ENGLISHCHAPTER - CHEMICAL KINETICSEXERCISE - NCERT EXEMPLAR PROBLEMS
17 Videos
- BIOMOLECULESBOOK - NCERT FINGERTPS ENGLISHCHAPTER - BIOMOLECULESEXERCISE - Assertion And Reason
15 Videos
- CHEMISTRY IN EVERYDAY LIFE BOOK - NCERT FINGERTPS ENGLISHCHAPTER - CHEMISTRY IN EVERYDAY LIFE EXERCISE - NCERT Exemplar
15 Videos
Similar Questions
Two plots are shown below between concentration and time t. Which of the given orders are shown by the graph respectively?
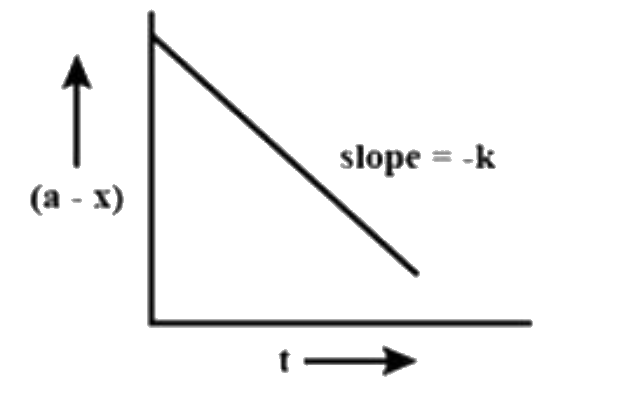
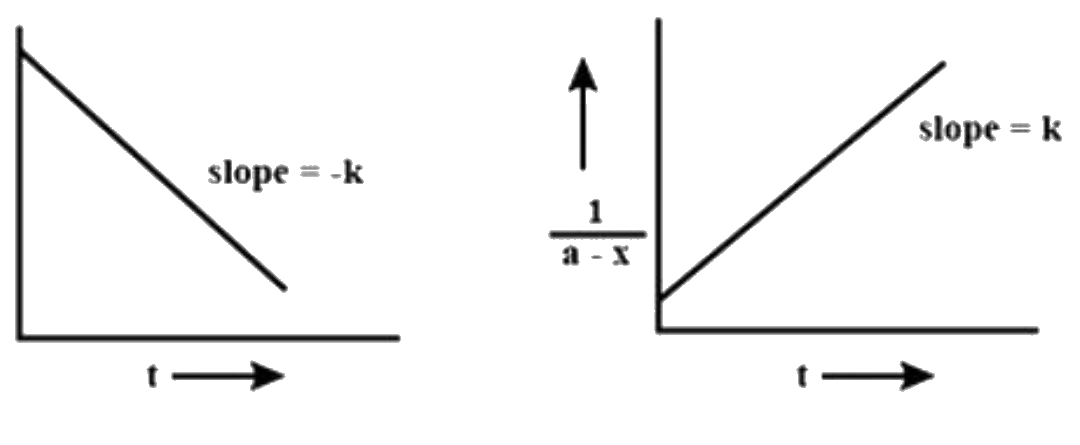
View SolutionObserve the given graphs carefully.
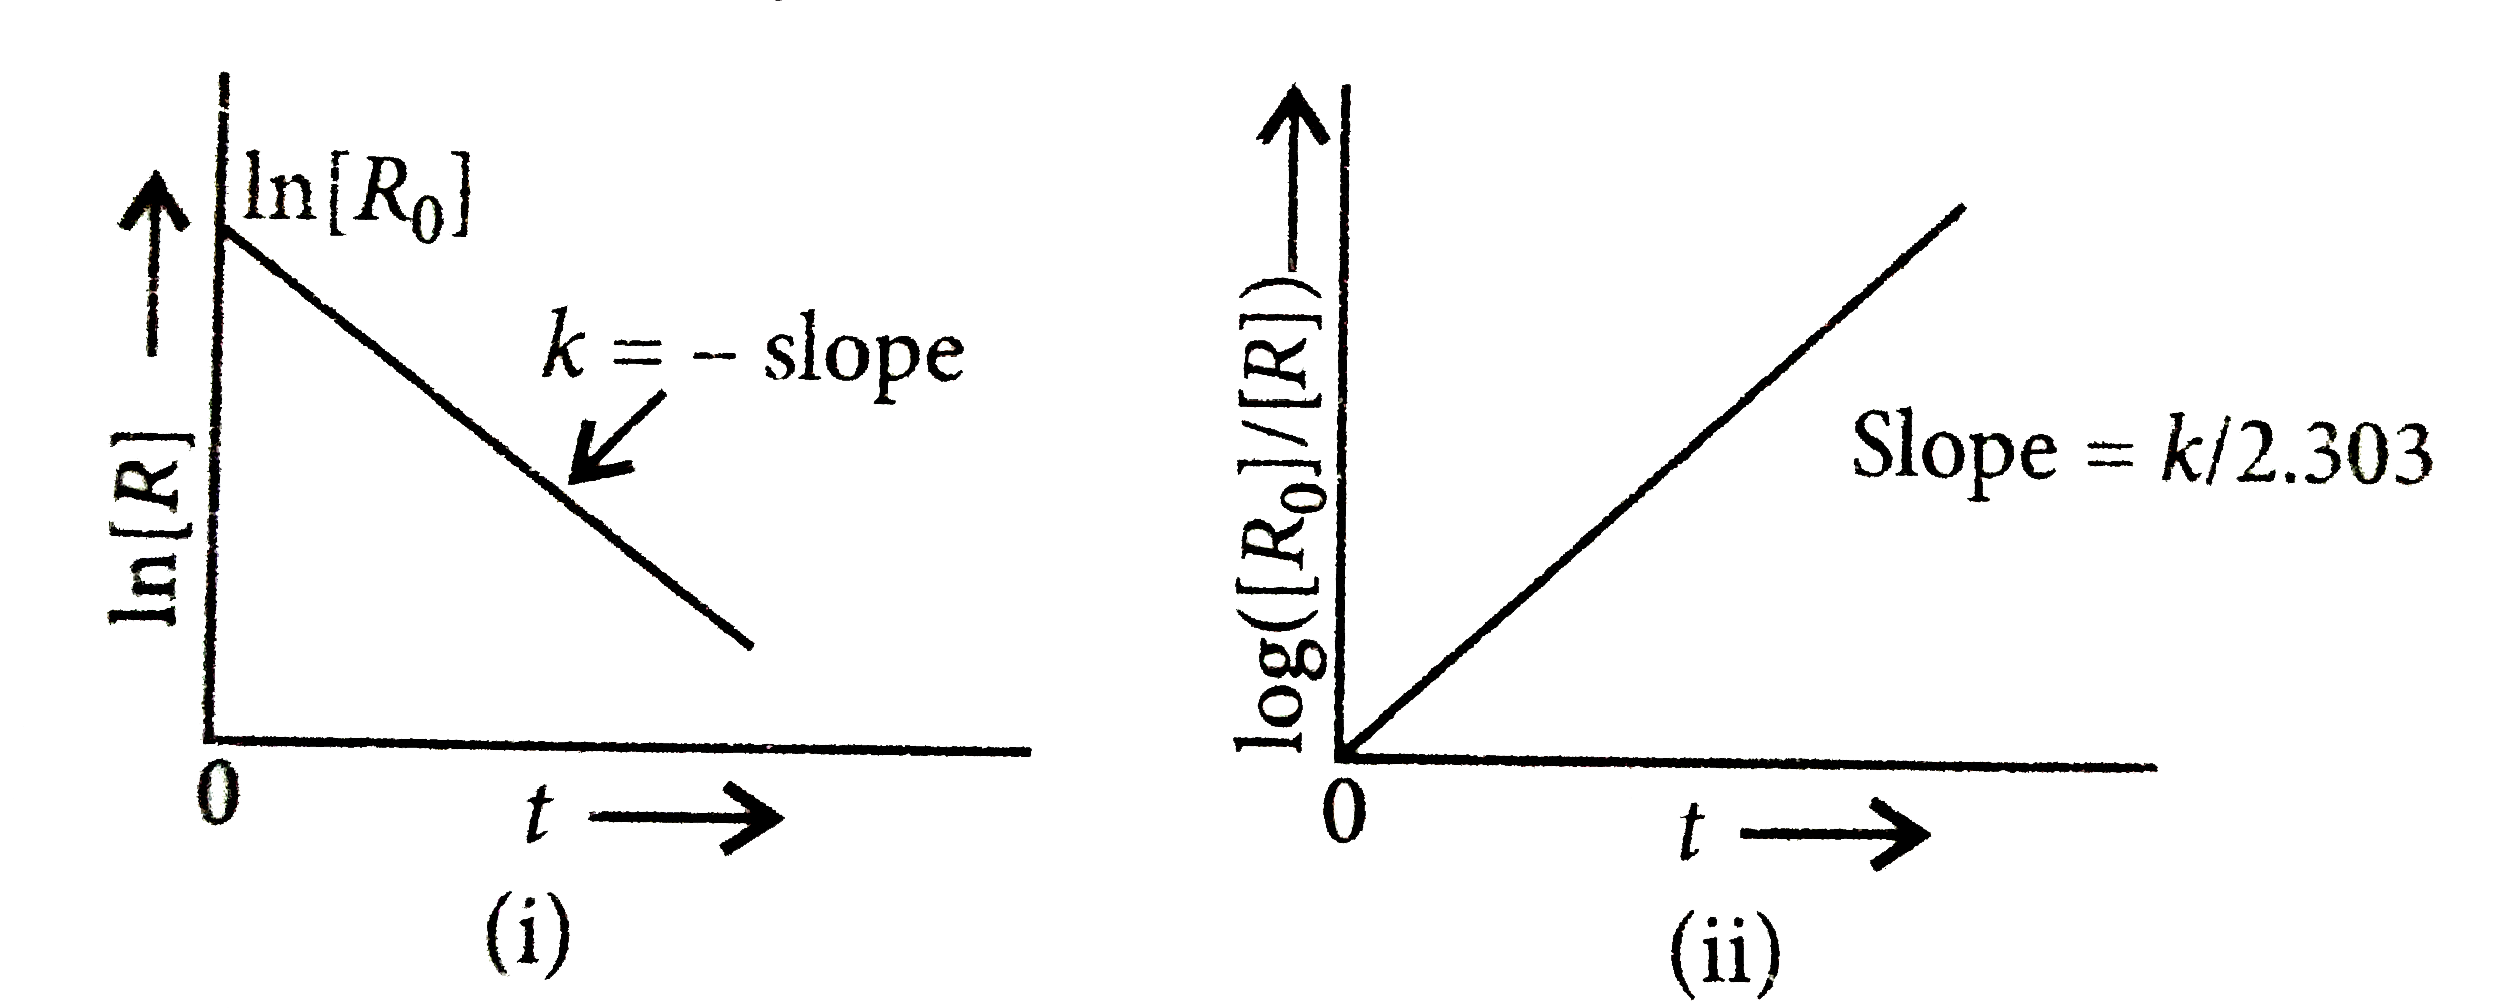
Which of the given orders are shown by the graphs respectively?
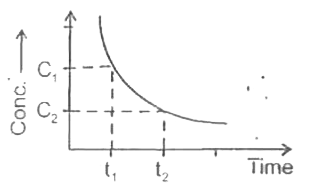
View SolutionThe graph plotted between concentration versus time
View SolutionWhich of the two curves shown below has lesser time constant.
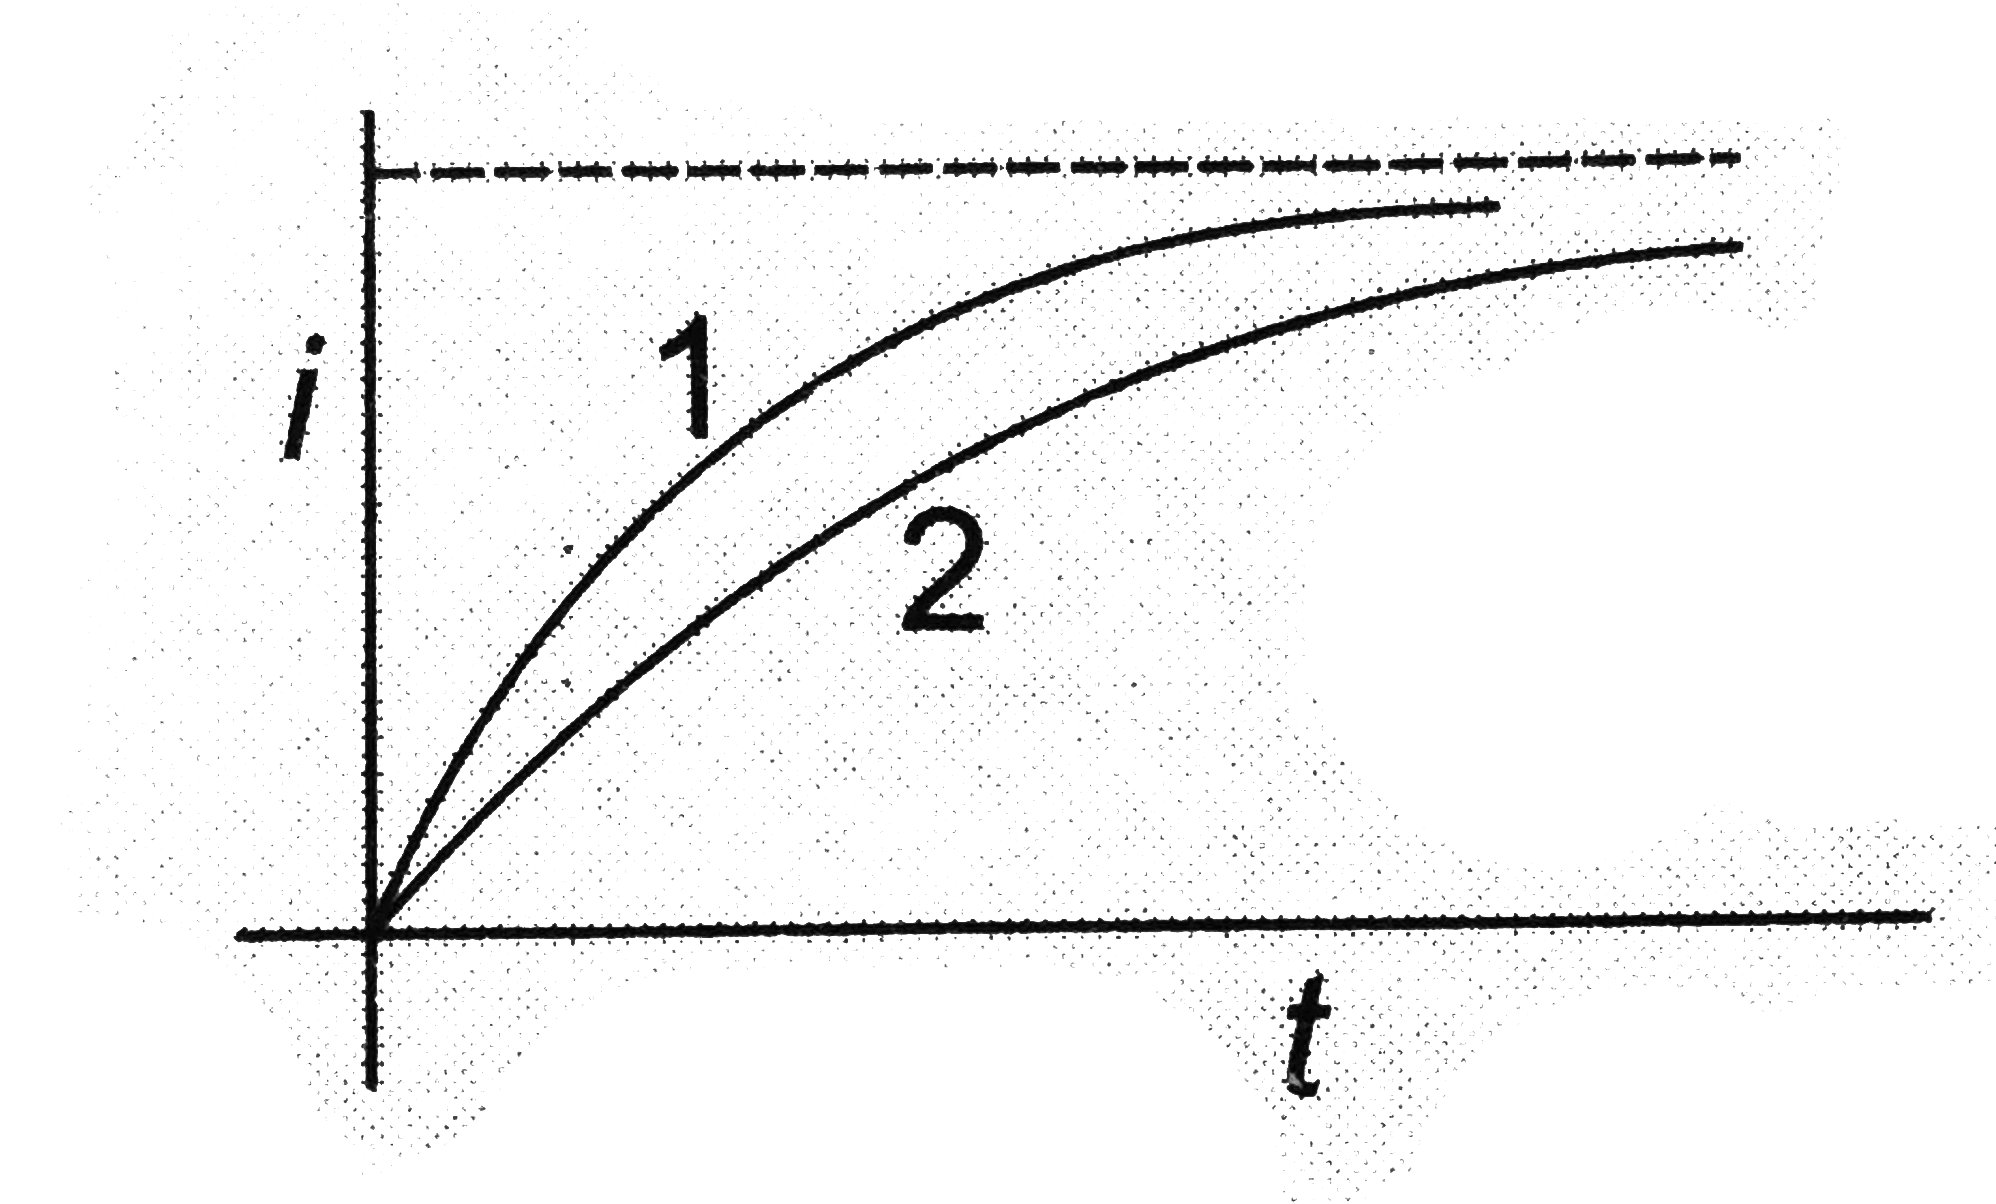
View SolutionFor a reaction , a graph was plotted between reactant concentration c and time as shown in the figure below.
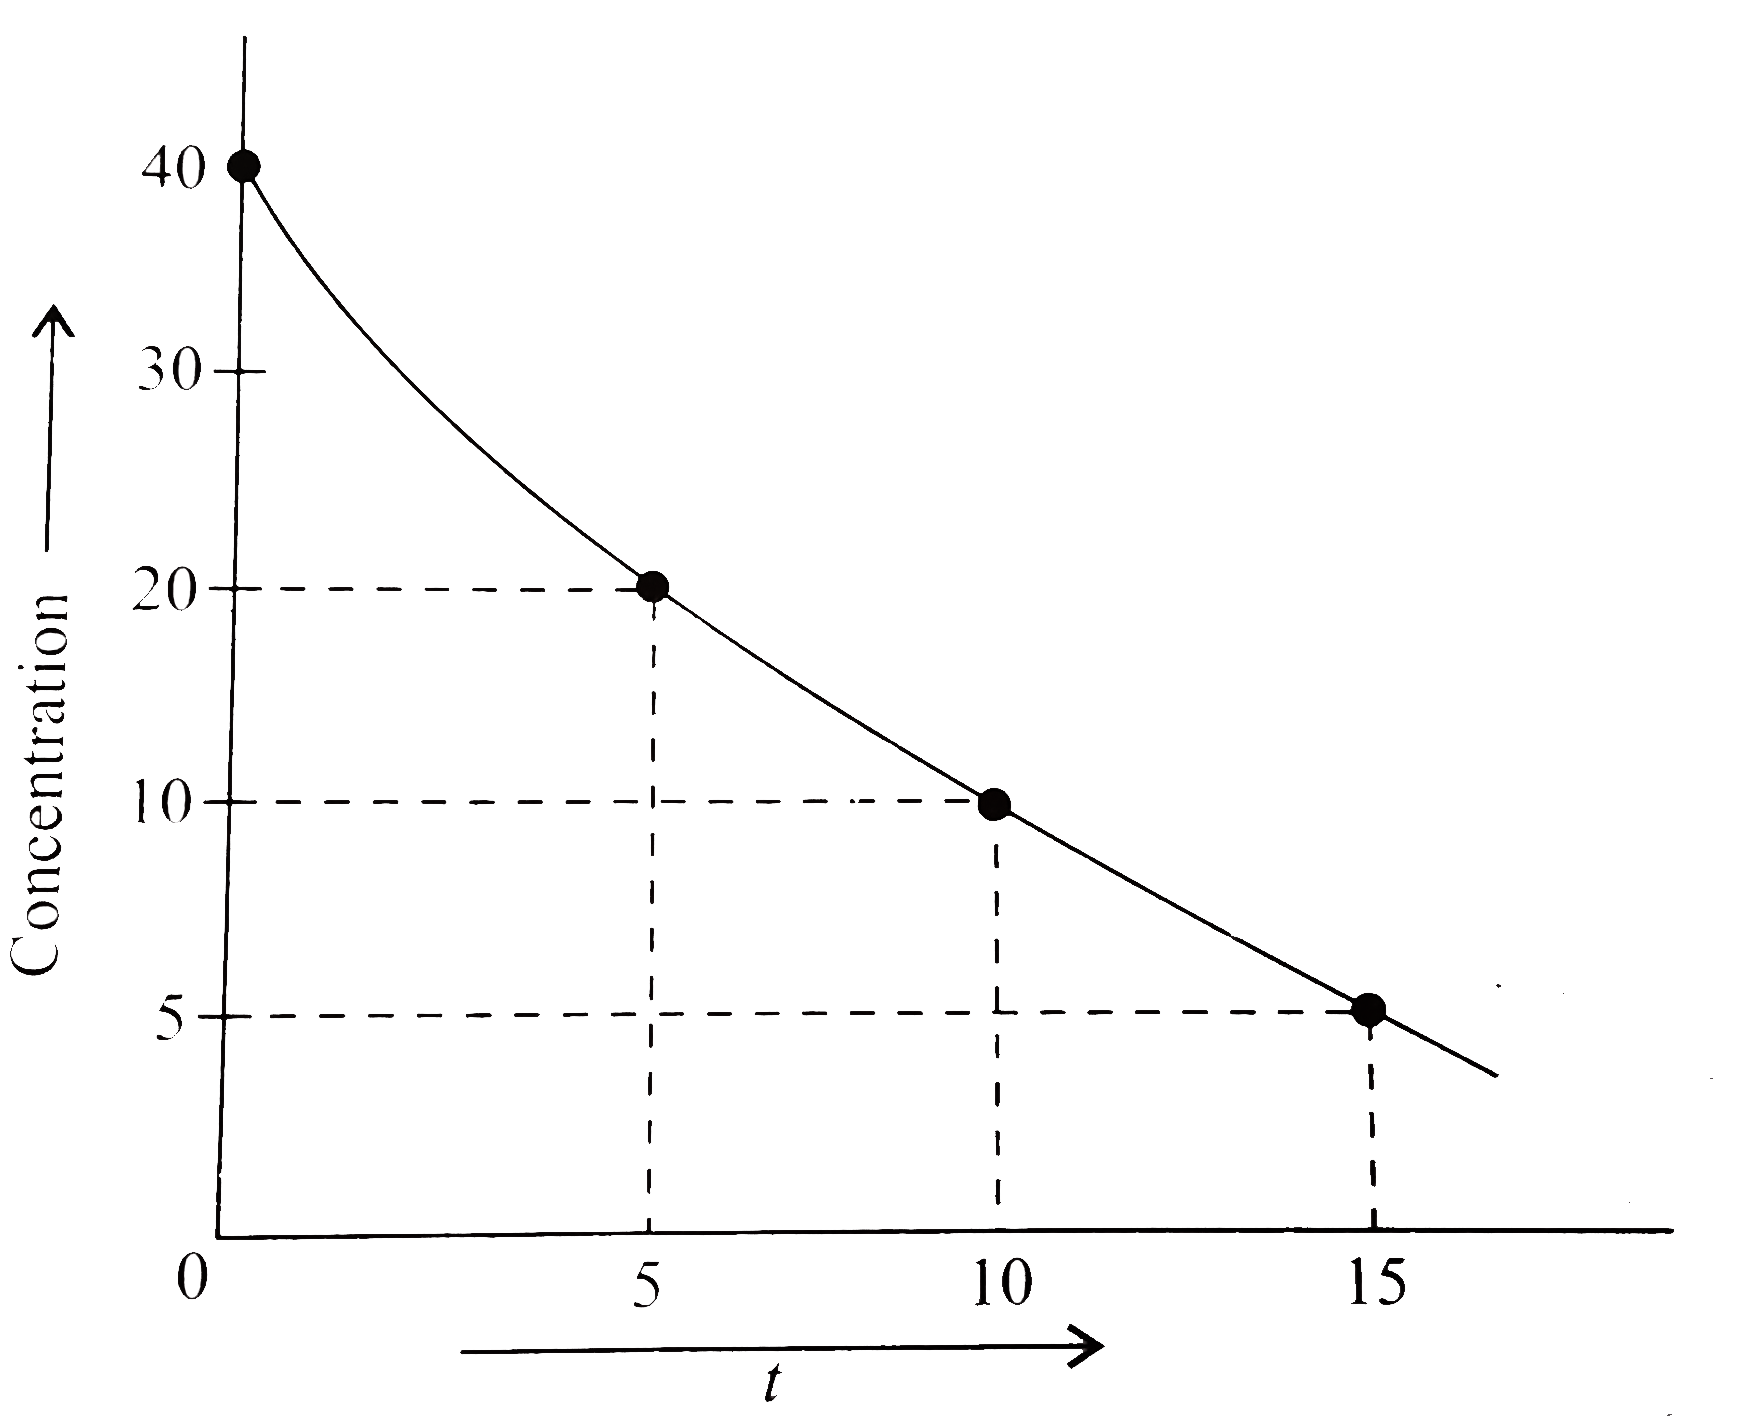
Identify the order of the reaction with respect to the reactant. Can the concentration of the reactant be theoretically zero after infinite time?
View SolutionThe given plots represent the variation of the concentration of a reactant R with time for different reactions (i) and (ii). The respective orders of the reactions are:
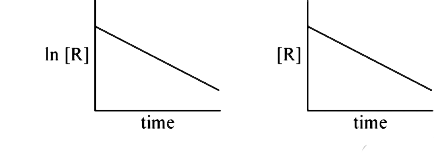
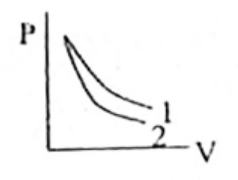
View Solutionp-V plots for two gases during adiabatic processes are shown in the figure. Plots 1 and 2 should correspond respectively to
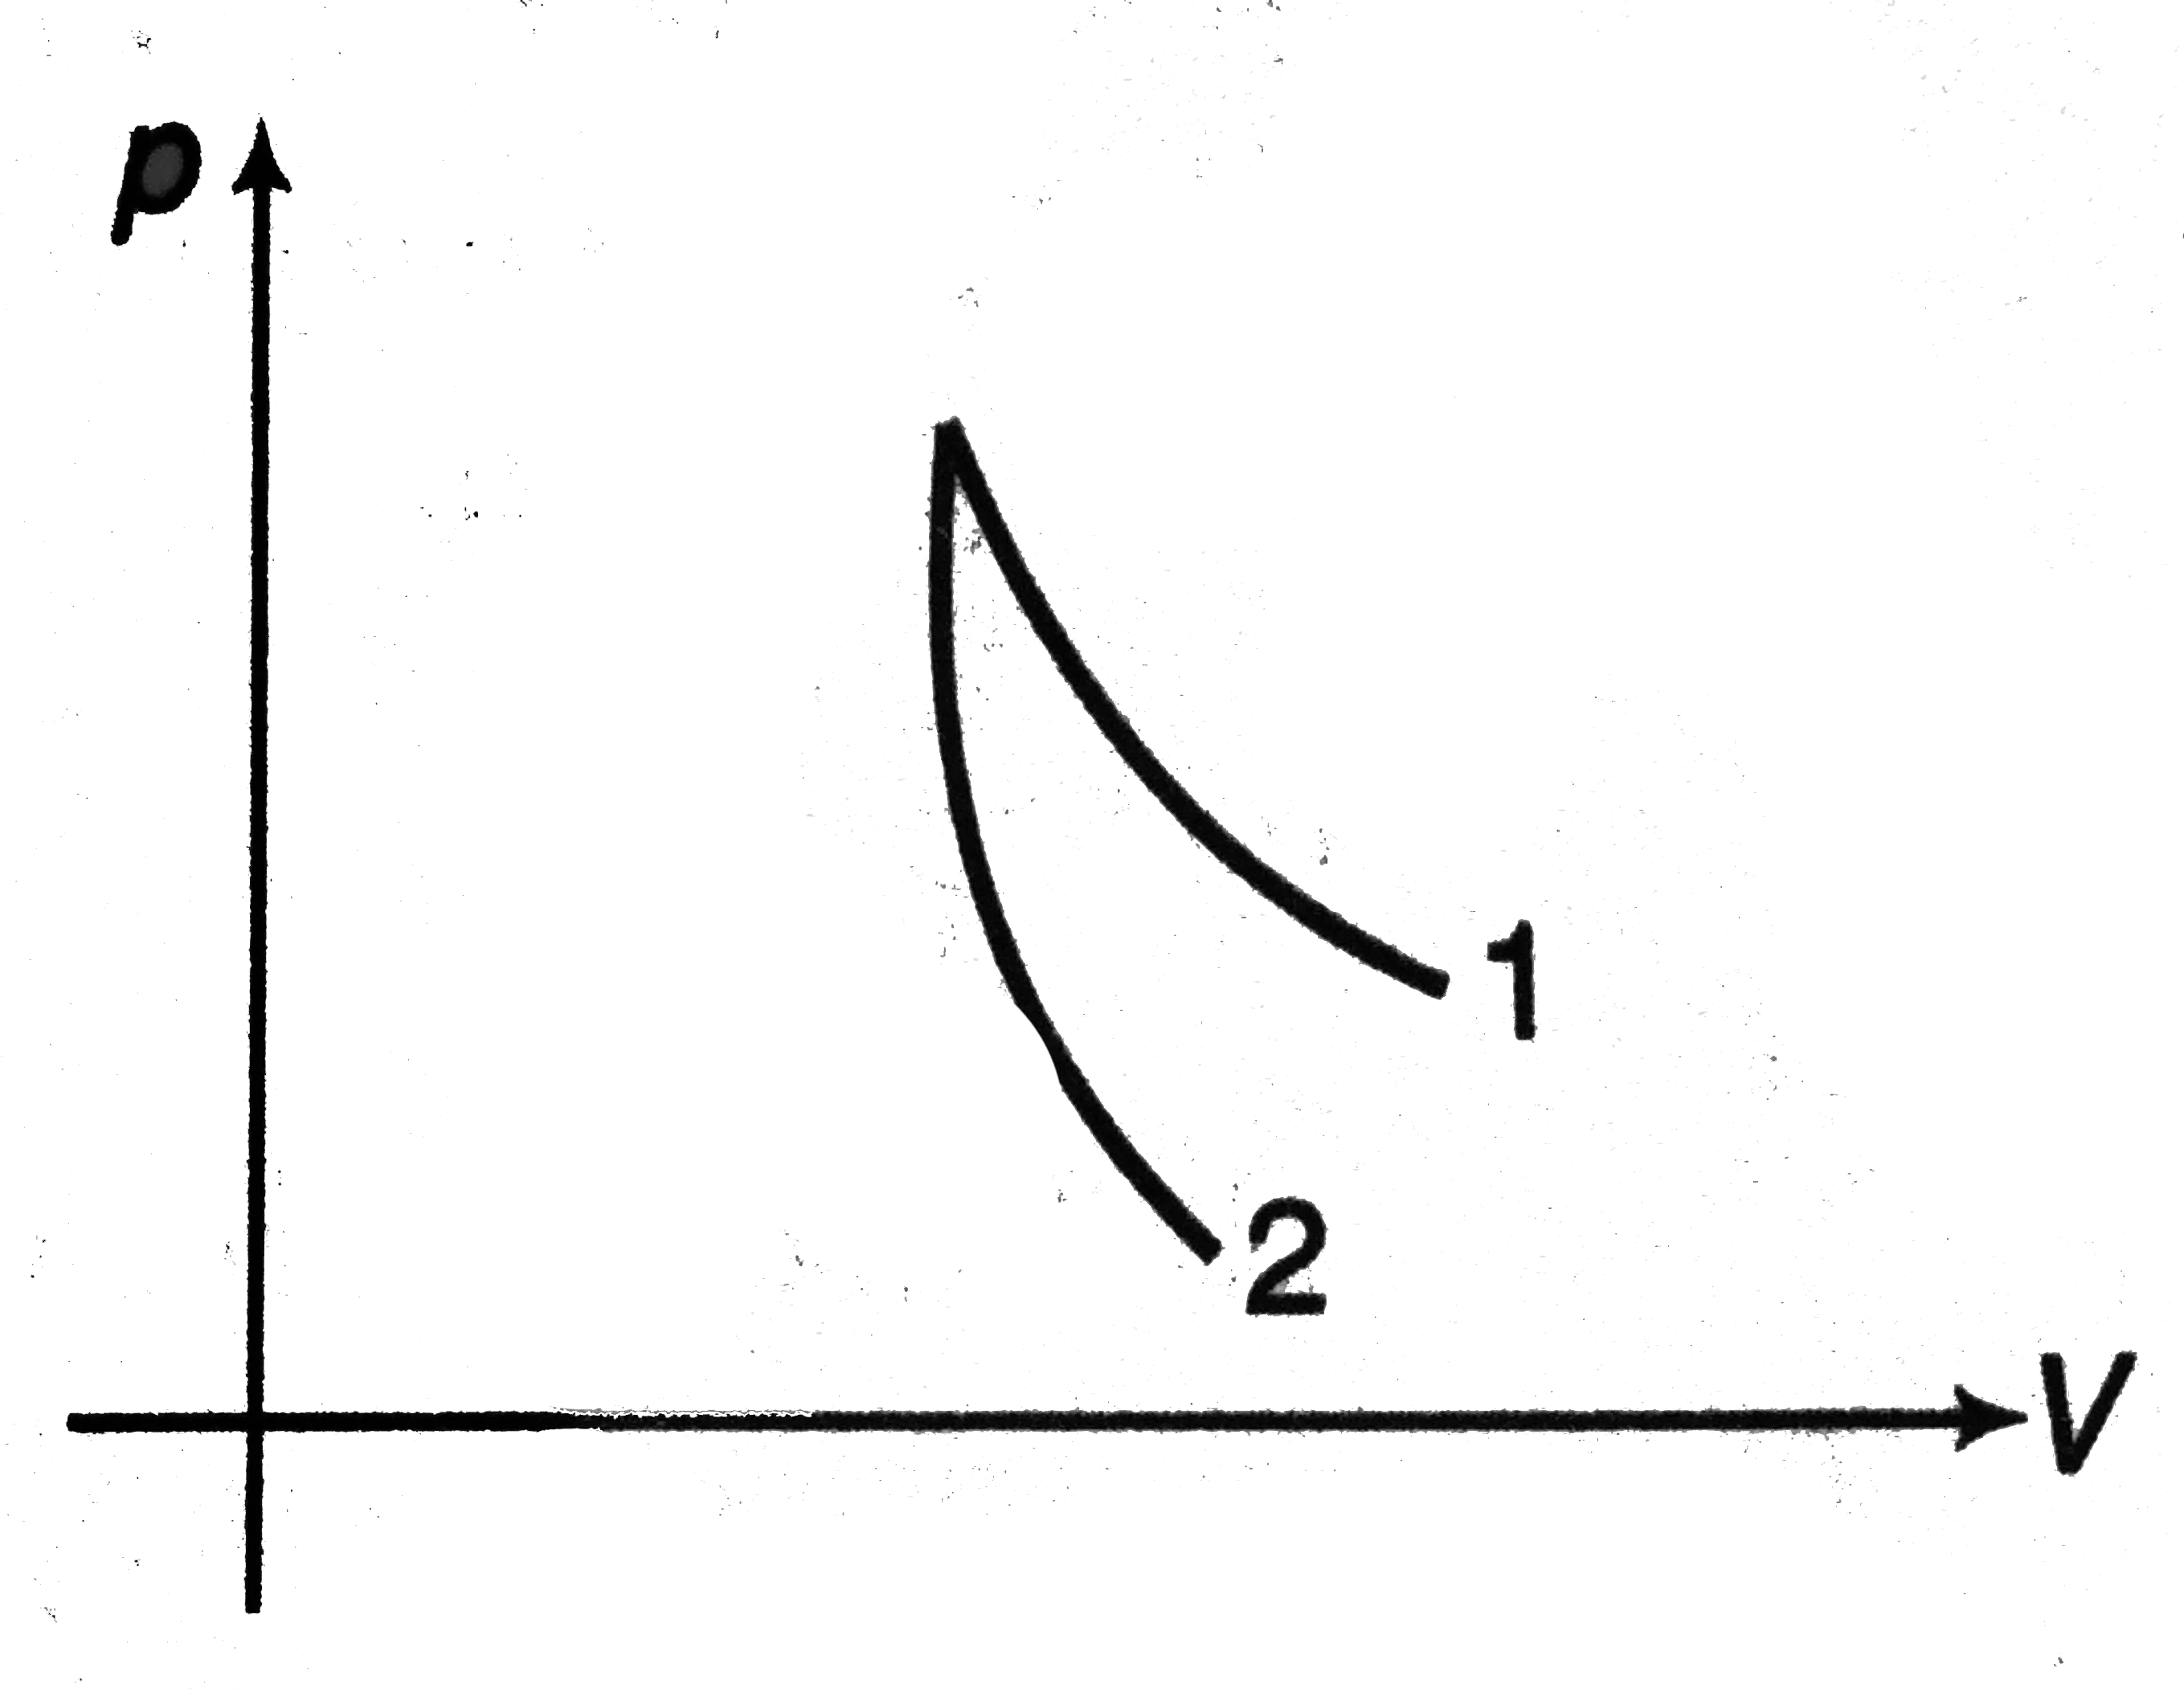
View SolutionP-V plots for two gases during adiabatic processes are shown in the figure. Plots 1 and 2 should corresponds respectively to
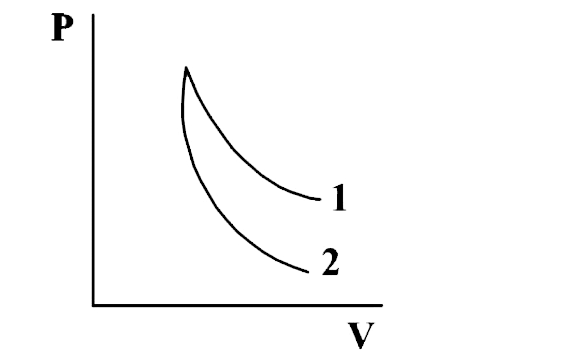
View SolutionP.V plots for two gases during adiabatic processes are shown in the figure Plots 1 and 2 should correspond respectively to
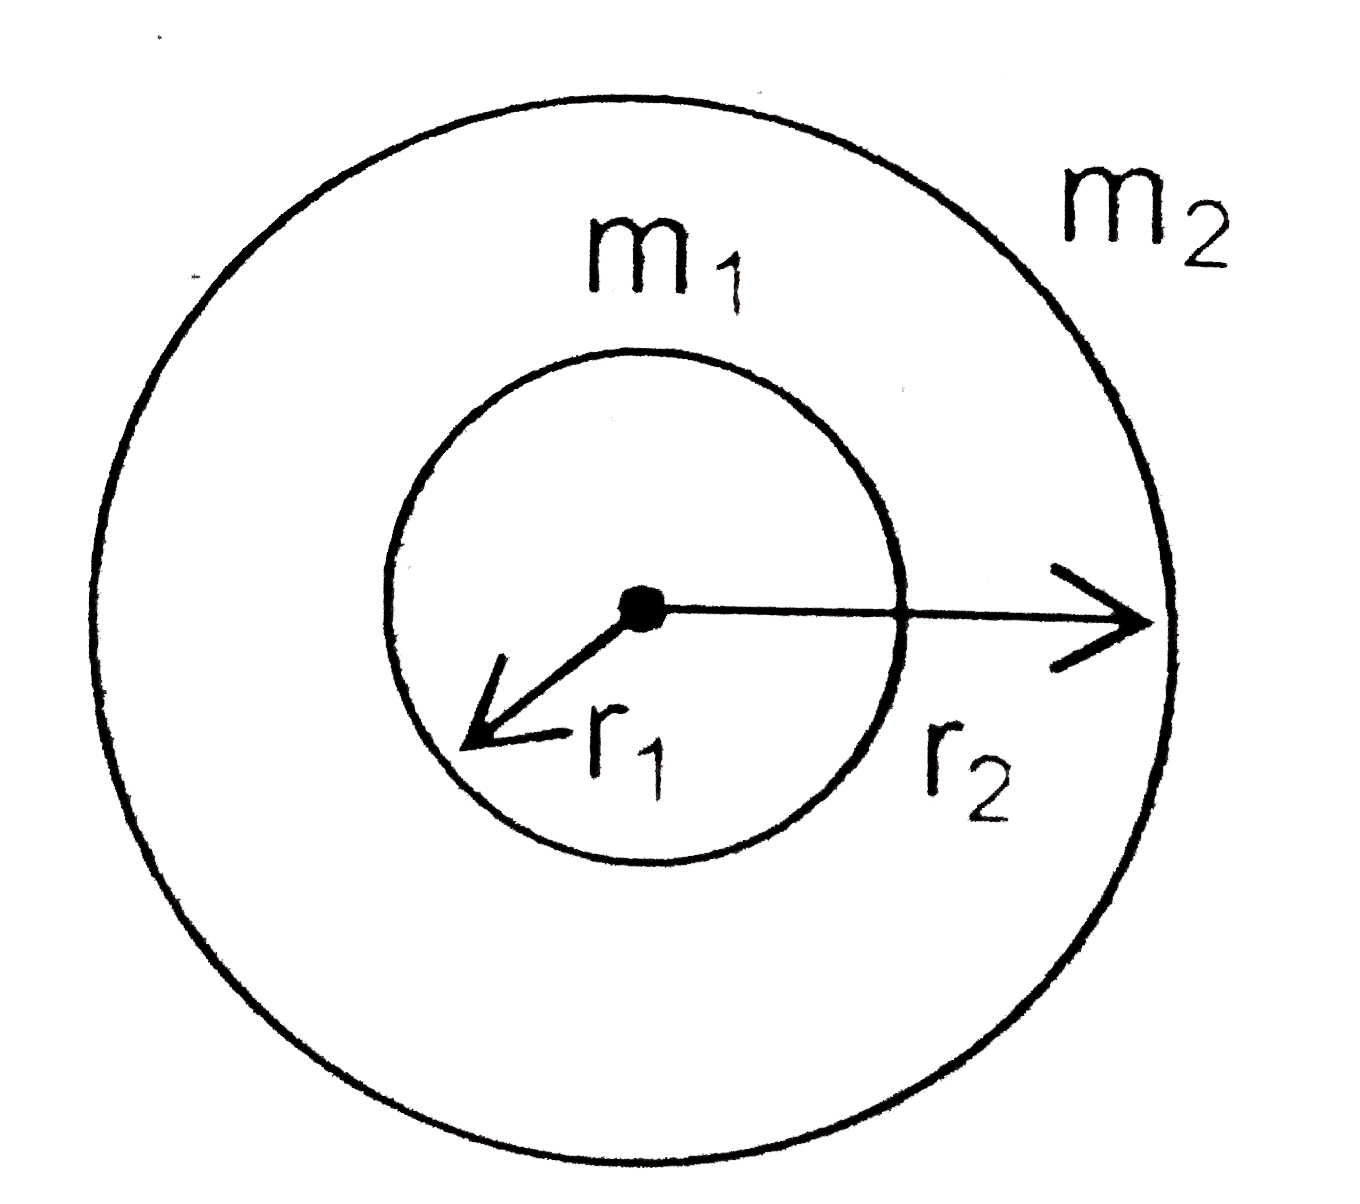
View SolutionTwo concentric spherical sheels are as shown in figure. The V−r graph will be as
View Solution
