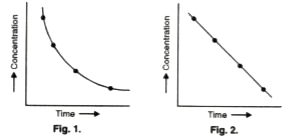
The given plots represent the variation of the concentration of a reactant R with time for different reactions (i) and (ii). The respective orders of the reactions are:
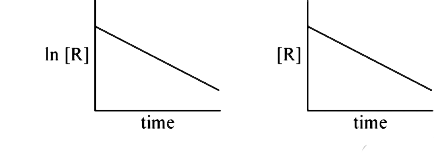
1,0
0,2
1,1
0,1
The correct Answer is:A
R→P
a o
a−x x
For 1st order reaction
+dxdt=k(a−x)1
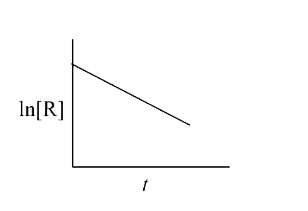
∫dxa−x=∫kdt
− In (a−x)=kt+c
If t=0
C=- In a ∴− In (a−x)=kt−In a
or In (a-x) =-kt+ In a
Y m x c
Similarly
R(Ao)(A)→P
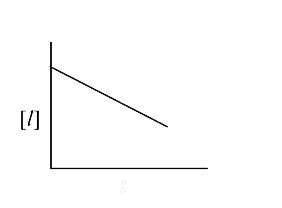
−d[R]dt=k[R]o or −d(R)=kdt or ∫d[R]=−∫kdt
[R]=−kt+c or [A]=−kt+c
y=m x + c
Topper's Solved these Questions
- CHEMICAL KINETICS Book:VMC MODULES ENGLISHChapter:CHEMICAL KINETICS Exercise:JEE Advanced (Archive)
Explore 52 Videos
- CHEMICAL KINETICS Book:VMC MODULES ENGLISHChapter:CHEMICAL KINETICS Exercise:Level-2 ( Numerical Value Type for JEE Main )
Explore 15 Videos
- CHEMICAL EQUILIBRIUMBook:VMC MODULES ENGLISHChapter:CHEMICAL EQUILIBRIUMExercise:IN-CHAPTER EXERCISE - G
Explore 10 Videos
- CHEMICAL THERMODYNAMICS Book:VMC MODULES ENGLISHChapter:CHEMICAL THERMODYNAMICS Exercise:IN - CHAPTER EXERCISE - L
Explore 10 Videos
Similar Questions
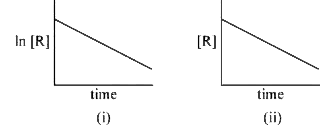
The given plots represent the variation of the concentration of a reactant R with time for different reactions (i) and (ii). The sum of orders of the reactions is ________ .
View SolutionIf the concentration of the reactants is increased, the rate of reaction for first order-
View SolutionWhen initial concentration of a reactant is doubled in a reaction, its half-life period is not affected. The order of the reaction is
View SolutionA : Rate of reaction depends upon the concentration of the reactants.
R : The order of reaction can be negative with respect to substance present in the reaction.
View Solution[r]= concentration of reactant and t be the time
_2019_CBT3_E01_012_Q01.png)
Identify the correct option for order-
View SolutionRaiisng the concentration of a particular reactant by a factor of 5 increases the reaction rate 25 times. What is the kinetic order of this reactant?
View SolutionIn a first order reaction, the concentration of the reactants is reduced to 25% in one hour. The half-life periof of the reactions is
View SolutionIn the reaction A→ B , if the concentration of A is plotted against time, the curves obtained will be as shown in Fig. 1 and 2. Predict the order of the reactions.
View SolutionIn the reaction A→ B , if the concentration of A is plotted against time, the curves obtained will be as shown in Fig. 1 and 2. Predict the order of the reactions.

View SolutionIn the reaction A→ B , if the concentration of A is plotted against time, the curves obtained will be as shown in Fig. 1 and 2. Predict the order of the reactions.

View Solution