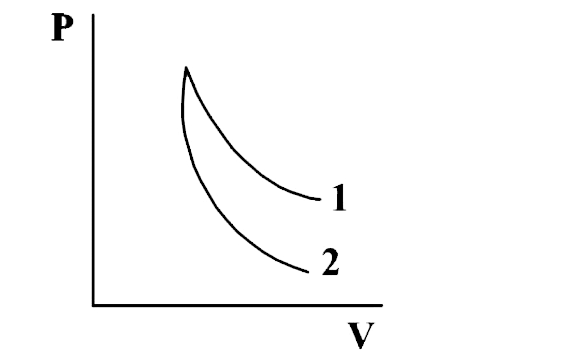
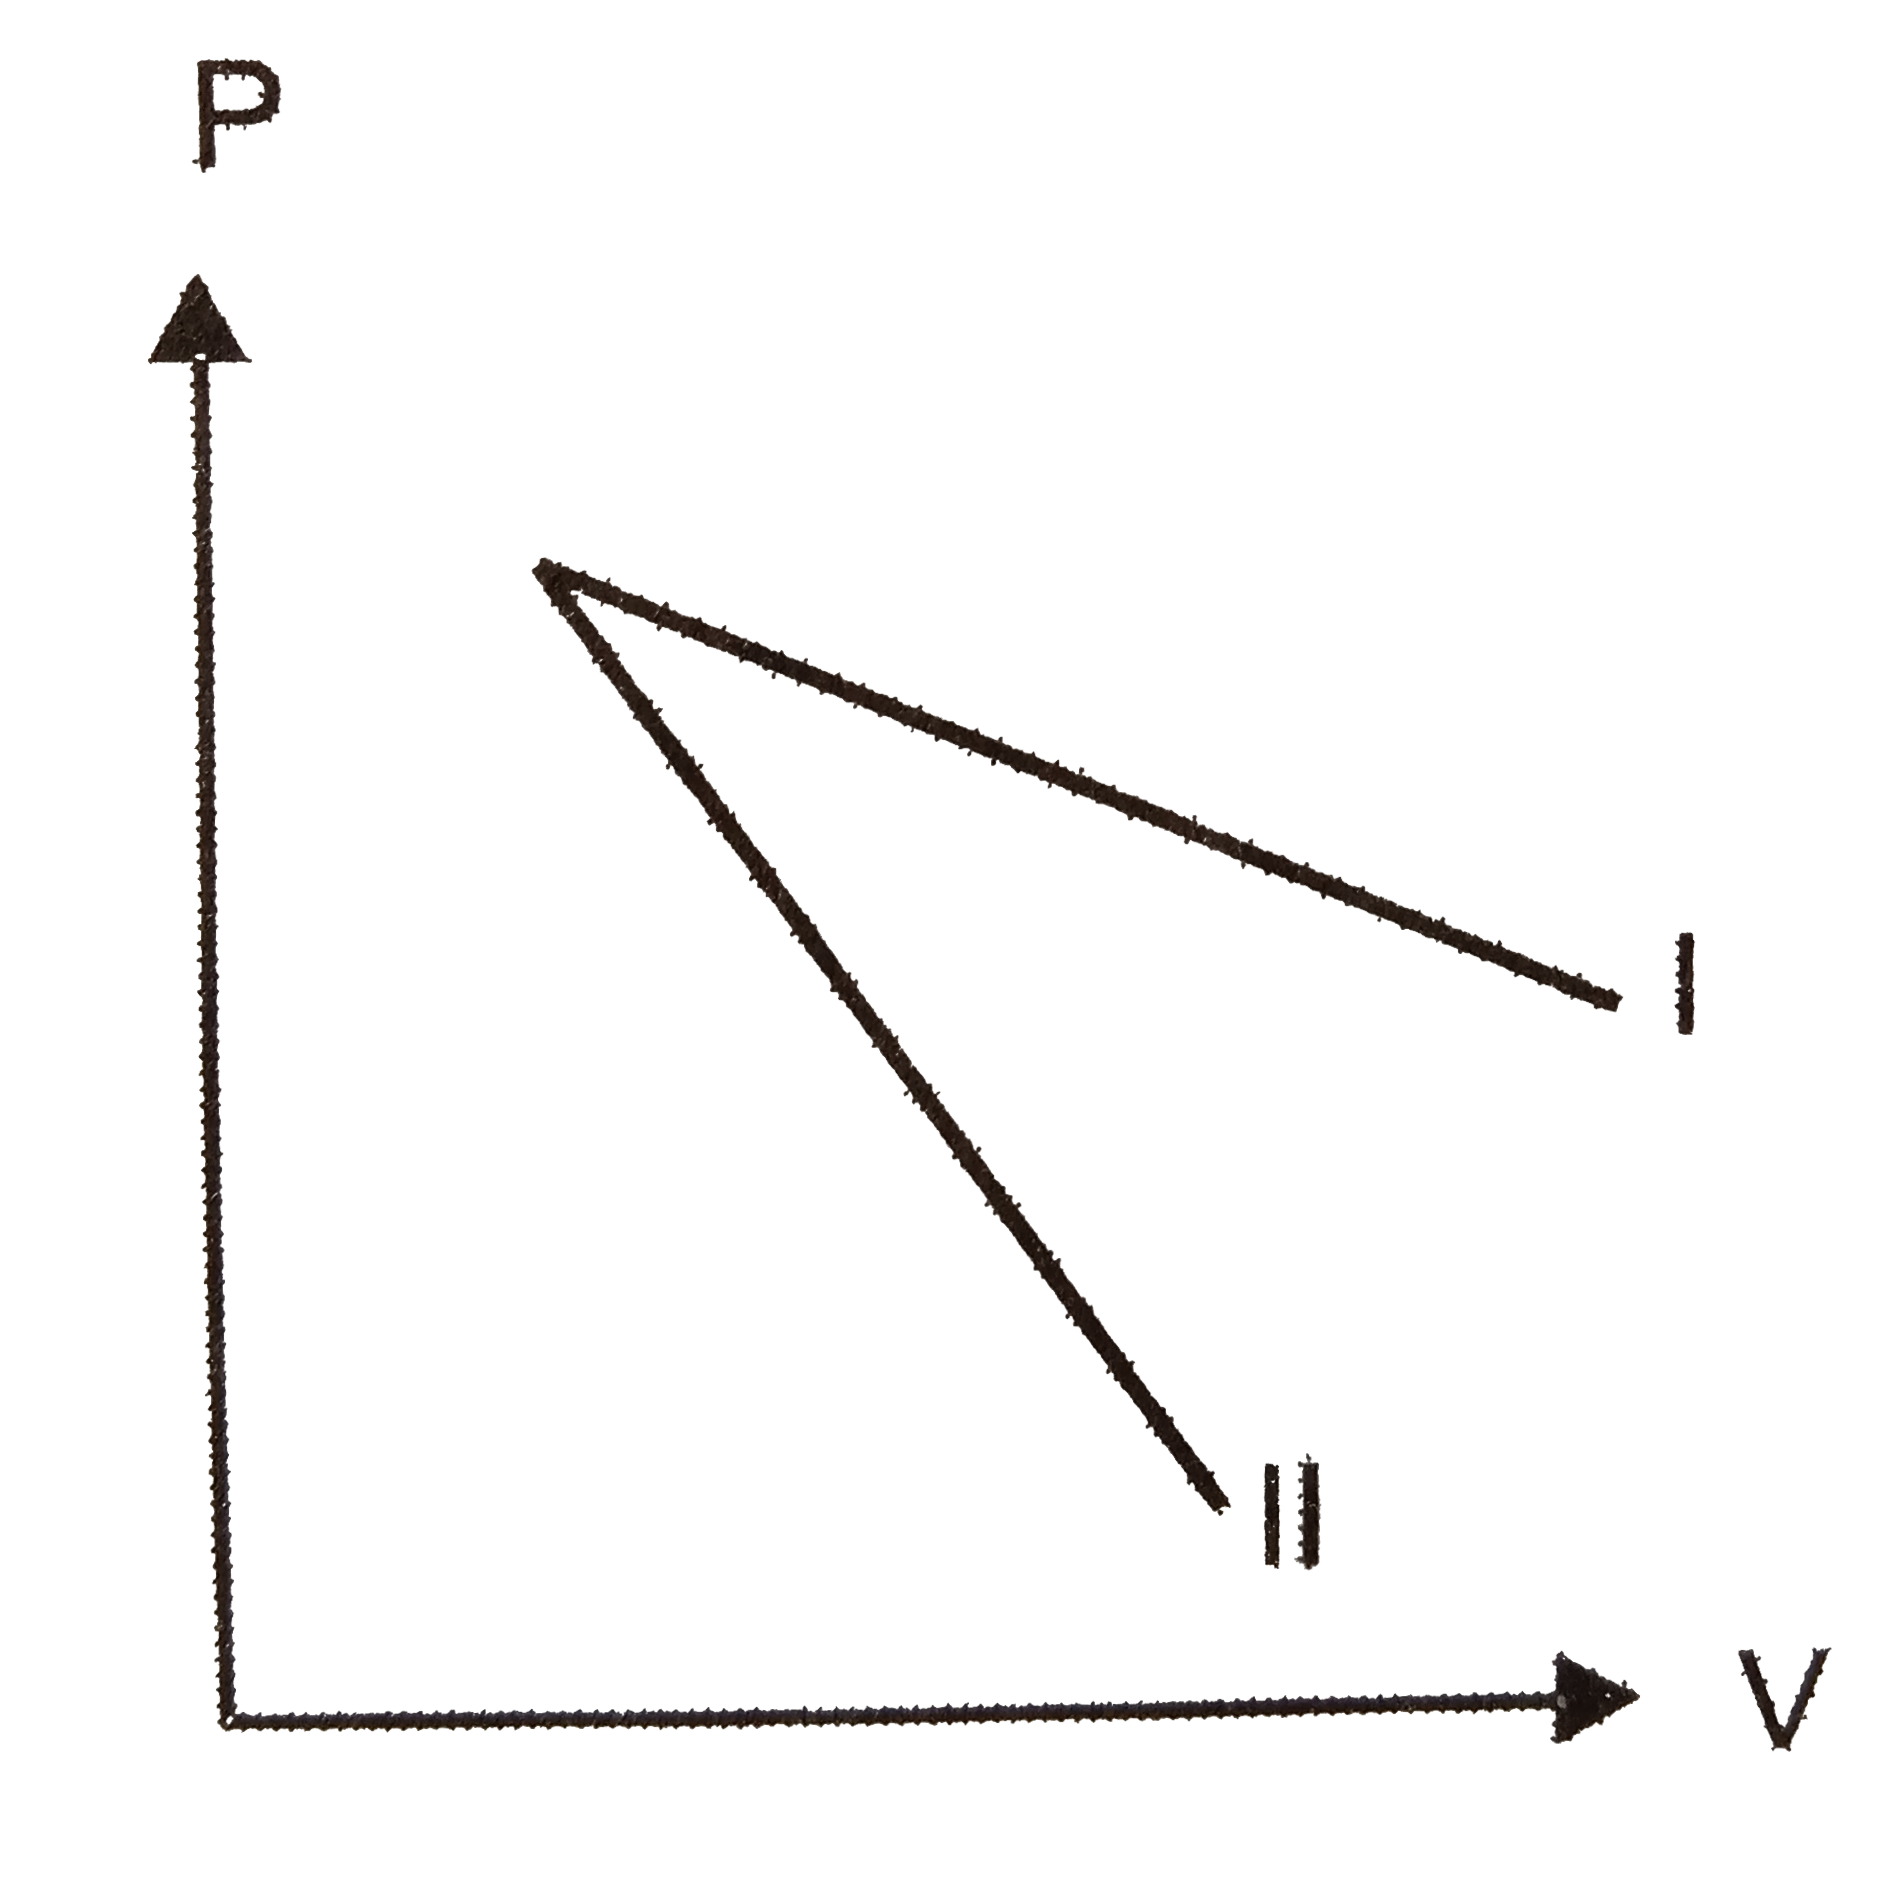
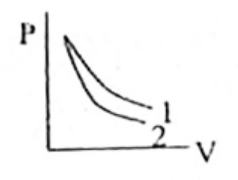
P.V plots for two gases during adiabatic processes are shown in the figure Plots 1 and 2 should correspond respectively to
He and O2
O2 and He
He and Ar
O2 and N2
Slope of the curve =dPdV=−γPV
Also γ=5/3 for monoatomic gas and γ=7/5 for atomic gas
Hence a is correct.
Similar Questions
Knowledge Check
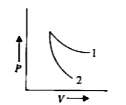
P-V plots for two gases during adiabatic processes are shown in Fig. 15.9.6. Plot 1 and 2 should correspond respectively to
 AHeandO2BO2andHeCHeandArDO2andN2
P-V plots for two gases during an adiabatic process are given in the figure:
Plot A and plot B should correspond to :
View SolutionThe pressure-volume of varies thermodynamic process is shown in graphs:
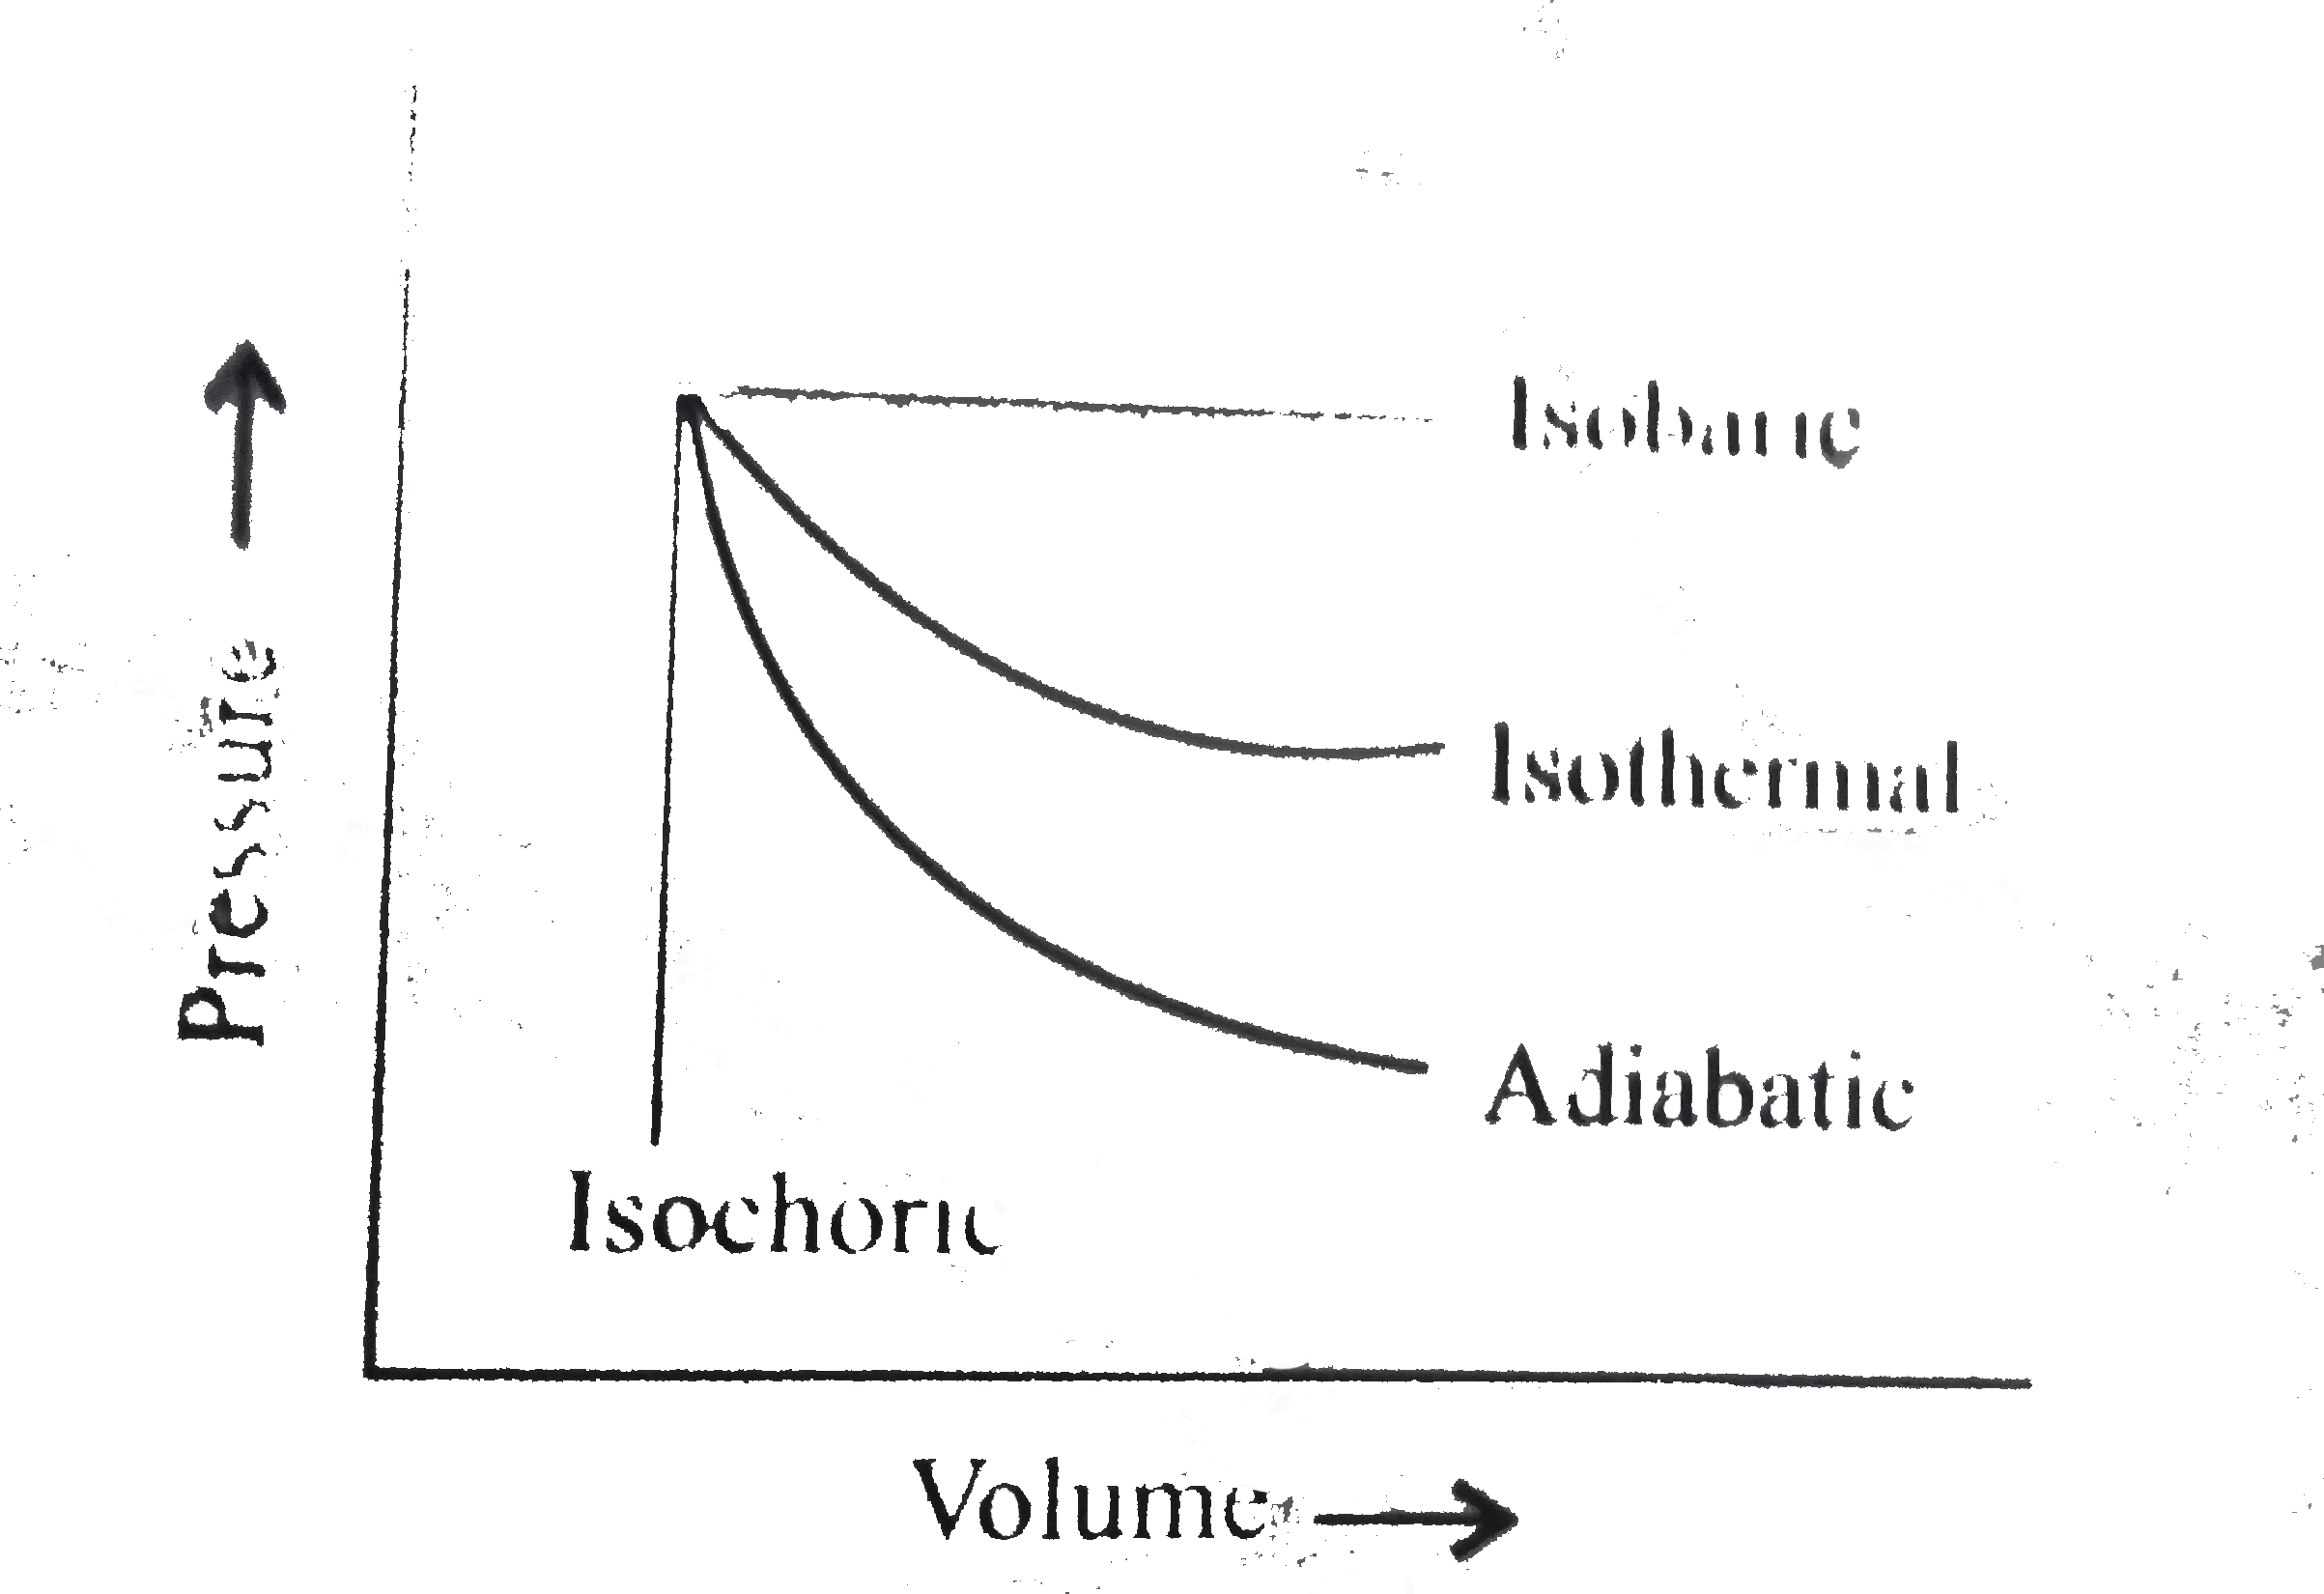
Work is the mole of transference of energy. It has been observed that reversible work done by the system is the maximum obtainable work.
wrev>wirr
The works of isothermal and adiabatic processes are different from each other.
wisothermal reversible=2.303nRTlog10(V2V1)
=2.303nRTlog10(P2P1)
wadiabatic reversible=CV(T1−T2)
P−V plots for two gases during adiabatic processes are given in the given figure:
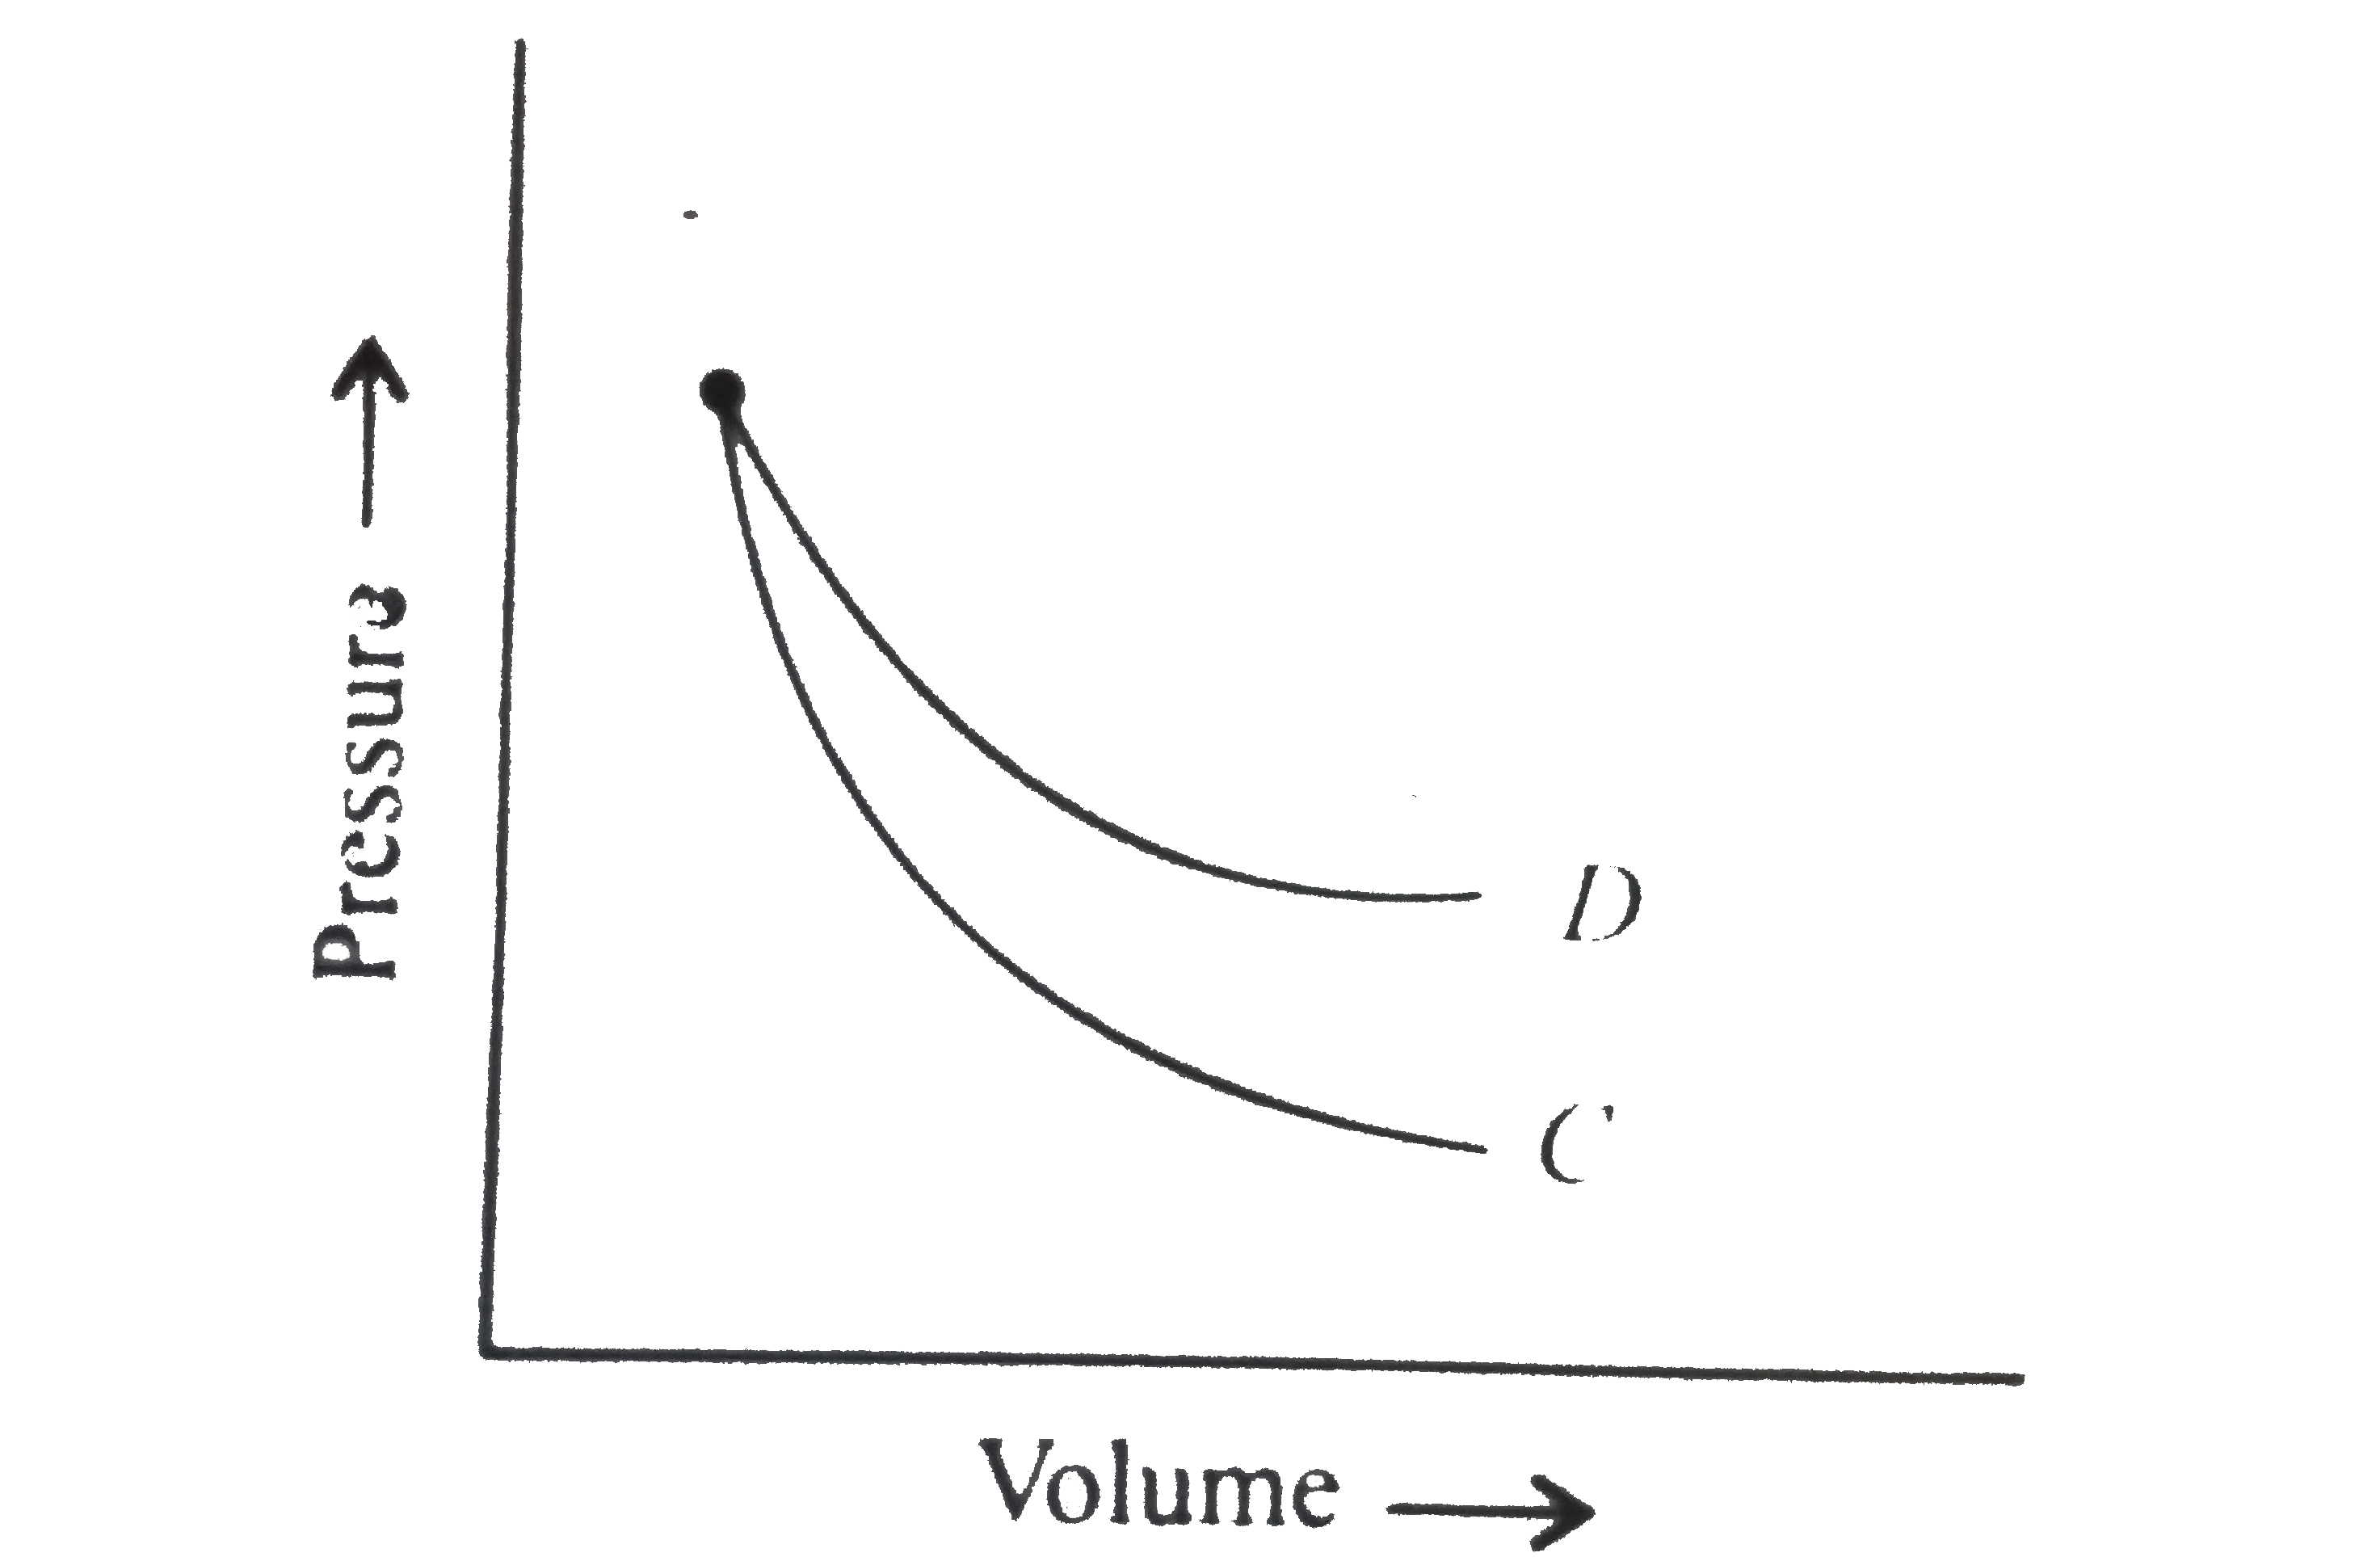
Plot D and Plot C should correspond to
View SolutionP-V plot for two gases (assuming ideal) during adiabatic processes are given in the figure. Plot A and plot B should correspond respectively to :
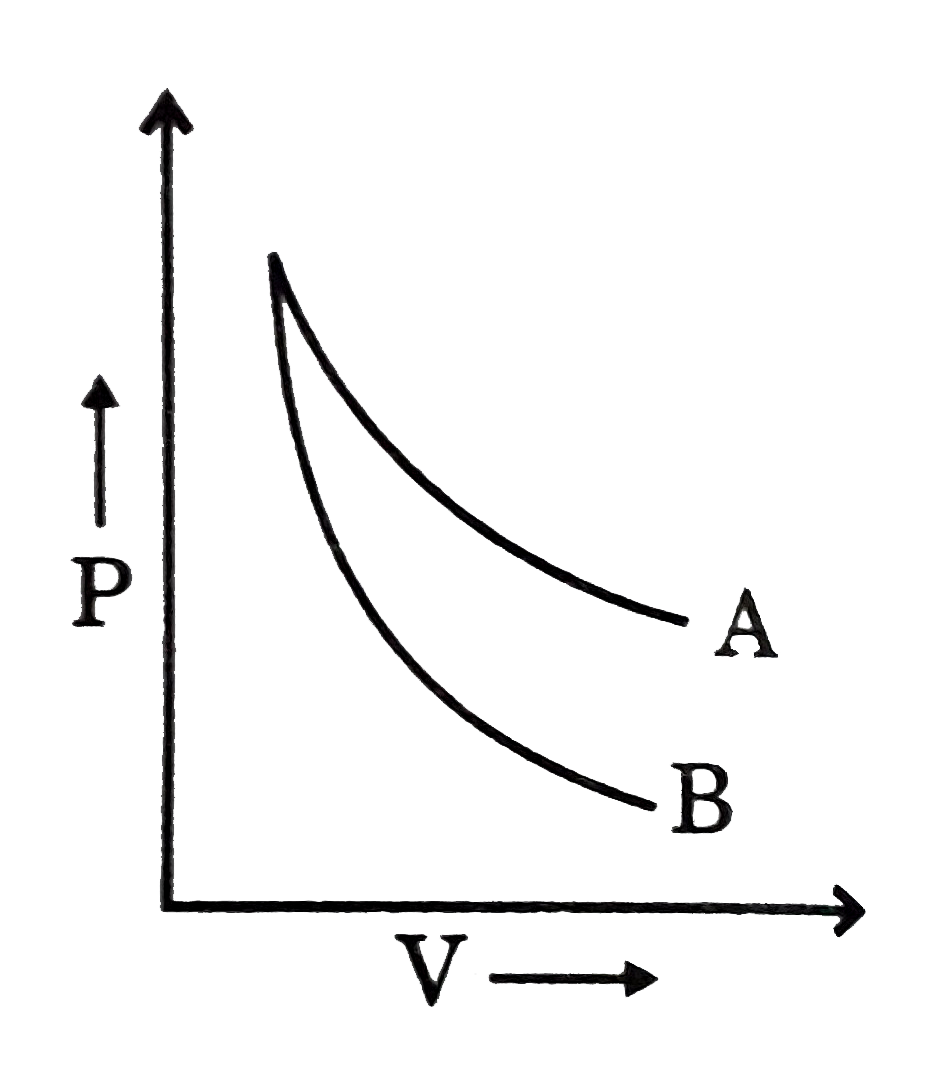
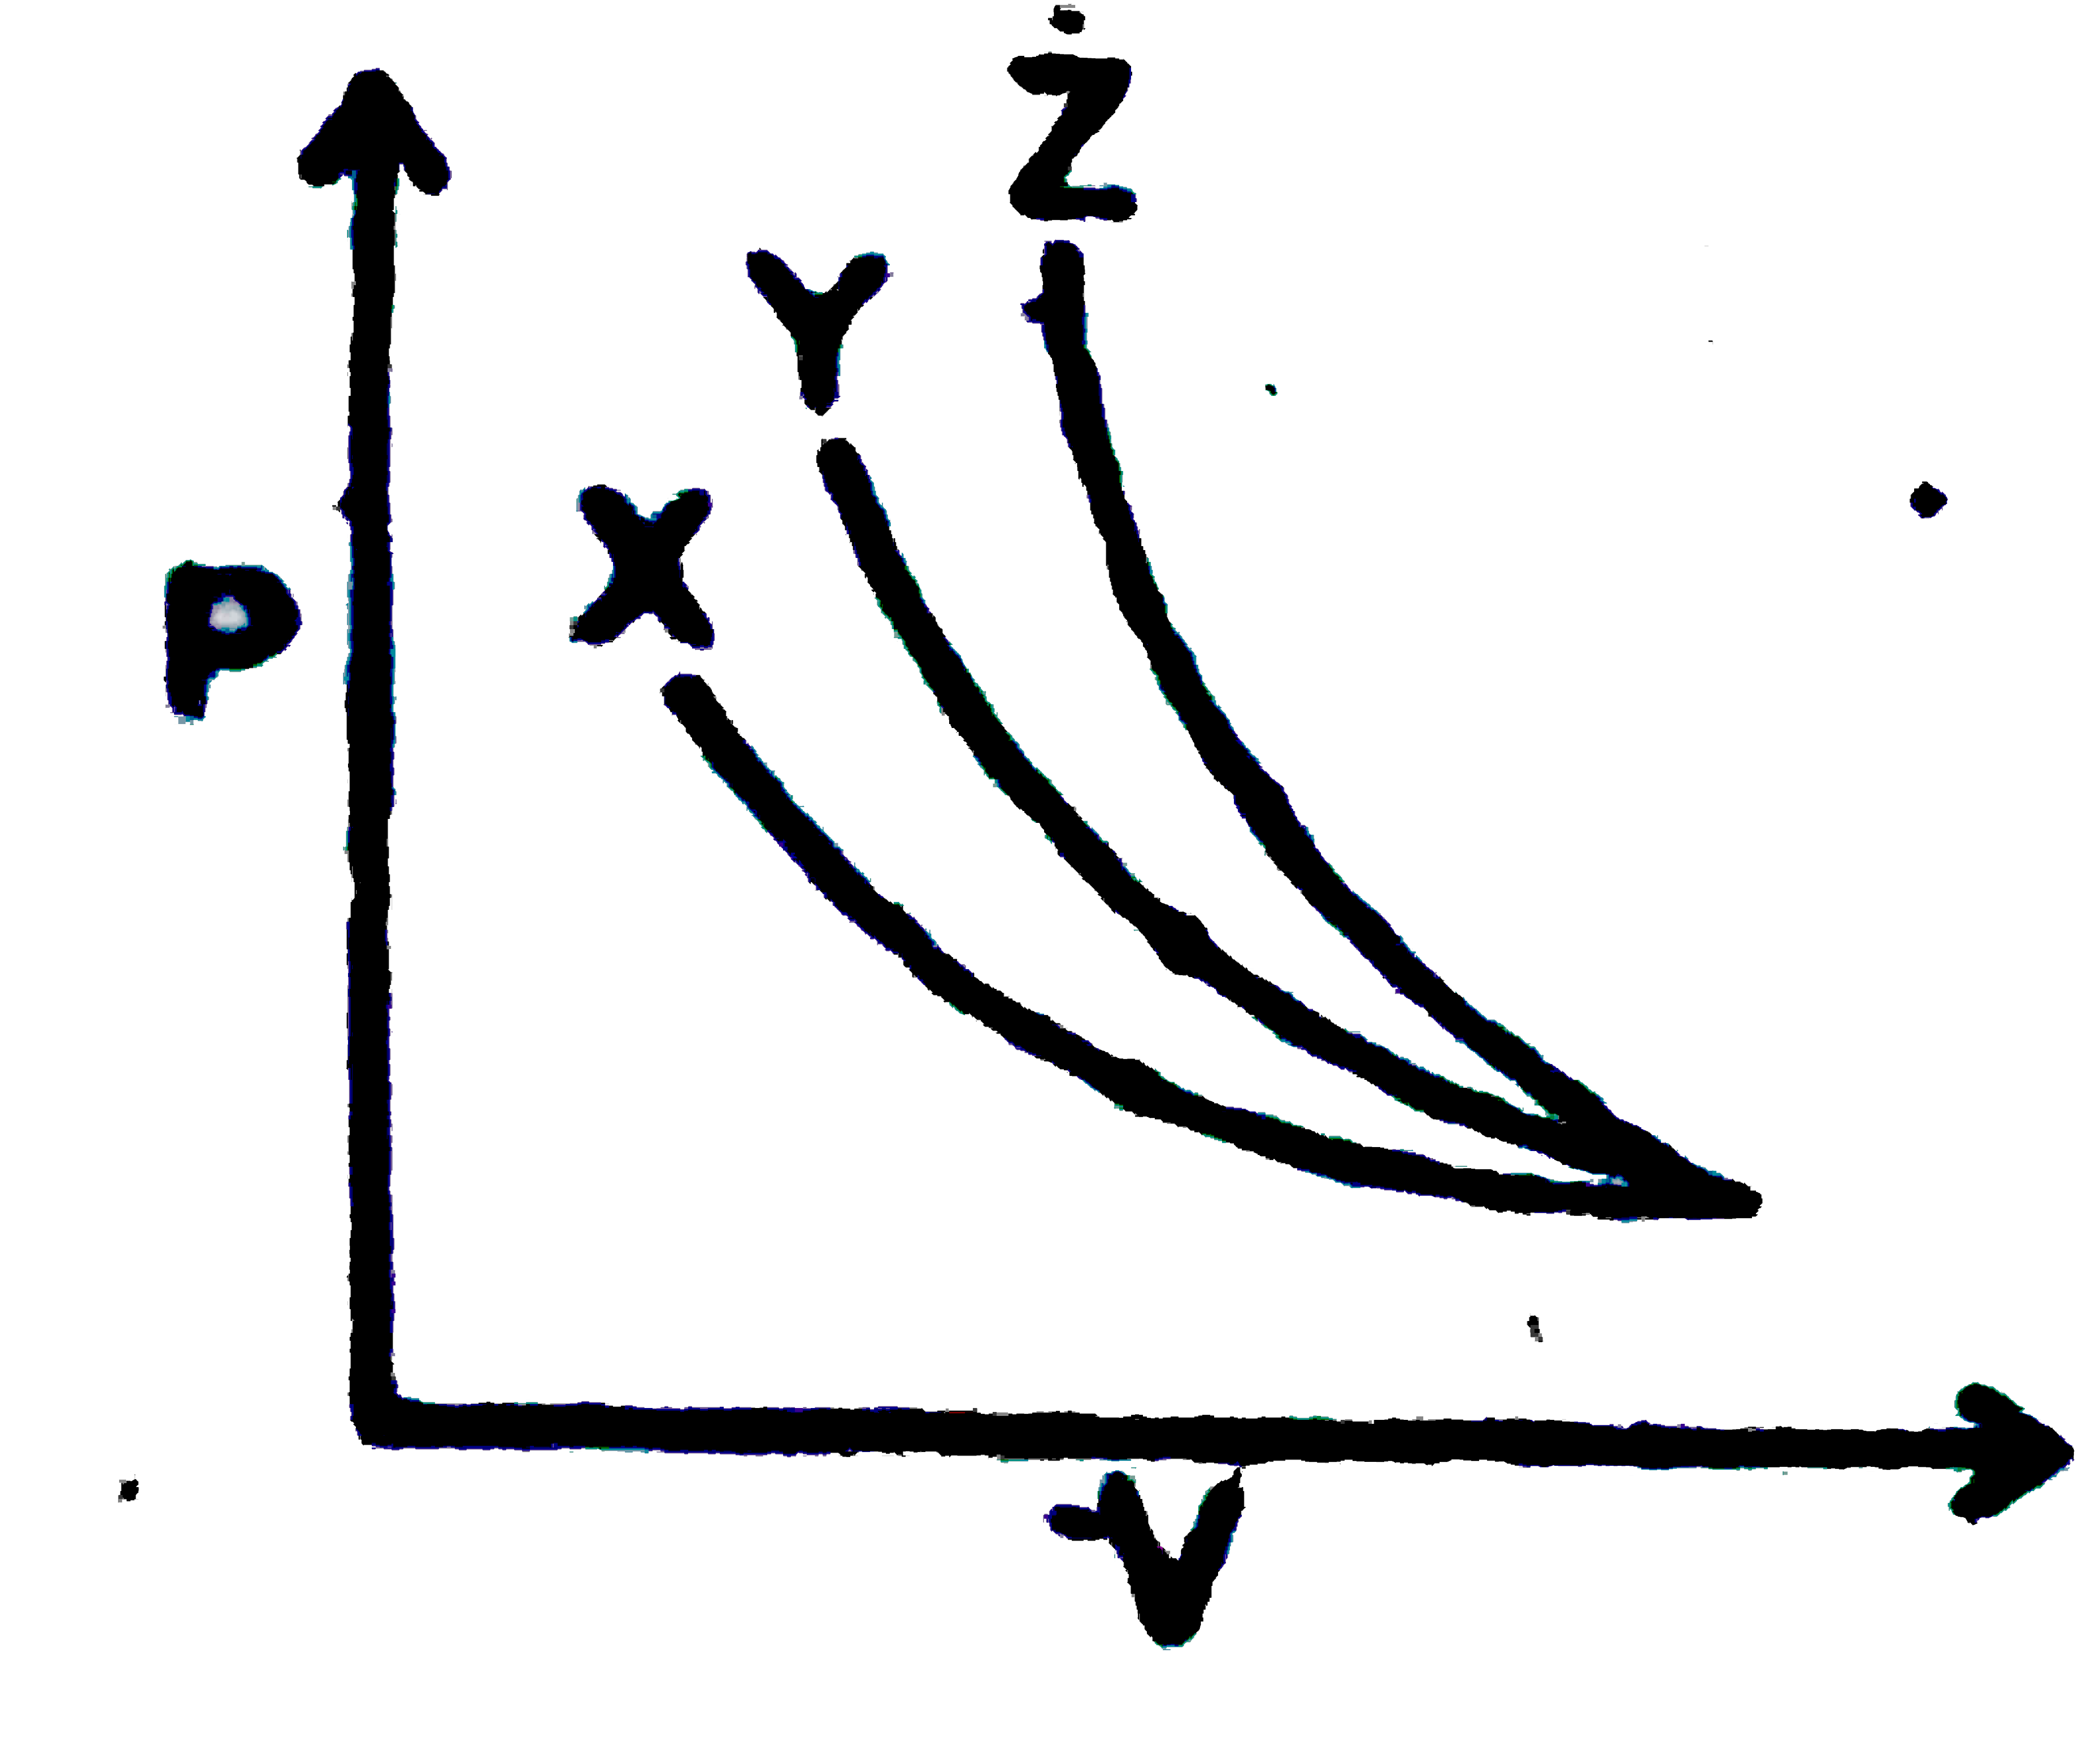
View SolutionP-V plots for three gases (assuming ideal behaviour and similar condition) for reversible adiabatic compression are given in the figure below :
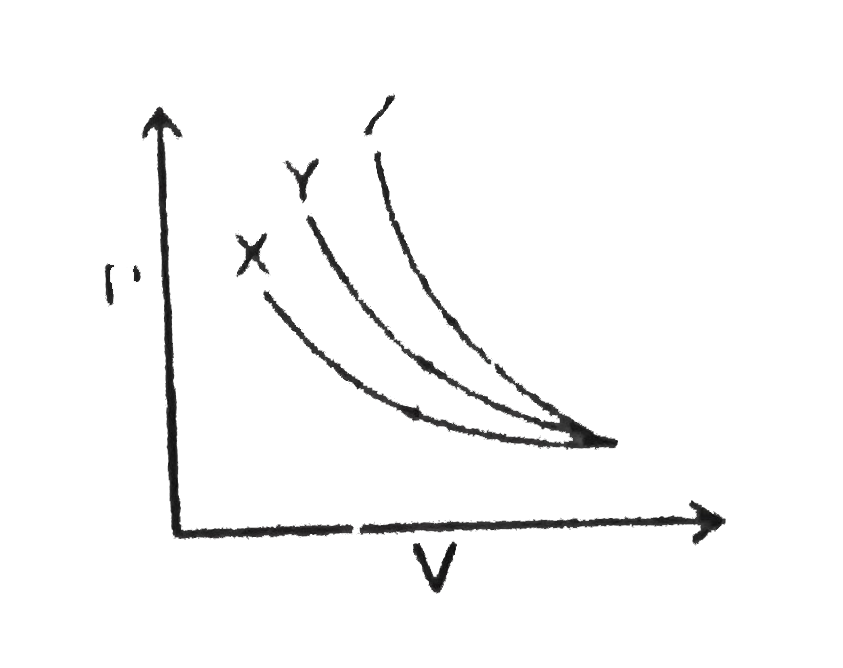
Plots X,Y and Z should correspond to respectively :
View SolutionP−V plts for the gases ( assuming ideal behaviour and similar condition ) for reversible adiabatic compression are given in the figure below :
Plots X,Y and Z should correspond to respectively :
View SolutionDuring adiabatic process, pressure P and density equation is:
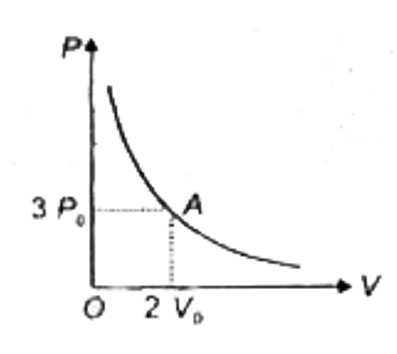
View SolutionThe variation of pressure P with volume V for an ideal monatomic gas during an adiabatic process is shown in figure . At point A the magnitude of rate of change of pressure with volume is
View Solution

