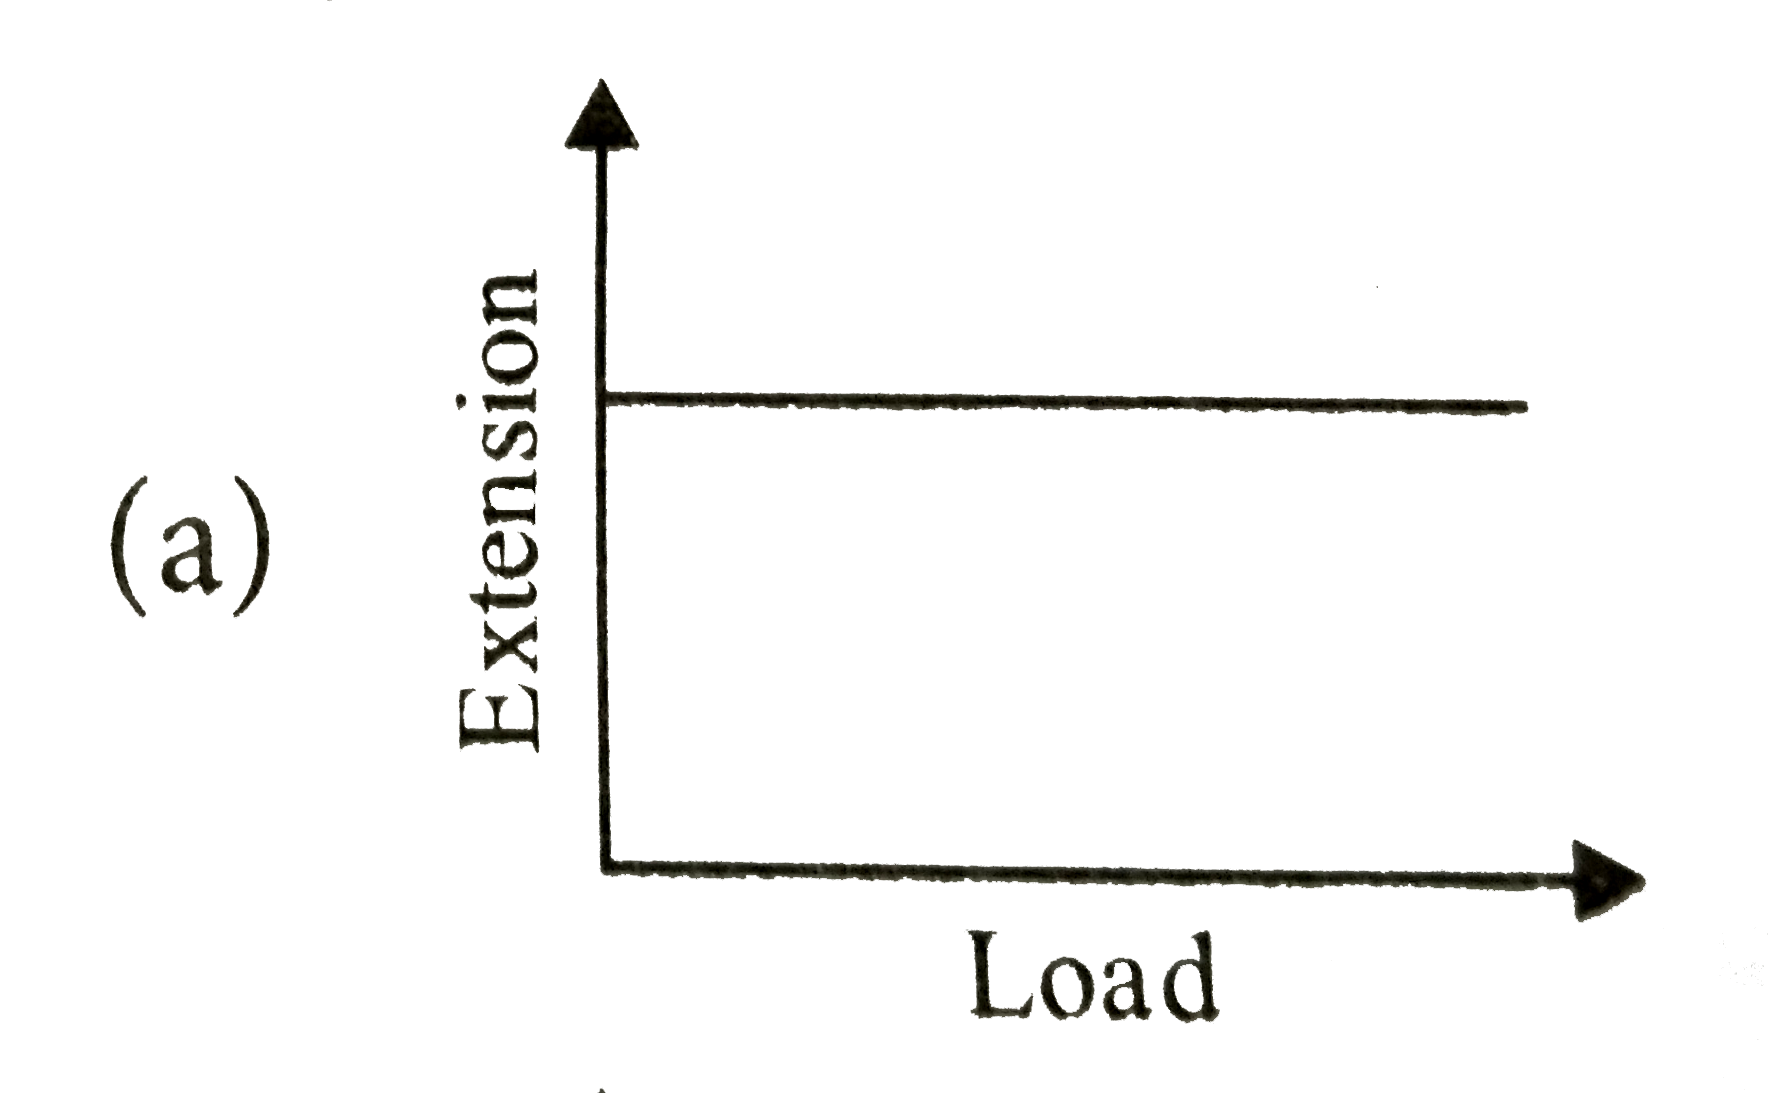
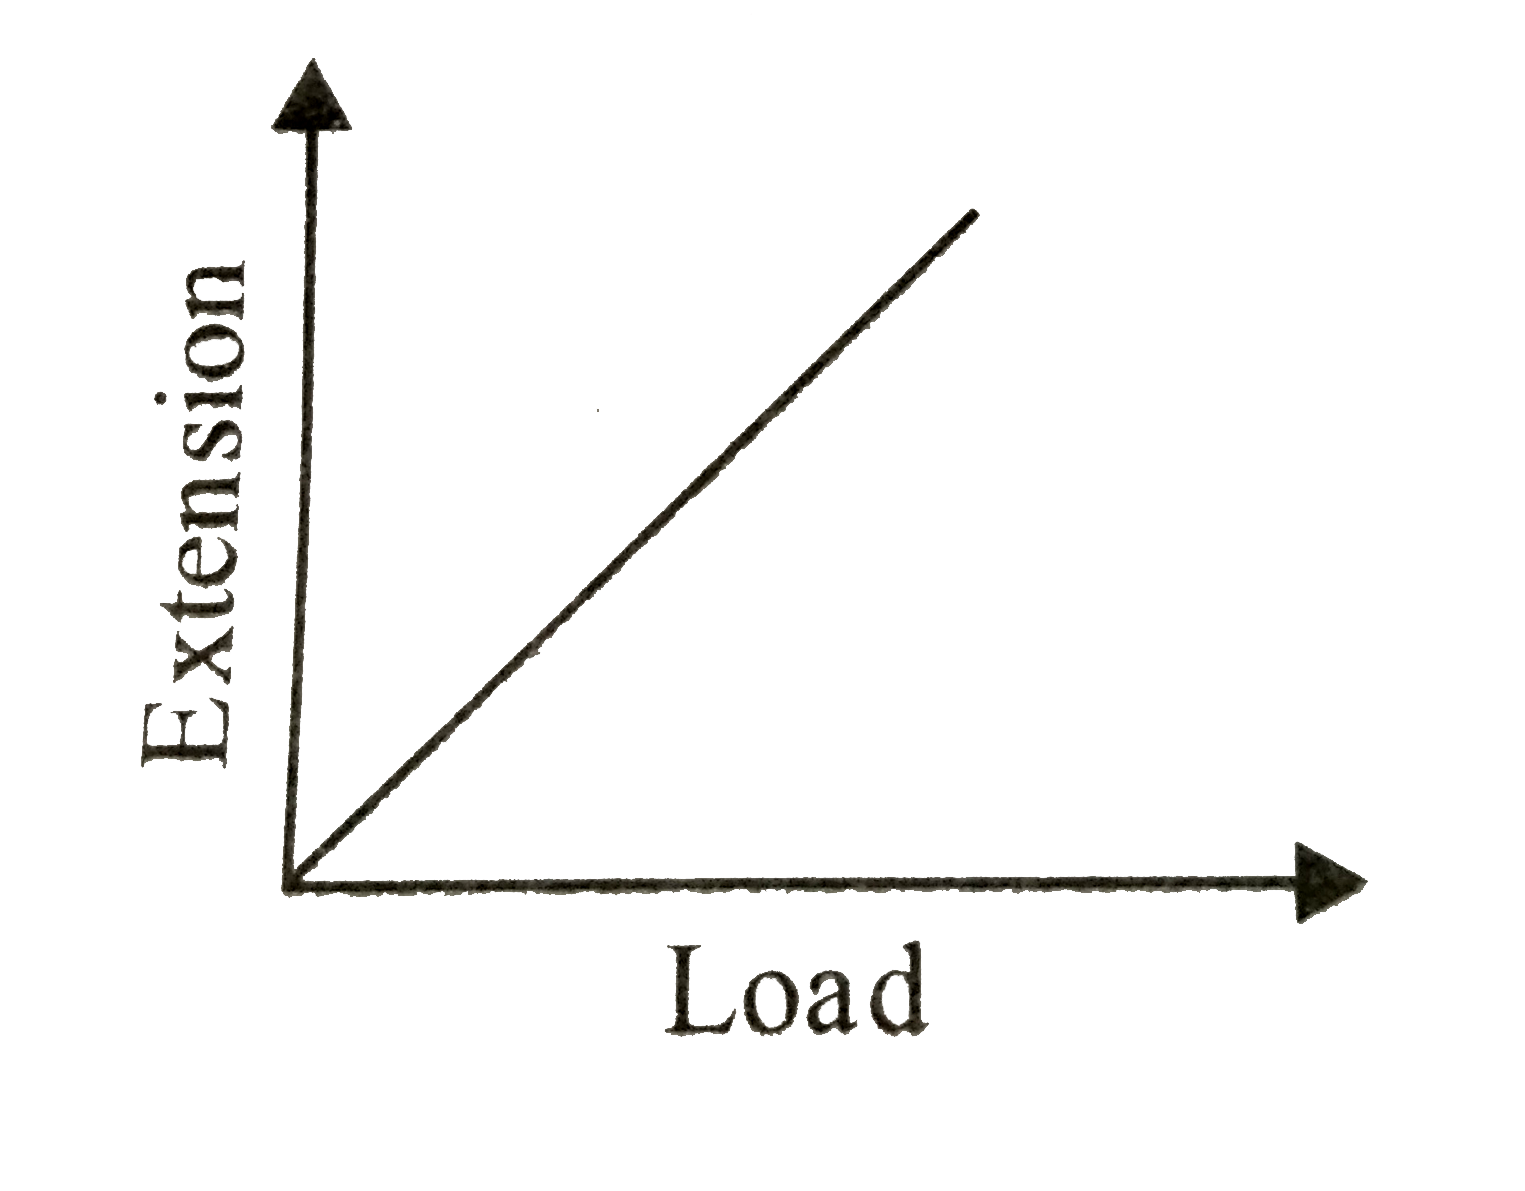
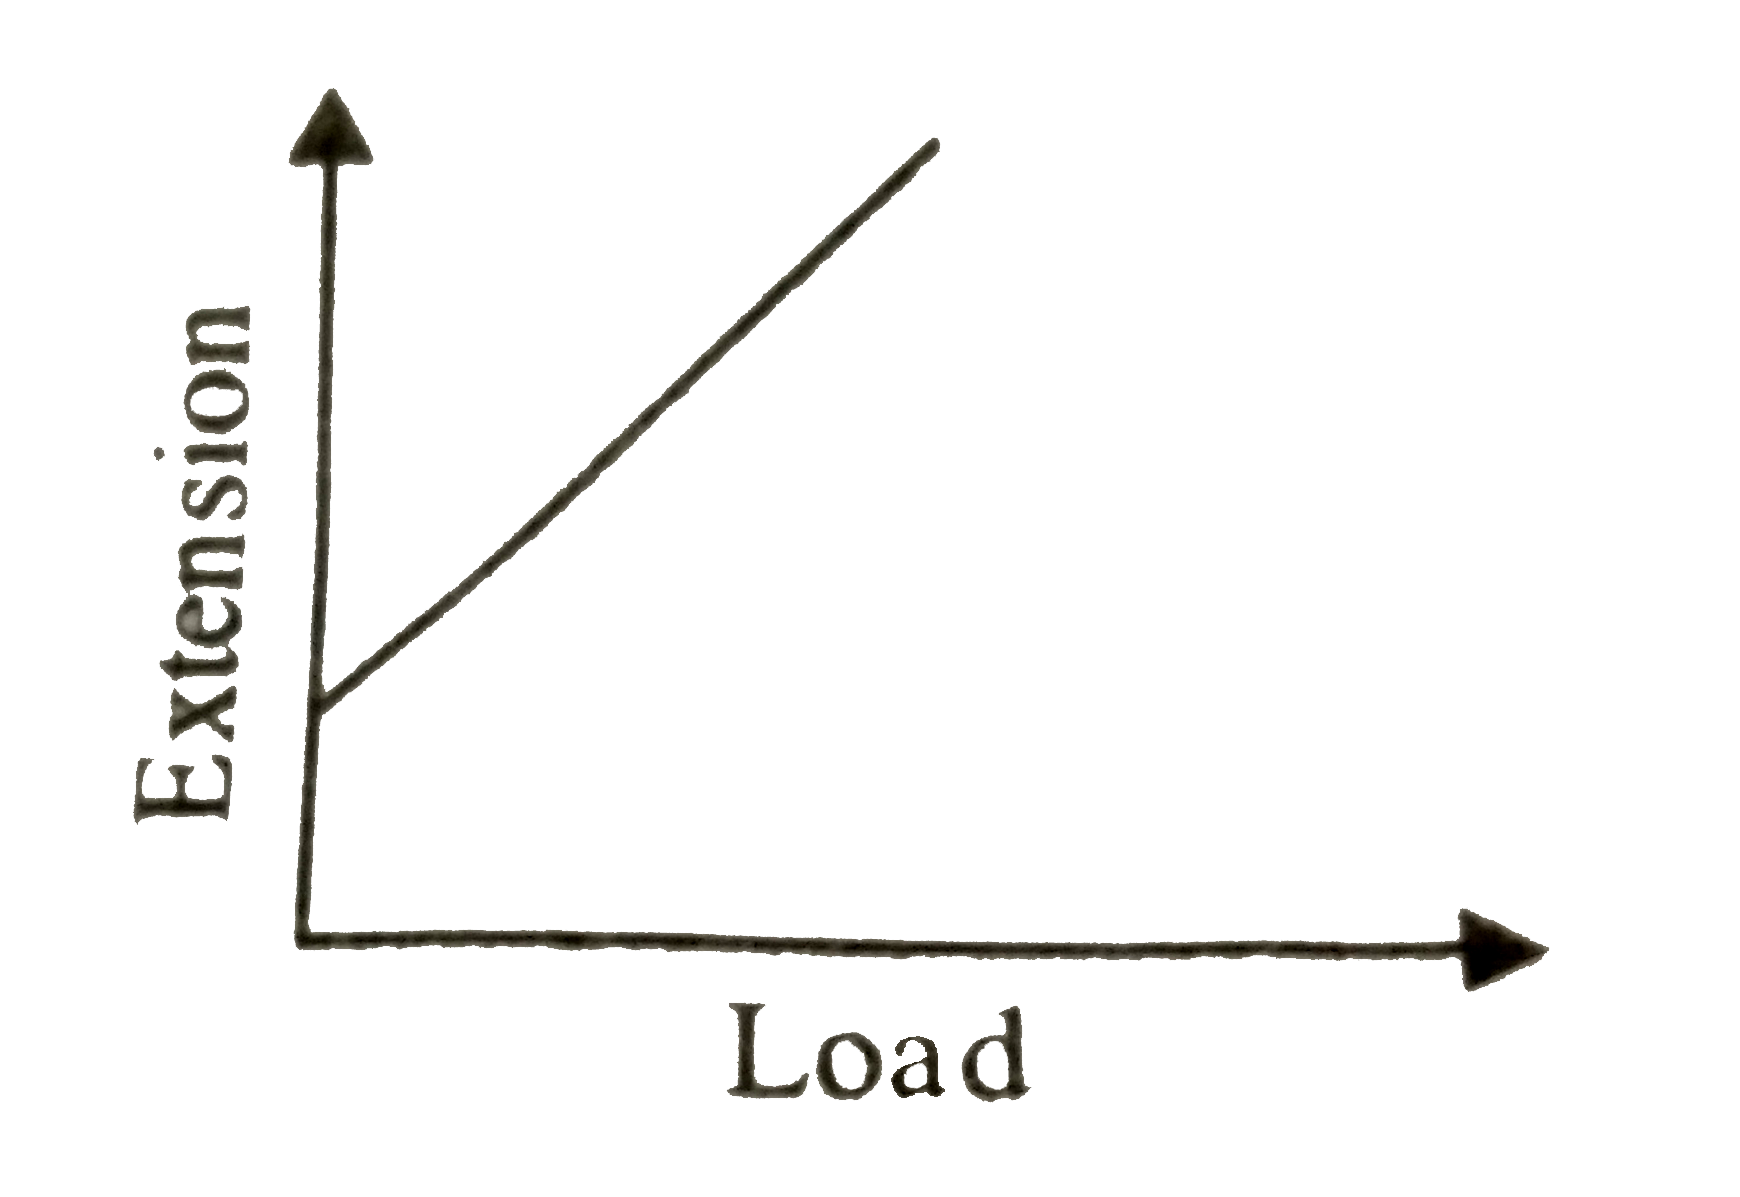
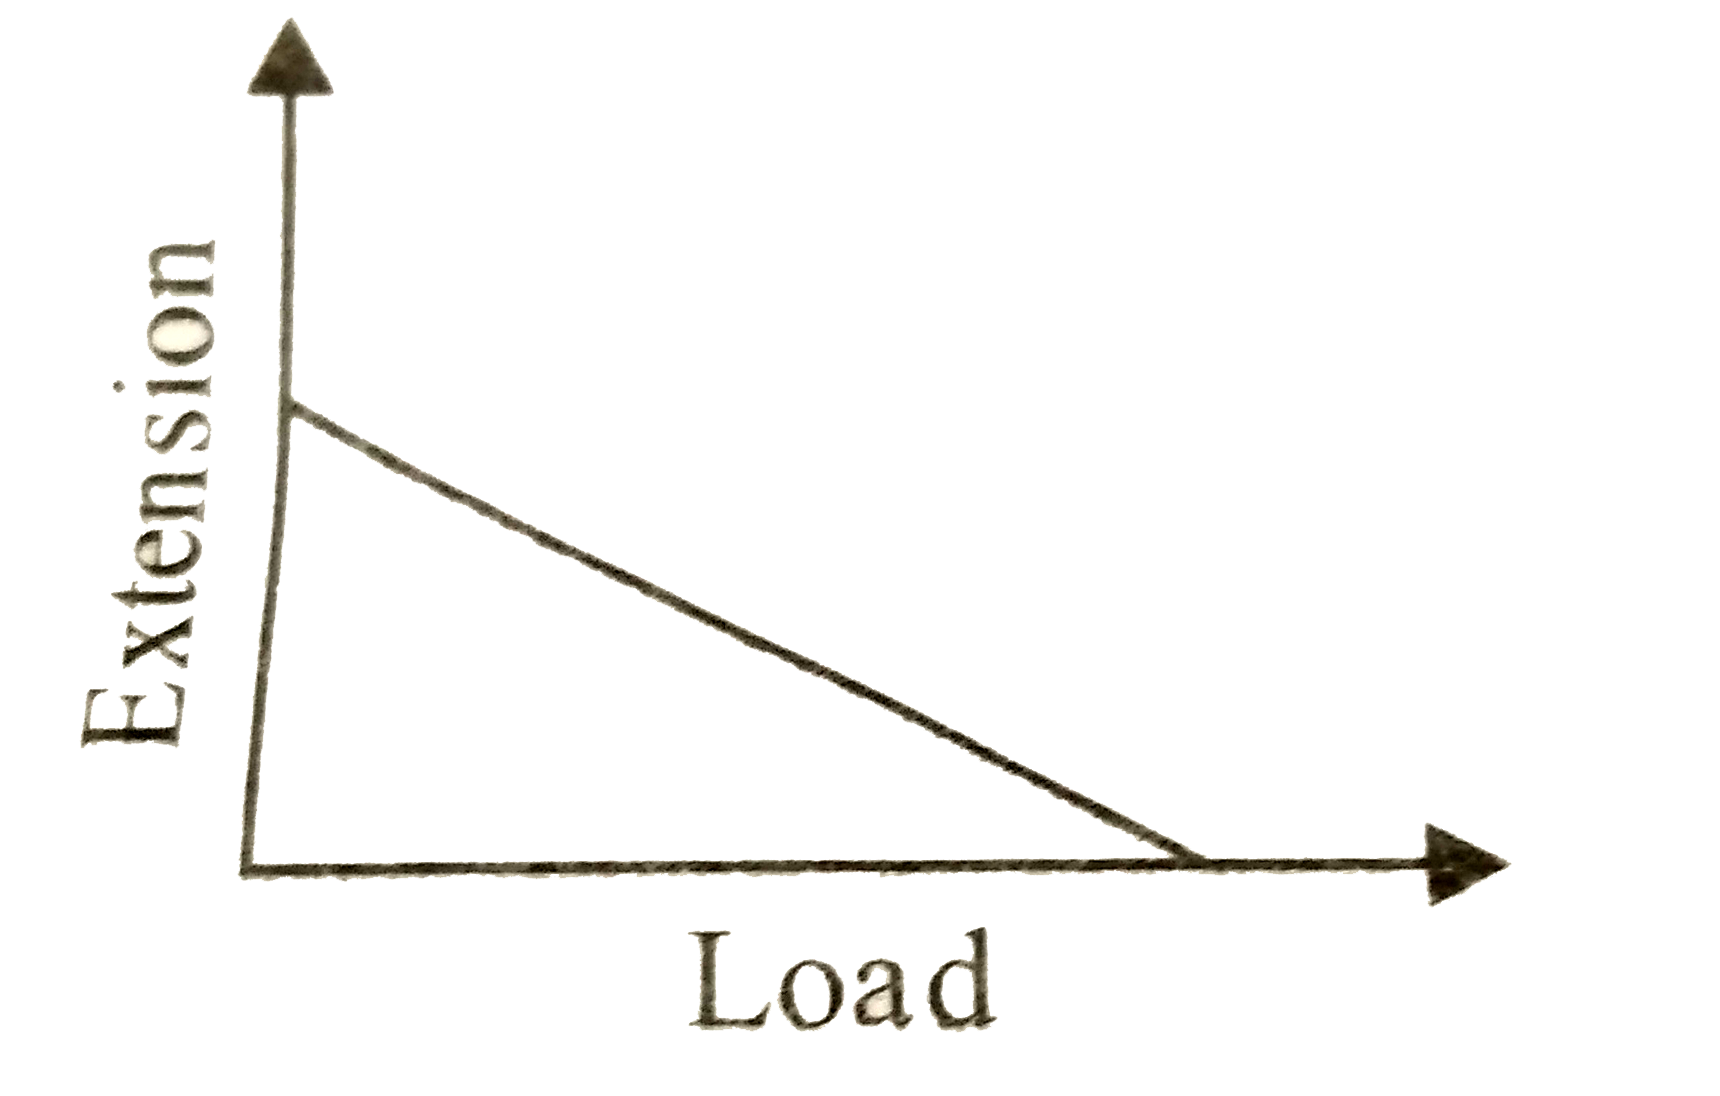
Within elastic limit, which of the following graphs correctly represents the variation of extension in the length of wire with the external load?


The correct Answer is:B
To solve the question regarding the variation of extension in the length of a wire with the external load within the elastic limit, we can follow these steps:
1. Understand the Concept of Elastic Limit:
- The elastic limit is the maximum extent to which a solid may be stretched without permanent alteration of size or shape. Within this limit, the material will return to its original shape once the load is removed.
2. Recall Hooke's Law:
- According to Hooke's Law, the extension (ΔL) of a material is directly proportional to the applied load (F) as long as the elastic limit is not exceeded. This can be expressed mathematically as:
ΔL∝F
- This implies that if the load increases, the extension also increases linearly.
3. Identify the Relationship:
- Since extension is directly proportional to the load, we can express this relationship as:
ΔL=k⋅F
- Here, k is a constant that depends on the material properties and dimensions of the wire.
4. Graphical Representation:
- In a graph where the x-axis represents the load (F) and the y-axis represents the extension (ΔL), the relationship will be a straight line passing through the origin. This indicates that as the load increases, the extension increases linearly.
5. Select the Correct Graph:
- From the options provided, look for a graph that shows a straight line starting from the origin (0,0) and increasing linearly. This graph represents the direct proportionality between the load and extension within the elastic limit.
Conclusion:
- The correct graph that represents the variation of extension in the length of the wire with the external load within the elastic limit is the one that shows a straight line through the origin, indicating a linear relationship.
- The elastic limit is the maximum extent to which a solid may be stretched without permanent alteration of size or shape. Within this limit, the material will return to its original shape once the load is removed.
- According to Hooke's Law, the extension (ΔL) of a material is directly proportional to the applied load (F) as long as the elastic limit is not exceeded. This can be expressed mathematically as:
ΔL∝F
- This implies that if the load increases, the extension also increases linearly.
- Since extension is directly proportional to the load, we can express this relationship as:
ΔL=k⋅F
- Here, k is a constant that depends on the material properties and dimensions of the wire.
- In a graph where the x-axis represents the load (F) and the y-axis represents the extension (ΔL), the relationship will be a straight line passing through the origin. This indicates that as the load increases, the extension increases linearly.
- From the options provided, look for a graph that shows a straight line starting from the origin (0,0) and increasing linearly. This graph represents the direct proportionality between the load and extension within the elastic limit.
- The correct graph that represents the variation of extension in the length of the wire with the external load within the elastic limit is the one that shows a straight line through the origin, indicating a linear relationship.
Topper's Solved these Questions
- MECHANICAL PROPERTIES OF SOLIDSBOOK - NCERT FINGERTPS ENGLISHCHAPTER - MECHANICAL PROPERTIES OF SOLIDSEXERCISE - STRESS-STRAIN CURVE
5 Videos
- MECHANICAL PROPERTIES OF SOLIDSBOOK - NCERT FINGERTPS ENGLISHCHAPTER - MECHANICAL PROPERTIES OF SOLIDSEXERCISE - ELASTIC MODULI
69 Videos
- MECHANICAL PROPERTIES OF SOLIDSBOOK - NCERT FINGERTPS ENGLISHCHAPTER - MECHANICAL PROPERTIES OF SOLIDSEXERCISE - STRESS AND STRAIN
9 Videos
- MECHANICAL PROPERTIES OF FLUIDSBOOK - NCERT FINGERTPS ENGLISHCHAPTER - MECHANICAL PROPERTIES OF FLUIDSEXERCISE - NCERT Exemplar
5 Videos
- MOTION IN A PLANE BOOK - NCERT FINGERTPS ENGLISHCHAPTER - MOTION IN A PLANE EXERCISE - Assertion And Reason
15 Videos
Similar Questions
Knowledge Check
Which of the following reactions are correctly represented?
AR−CH=CH2+HCl→R−CH∣Cl−CH3BR−CH=CH2+HIH2O2−−→hvR−CH2−CH2−ICR−CH=CH2+HBrH2O2−−→hvR−CH2−CH2−BrDR−CH=CH2+HIH2O2−−→hvR−I∣CH−CH3
Which of the following correctly represents the order of atomic radii
View SolutionWhich of following graphs correctly represents the variation of particle momentum with de-Broglie wavelength?
View SolutionWhich of the following correctly represents the stability of reactive intermediate?
View SolutionWhich one of the following structures is correctly represented.
View SolutionWhich of the following graphs correctly represents the variation of β=−dV/dPV
with P for an ideal gas at constant temperature?
View SolutionWhich of the following graphs correctly represents the variation of β=−dV/dPV
with P for an ideal gas at constant temperature?
View SolutionWhich of the following graph correctly represent for equilibrium reaction whose Kp>1?
View Solution
