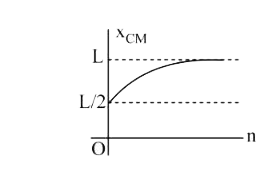
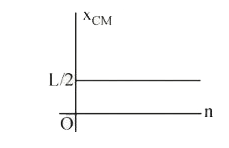
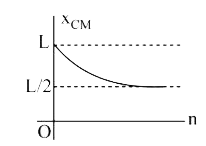
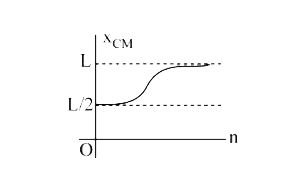
A thin rod of length L is lying on the X-axis with its end at x = 0 and x = L. Its linear density varies with x as K(xL)n , where n can be zero or any positive number. If the position of centre of mass of the rod is plotted against .n. which of the following graph best approximates the dependence of Xcm on n ?


The correct Answer is:C
Topper's Solved these Questions
- APPENDICES Book:AAKASH SERIESChapter:APPENDICES Exercise:SYSTEM OF PARTICLES AND ROTATIONAL MOTION (MOMENT OF INTERTIA)
Explore 18 Videos
- APPENDICES Book:AAKASH SERIESChapter:APPENDICES Exercise:SYSTEM OF PARTICLES AND ROTATIONAL MOTION (CONSERVATION OF ANGULAR MOMENTUM)
Explore 7 Videos
- APPENDICES Book:AAKASH SERIESChapter:APPENDICES Exercise:WORK POWER ENERGY (SCALAR OR DOT PRODUCT) (COLLISIONS)
Explore 26 Videos
- CALORIMETRY Book:AAKASH SERIESChapter:CALORIMETRY Exercise:ADDITIONAL PRACTICE EXERCISE (LEVEL - II) (LECTURE SHEET (ADVANCED)(Matrix Type Questions)
Explore 1 Video
Similar Questions
A thin rod of length L is lying along the x-axis with its ends at x=0 and x=L its linear (mass/length) varies with x as k(xL)n, where n can be zero of any positive number. If to position xCM of the centre of mass of the rod is plotted against 'n', which of the following graphs best apporximates the dependence of xCM on n?
View SolutionA thin rod of length 6m is lying along the x-axis with its ends at x=0 and x=6m. It linear density (mass/length) varies with x as kx4. Find the position of centre of mass of rod in meters.
View Solution
Knowledge Check
A thin rod of length L is lying along the x-axis with its ends at x = 0 and x = L. Its linear density (mass/length) varies with x as k(xL)n where n can be zero or any positive number. If the position XCM of the centre of mass of the rod is plotted against n, which of the following graphs best approximates the dependence of XCM on n?
A B
B C
C D
D
A thin rod of length L is lying along the x-axis with its ends at x = 0 and x = L. Its linear density (mass/length) varies with x as k(xL)n where n can be zero or any positive integer. If position Xcm of centre of mass of the rod is plotted against n, which of the following graphs best approximates the dependence of xCM on n?
A B
B C
C D
D
A thin rod of length 6 m is lying along the x-axis with its ends at x=0 and x=6m. Its linear density *mass/length ) varies with x as kx4. Find the position of centre of mass of rod in meters.
A5mB3mC2mD4m
A thin rod of length 6 m is lying along the x-axis with its ends at x=0 and x=6m. Its linear density *mass/length ) varies with x as kx4. Find the position of centre of mass of rod in meters.
View SolutionA rod of length L is placed along the x-axis between x = 0 and x = L. The linear density (mass/length) λ of the rod varies with the distance x from the origin as λ = Rx. Here, R is a positive constant. Find the position of centre of mass of this rod.
View SolutionA rod of length L is placed along the x-axis between x = 0 and x = L. The linear density (mass/ length) λ of the rod varies with the distance x from the origin as λ=Rx. Here, R is a positive constant. Find the position of centre of mass of this rod.
View SolutionA rod of length L is placed along the x-axis between x=0 and x=L. The linear mass density (mass/length) ρ of the rod varies with the distance x from the origin as ρ=a+bx. Here, a and b are constants. Find the position of centre of mass of this rod.
View SolutionA rod of length L is placed along the x-axis between x=0 and x=L. The linear mass density (mass/length) ρ of the rod varies with the distance x from the origin as ρ=a+bx. Here, a and b are constants. Find the position of centre of mass of this rod.
View Solution

