A rod of length L is placed along the x-axis between x = 0 and x = L. The linear density (mass/length) of the rod varies with the distance x from the origin as = Rx. Here, R is a positive constant. Find the position of centre of mass of this rod.
Mass of element dx situated at x = x is
dm = dx = R x dx
The COM of the element has coordinates (x, 0, 0).
Therefore, x-coordinates of COM of the rod will be
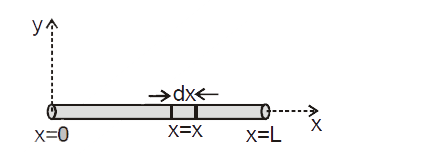
The y-coordinates of COM of the rod is
(as y = 0)
Similarly,
Hence, the centre of mass of the rod lies at
Topper's Solved these Questions
- CENTRE OF MASSBook:MOTIONChapter:CENTRE OF MASSExercise:Exercise - 1
Explore 71 Videos
- CENTRE OF MASSBook:MOTIONChapter:CENTRE OF MASSExercise:Exercise - 2 (Level-I)
Explore 40 Videos
- Capacitance Book:MOTIONChapter:Capacitance Exercise:EXERCISE -4 LEVEL II
Explore 19 Videos
- CIRCULAR MOTIONBook:MOTIONChapter:CIRCULAR MOTIONExercise:EXERCISE - 4
Explore 16 Videos
Similar Questions
A rod of length L is placed along the x-axis between x = 0 and x = L. The linear density (mass/ length) λ of the rod varies with the distance x from the origin as λ=Rx. Here, R is a positive constant. Find the position of centre of mass of this rod.
View SolutionA rod of length L is placed along the x-axis between x=0 and x=L. The linear mass density (mass/length) ρ of the rod varies with the distance x from the origin as ρ=a+bx. Here, a and b are constants. Find the position of centre of mass of this rod.
View Solution
Knowledge Check
A thin rod of length L is lying along the x-axis with its ends at x = 0 and x = L. Its linear density (mass/length) varies with x as k(xL)n where n can be zero or any positive number. If the position XCM of the centre of mass of the rod is plotted against n, which of the following graphs best approximates the dependence of XCM on n?
A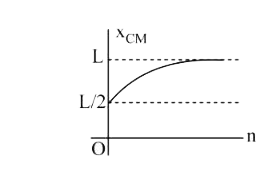 B
B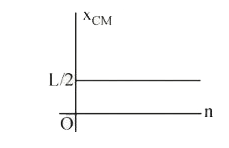 C
C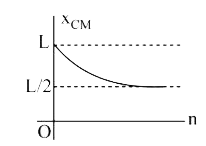 D
D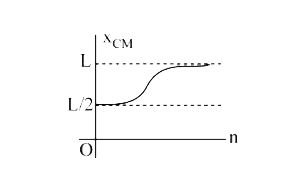
A thin rod of length L is lying along the x-axis with its ends at x = 0 and x = L. Its linear density (mass/length) varies with x as k(xL)n where n can be zero or any positive integer. If position Xcm of centre of mass of the rod is plotted against n, which of the following graphs best approximates the dependence of xCM on n?
A B
B C
C D
D
A thin rod of length 6 m is lying along the x-axis with its ends at x=0 and x=6m. Its linear density *mass/length ) varies with x as kx4. Find the position of centre of mass of rod in meters.
A5mB3mC2mD4m
A rod of length L is placed along the X-axis between x=0andx=L. The linear density (mass/length) ρ of the rod varies with the distance x from the origin as ρj=a+bx. a. Find the SI units of a and b. b. Find the mass of the rod in terms of a,b, and L.
View SolutionA rod of length L is placed along the x-axis between x=0 and x=L. The linear mass density is λ such that λ=a+bx. Find the mass of the rod.
View SolutionThe density of a thin rod of length l varies with the distance x from one end as ρ=ρ0x2l2. Find the position of centre of mass of rod.
View SolutionLinear mass density of a rod AB ( of length 10 m) varied with distance x from its end A as λ=λ0x3 (λ0 is positive constant). Distance of centre of mass the rod, form end B is
View SolutionA thin rod of length 6m is lying along the x-axis with its ends at x=0 and x=6m. It linear density (mass/length) varies with x as kx4. Find the position of centre of mass of rod in meters.
View Solution

