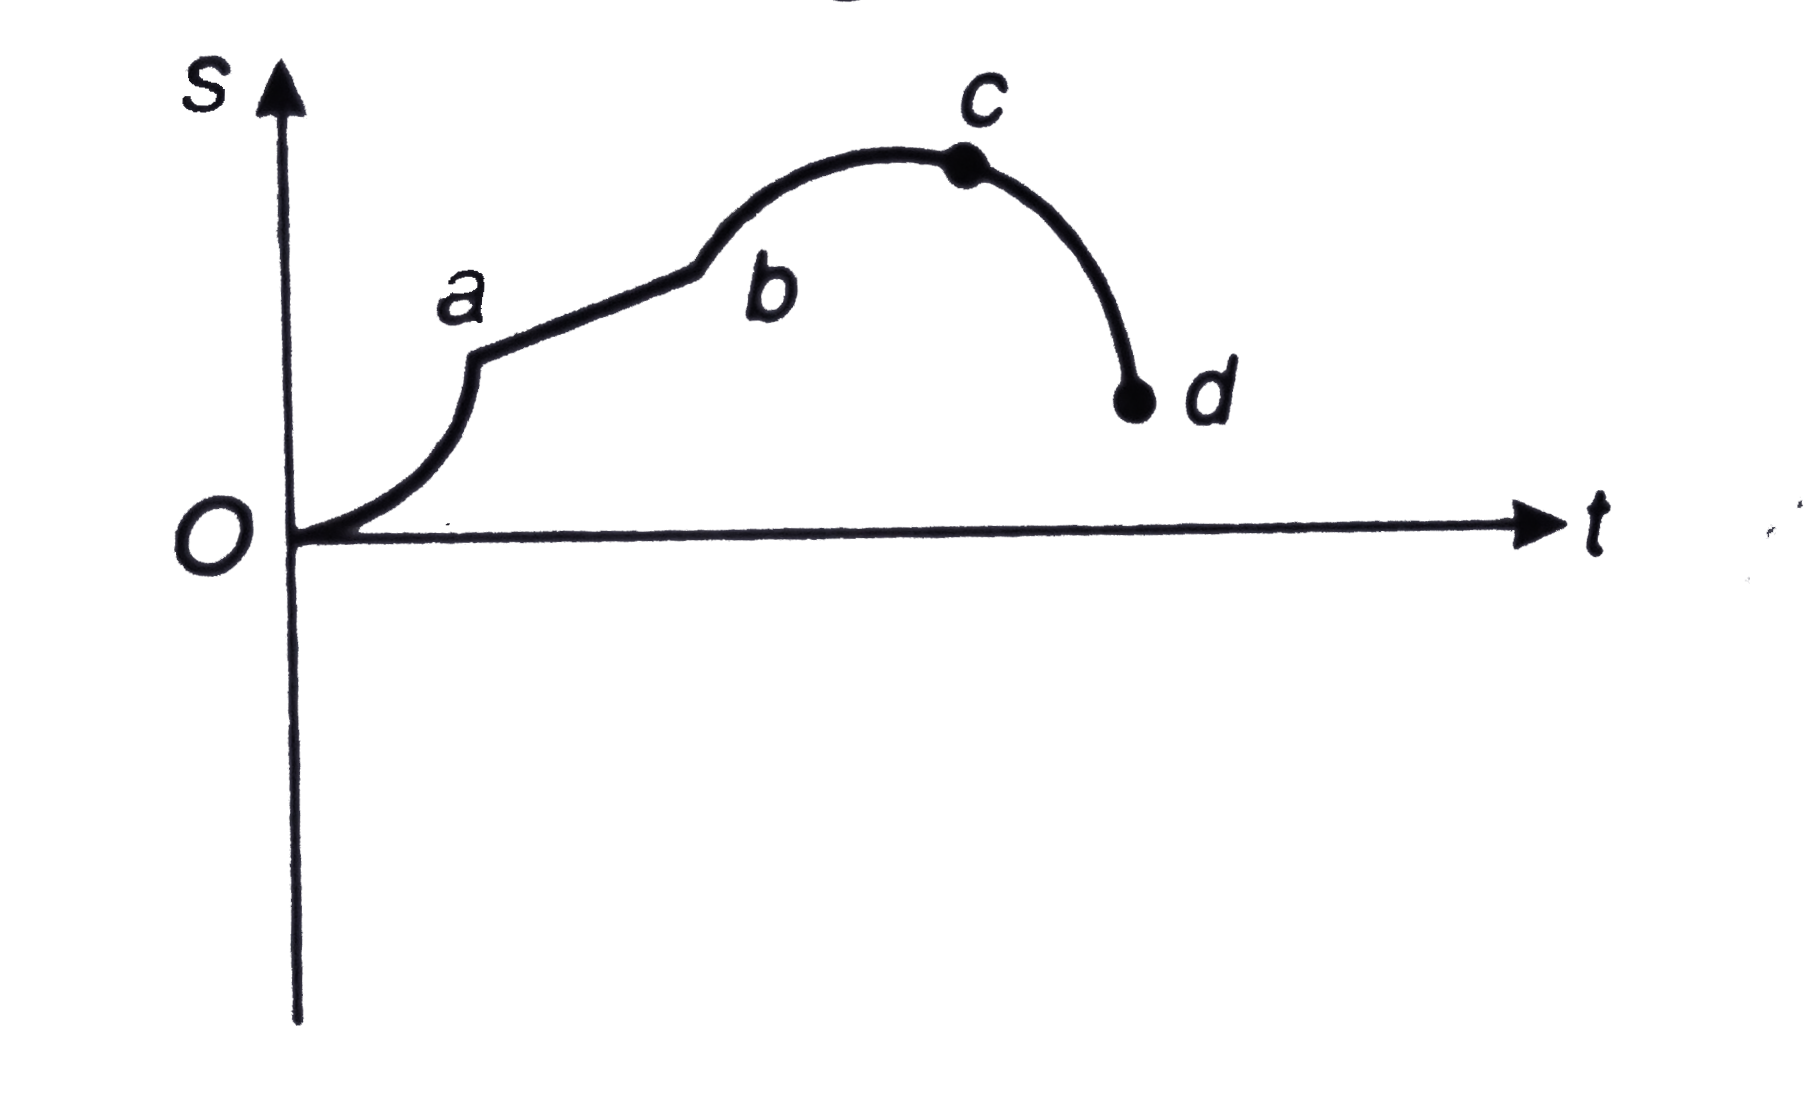
The graph between the displacement x and time t for a particle moving in a straight line is shown in figure. During the interval OA, AB, BC and CD, the acceleration of the particles is
 Solution in Telugu
OA- +, AB- 0, BC- +, CD- +
OA- -, AB- 0, BC- +, CD- 0
OA- +, AB- 0, BC- -, CD- +
OA- -, AB- 0, BC- -, CD- 0
The correct Answer is:B
Step by step video, text & image solution for The graph between the displacement x and time t for a particle moving in a straight line is shown in figure. During the interval OA, AB, BC and CD, the acceleration of the particles is by Physics experts to help you in doubts & scoring excellent marks in Class 11 exams.
Updated on:21/07/2023Topper's Solved these Questions
- MOTION IN A STRAIGHT LINEBOOK - AAKASH SERIESCHAPTER - MOTION IN A STRAIGHT LINEEXERCISE - Exercise 2A
30 Videos
- MOTION IN A STRAIGHT LINEBOOK - AAKASH SERIESCHAPTER - MOTION IN A STRAIGHT LINEEXERCISE - Exercise -2
76 Videos
- MOTION IN A STRAIGHT LINEBOOK - AAKASH SERIESCHAPTER - MOTION IN A STRAIGHT LINEEXERCISE - Problems Based On Calculus
28 Videos
- MOTION IN A PLANE BOOK - AAKASH SERIESCHAPTER - MOTION IN A PLANE EXERCISE - Practice Exercise
84 Videos
- NEWTONS LAWS OF MOTION BOOK - AAKASH SERIESCHAPTER - NEWTONS LAWS OF MOTION EXERCISE - ADDITIONAL PRACTICE EXERCISE PRACTICE SHEET (ADVANECED) (Matrix Matching Type Questions)
1 Videos
Similar Questions
(A): Displacement of a body may be zero when distance travelled by it is not zero.
(R) : The displacement is the longest distance between initial and final positions..
View SolutionA person travels along a straight road for half the distance with velocity V1 and the remaining half distance with velocity V2 the average velocity is given by
View SolutionThe motion of a particle along a straight line is described by the function s=6+4t2−t4
in SI units.Find the velocity ,acceleration ,at t=2s,and the average velocity during 3rd second.
View SolutionA person runs along a circular path of radius 5m. Find the magnitude of the displacement if he runs all the way around the circle ?
View SolutionThe system shown in the figure is given an acceleration 'a' towards left. Assume all contact surfaces to be smooth (m: mass of the sphere) The magnitude of the contact force between wedge and sphere between wedge and sphere at A is xmg√3 then 'x' is

View SolutionDisplacement-time graph of a particle moving in a straight line is as shown in figure.

(a) Find the sign of velocity in regions oa,ab, bc and cd.
(b) Find the sign of acceleration in the above region.
View SolutionThe x-t graph of a particle moving along a straight line is shown in figure The a-t graph of the particle is correctly shown by
View SolutionThe x-t graph of a particle moving along a straight line is shown in figure

The speed-time graph of the particle is correctly shown by
View SolutionThe x-t graph of particle moving along a straight line is shown in figure The v-t graph of the particles is correctly shown by
View SolutionThe x-t graph of particle moving along a straight line is shown in figure The a-t graph of the particle is correctly shown by
View SolutionThe graph between the displacement x and time t for a particle moving in a straight line is shown in the figure. During the interval OA, AB, BC and CD the acceleration of the particle is OA, AB, BC, CD
View SolutionDisplacement time graph of a particle moving in a straight line is a shown in figure.
View SolutionThe velocity -time (v - t) graph of a particle moving in a straight line is shown in figure. The acceleration of the particle at t = 9 is:
View SolutionDisplacement-time graph of a particle moving in a straight line is as shown in figure. s t a o b c

Q. Find the sign of velocity in regions oa, ab, bc and cd
View Solutionएक सरल रेखा में गति करते हुए कण का विस्थापन-समय ग्राफ चित्र में दर्शाया गया है।

इस कण का त्वरण-समय ग्राफ है
View SolutionThe graph between the displacement x and time t for a particle moving in a straight line is shown in figure. During the interval OA, AB, BC and CD, the acceleration of the particles is
View Solution
