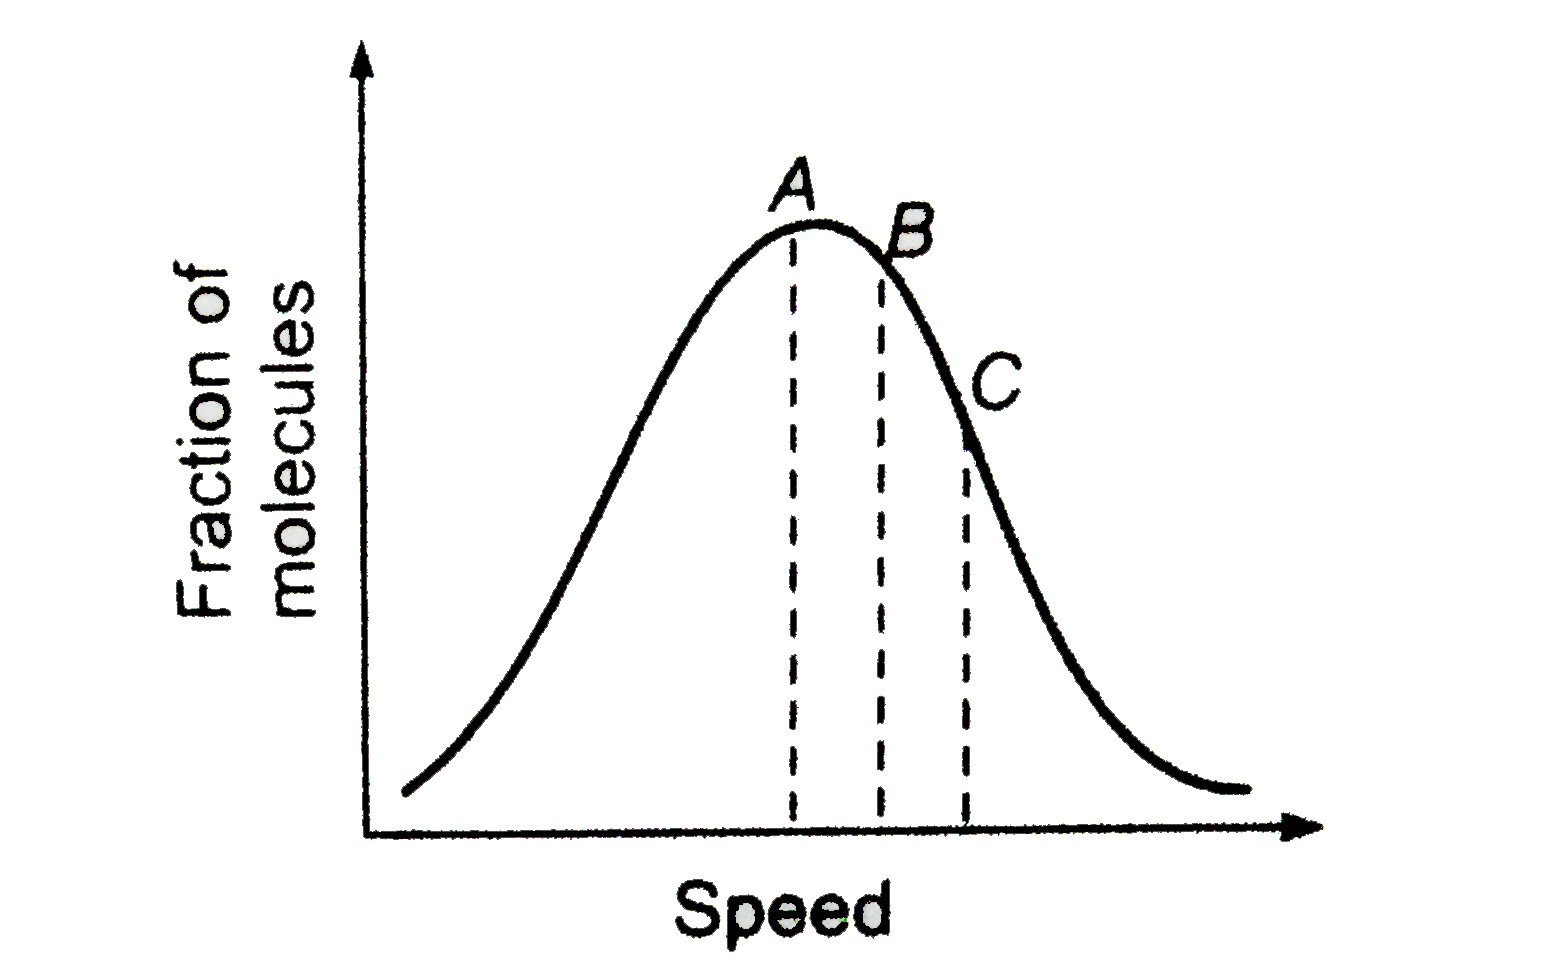
At a definit temperature (T), the distribution of speeds is given by the curve. In the curve points A, B and C indicates the speeds corresponding to :

most probable, average and root mean square speeds
average, root mean square and most probable speeds
root mean square, average and most probable speeds
most probable, root mean square and average speeds
The correct Answer is:a
(a) Urms=√2RTM Uavg=√8πRTM Ump=√2RTM
Urms1.224 : Uavg1.128 : Ump1
Urms>Uavg>Ump
Topper's Solved these Questions
- GASEOUS STATEBOOK - NARENDRA AWASTHI ENGLISHCHAPTER - GASEOUS STATEEXERCISE - Level 2
30 Videos
- GASEOUS STATEBOOK - NARENDRA AWASTHI ENGLISHCHAPTER - GASEOUS STATEEXERCISE - Level 3 Passage 1
4 Videos
- ELECTROCHEMISTRYBOOK - NARENDRA AWASTHI ENGLISHCHAPTER - ELECTROCHEMISTRYEXERCISE - Subjective problems
14 Videos
- IONIC EEQUILIBRIUMBOOK - NARENDRA AWASTHI ENGLISHCHAPTER - IONIC EEQUILIBRIUMEXERCISE - Subjective problems
1 Videos
Similar Questions
State Stefan's law. Sketch graphs showing the distribution of energy in the spectrum of black body radiation at three temperatures, and indicate which curve corresponds to the highest temperature.
View SolutionExplain Maxwell's distribution of speeds. What is the the effect of temperature on most probable speed ?
View Solution
Knowledge Check
Assertion : In Maxwell - Boltzmann distribution of speeds , the curve broadens at higher temperature .
Reason : At a particular temperature , the individual speed of molecules as well as the distribution of speeds remains the same .AIf both assertion and reason are true and reason is the correct explanation of assertion .BIf both assertion and reason are true but reason is not the correct explanation of assertion .CIf assertion is true but reason is false .DIf both assertion and reason are false .
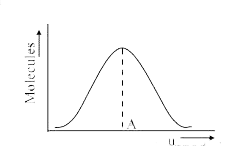
Distribution of molecules with velocity is represented by the curve as shown, velocity at point A is :

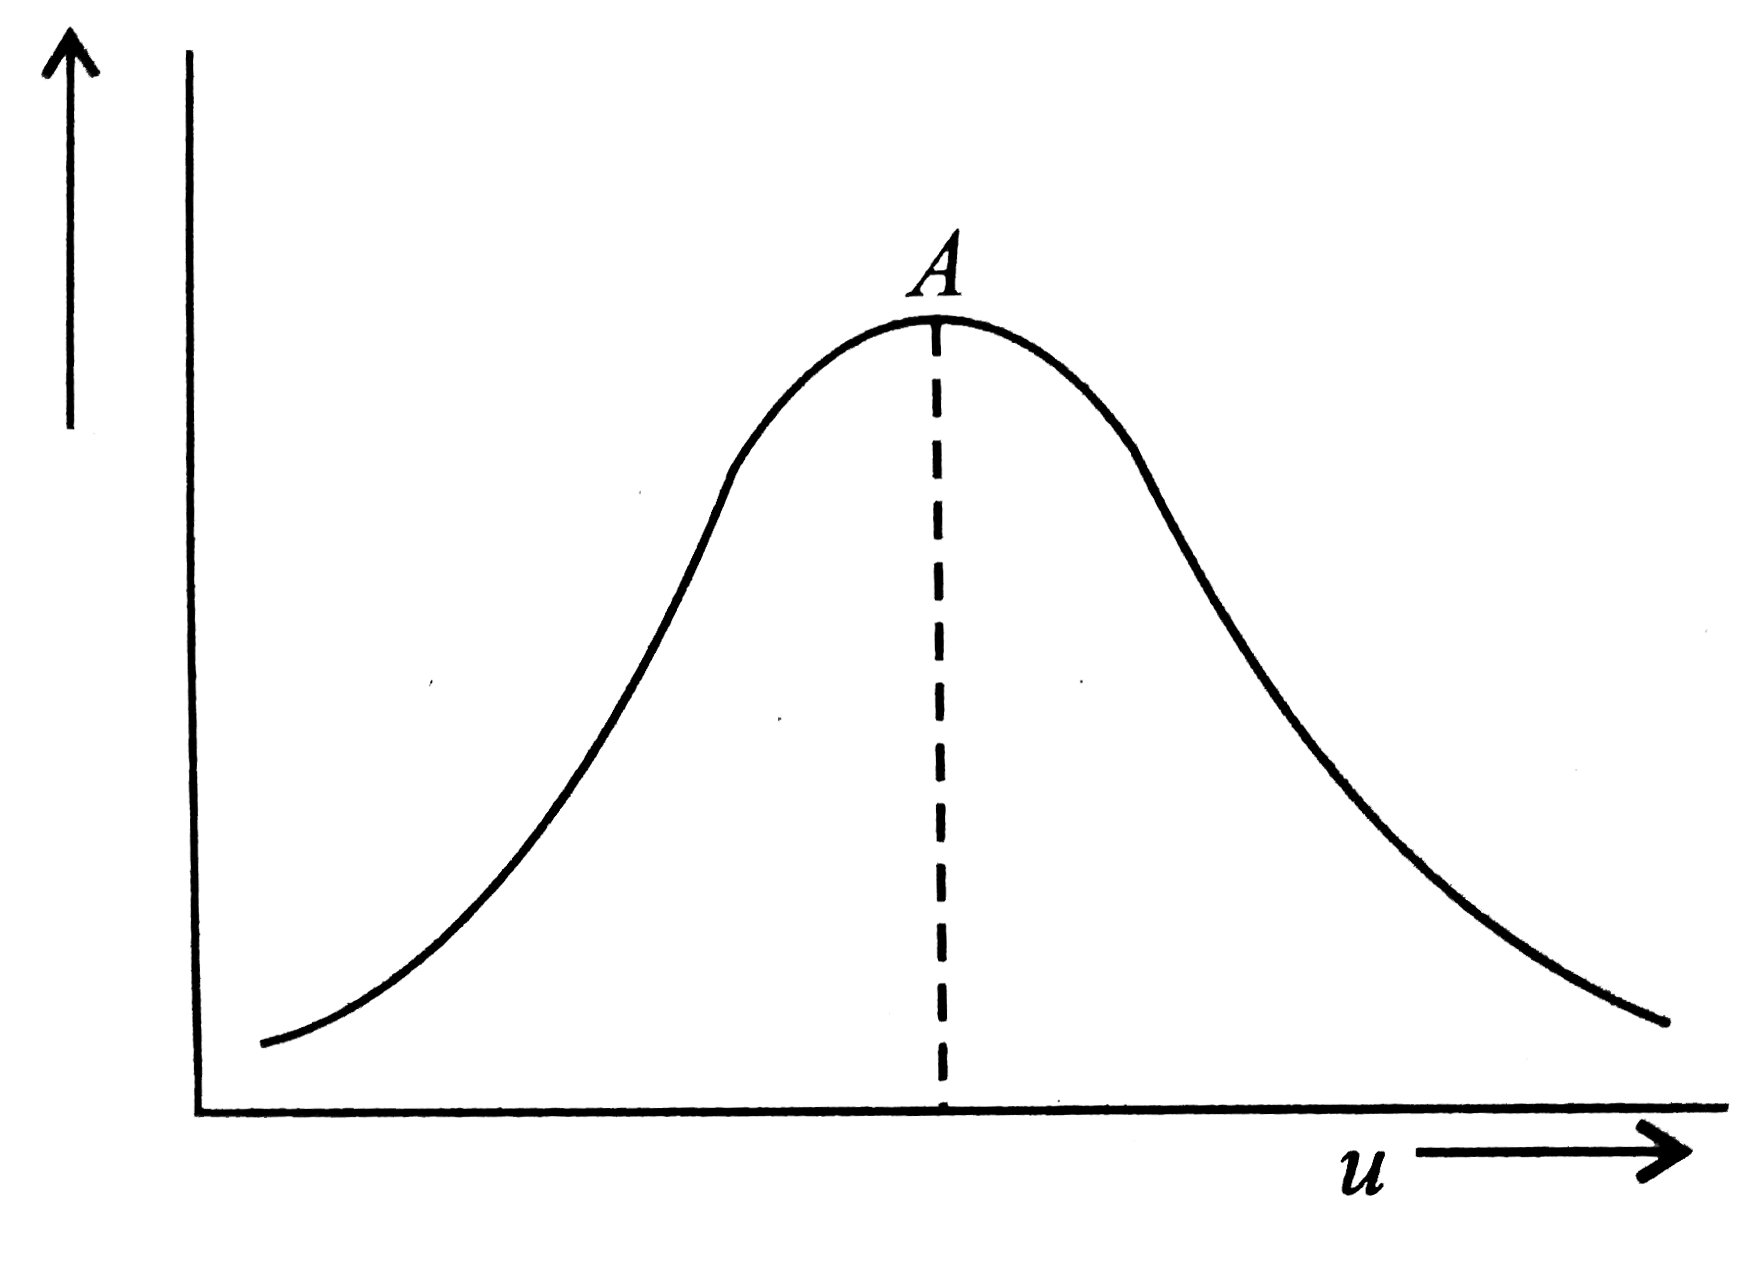
View SolutionDistribution of molecules with velocity is represented by the curve

Velocity corresponding to point A is
View SolutionFind the equation of tangent of the curve x=at2,y=2at at point 't'.
View SolutionThe effect of temperature on Maxwell's speed distribution is correctly shown by
View SolutionThe curve is given by x=cos2t,y=sint represents
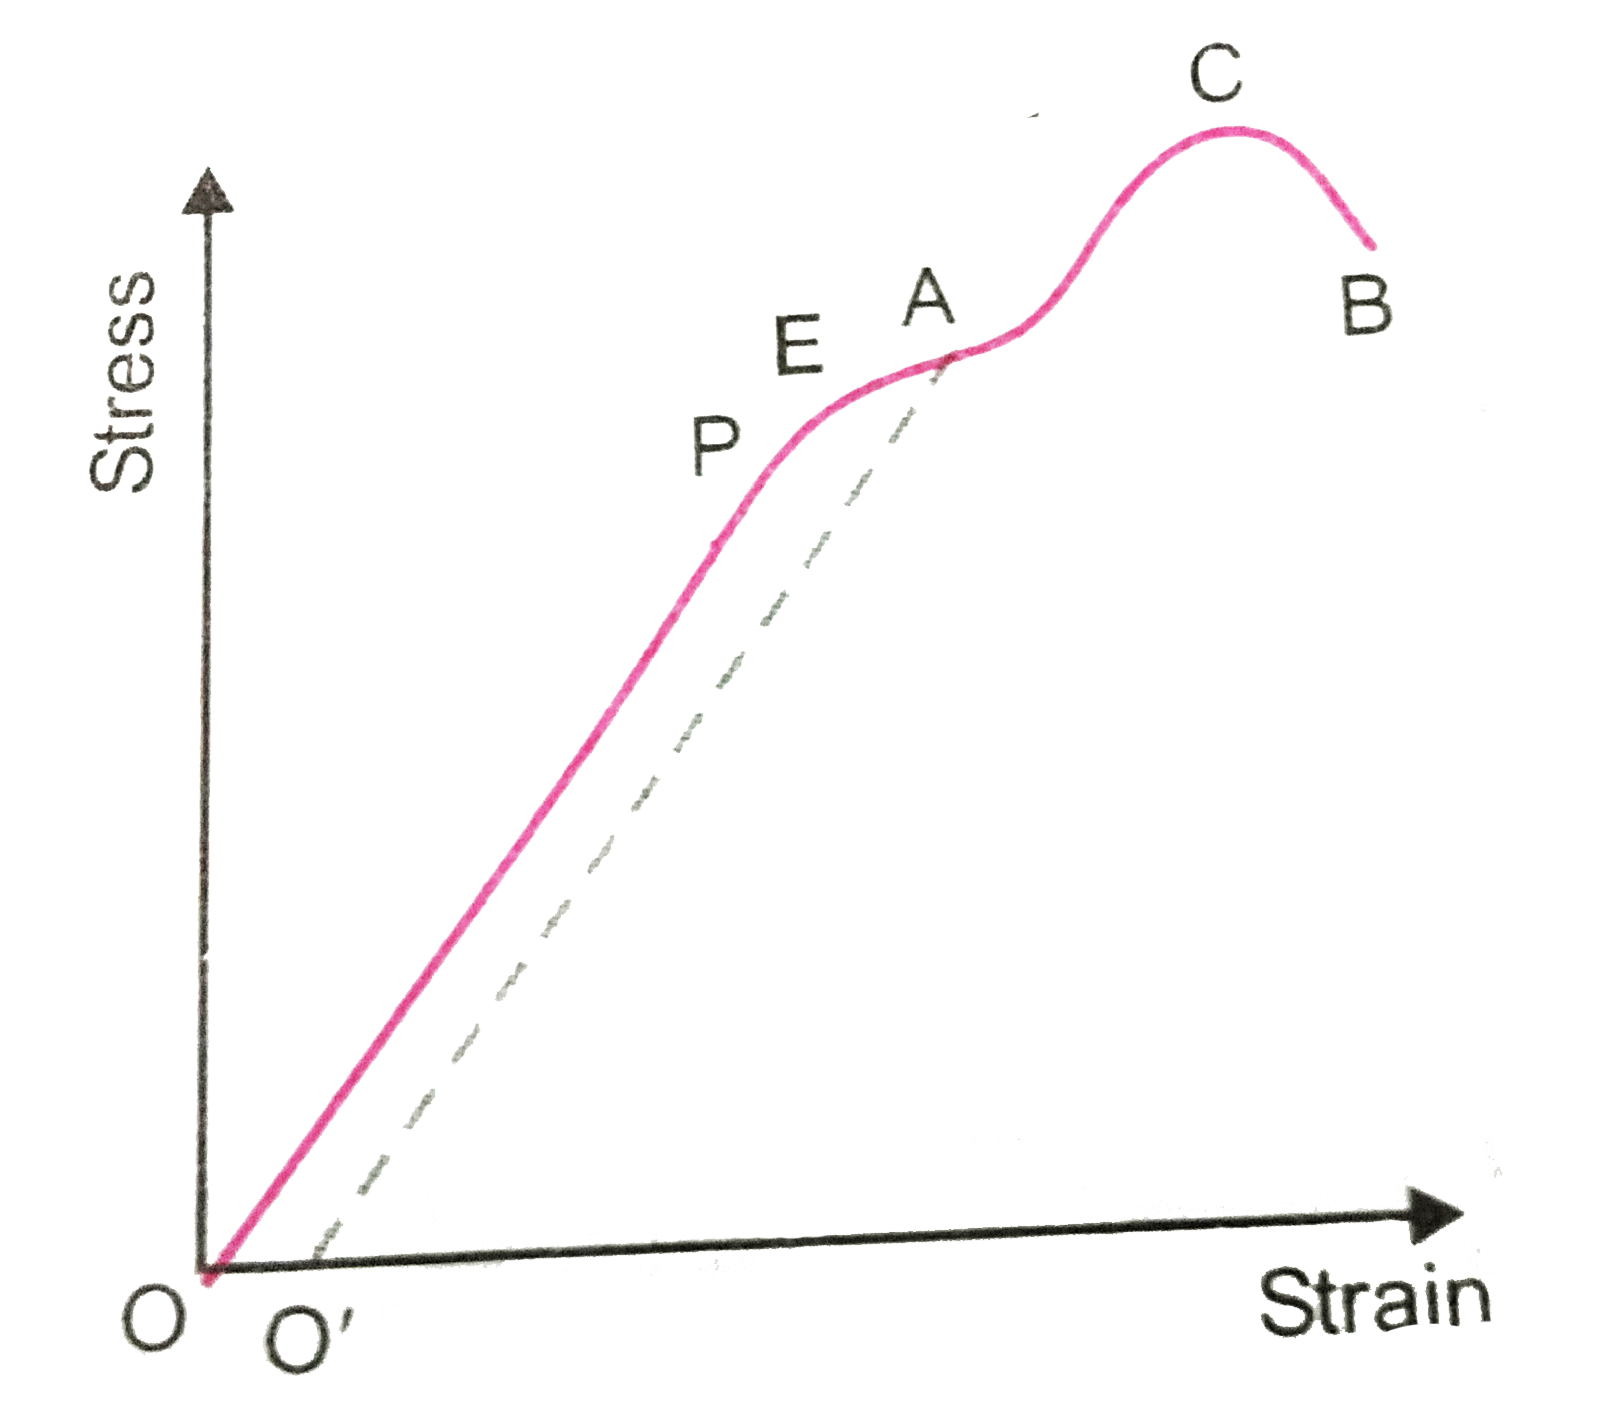
View SolutionThe stress strain graph for a metal wire is shown in the fig. Up to the point E, the wire returns to its original state O along the curve EPO, when it is gradually unloaded. Point B corresponds to the fracture of the wire.

(a) Up to what point on the curve is Hooke's law obeyed? (this point some times called proportional limits).
(b) Which point on the curve corresponding to elastic limit or yield point of the wire?
(c ) Indicate the elastic and plastic regions of the stress-strain graph.
(d) Describe what happens when the wire is loaded up to a stress corresponding to the point A on the graph and then unloaded gradually. In particular explain the dotted curve.
(e) What is peculiar about the portion of the stress- strain graph from C to B? Up to what stress can the wire be subjected without causing fracture?
View SolutionThe equation(s) of the tangent(s) to the curve y=x4 from the point (2, 0) not on the curve is given by
View Solution
