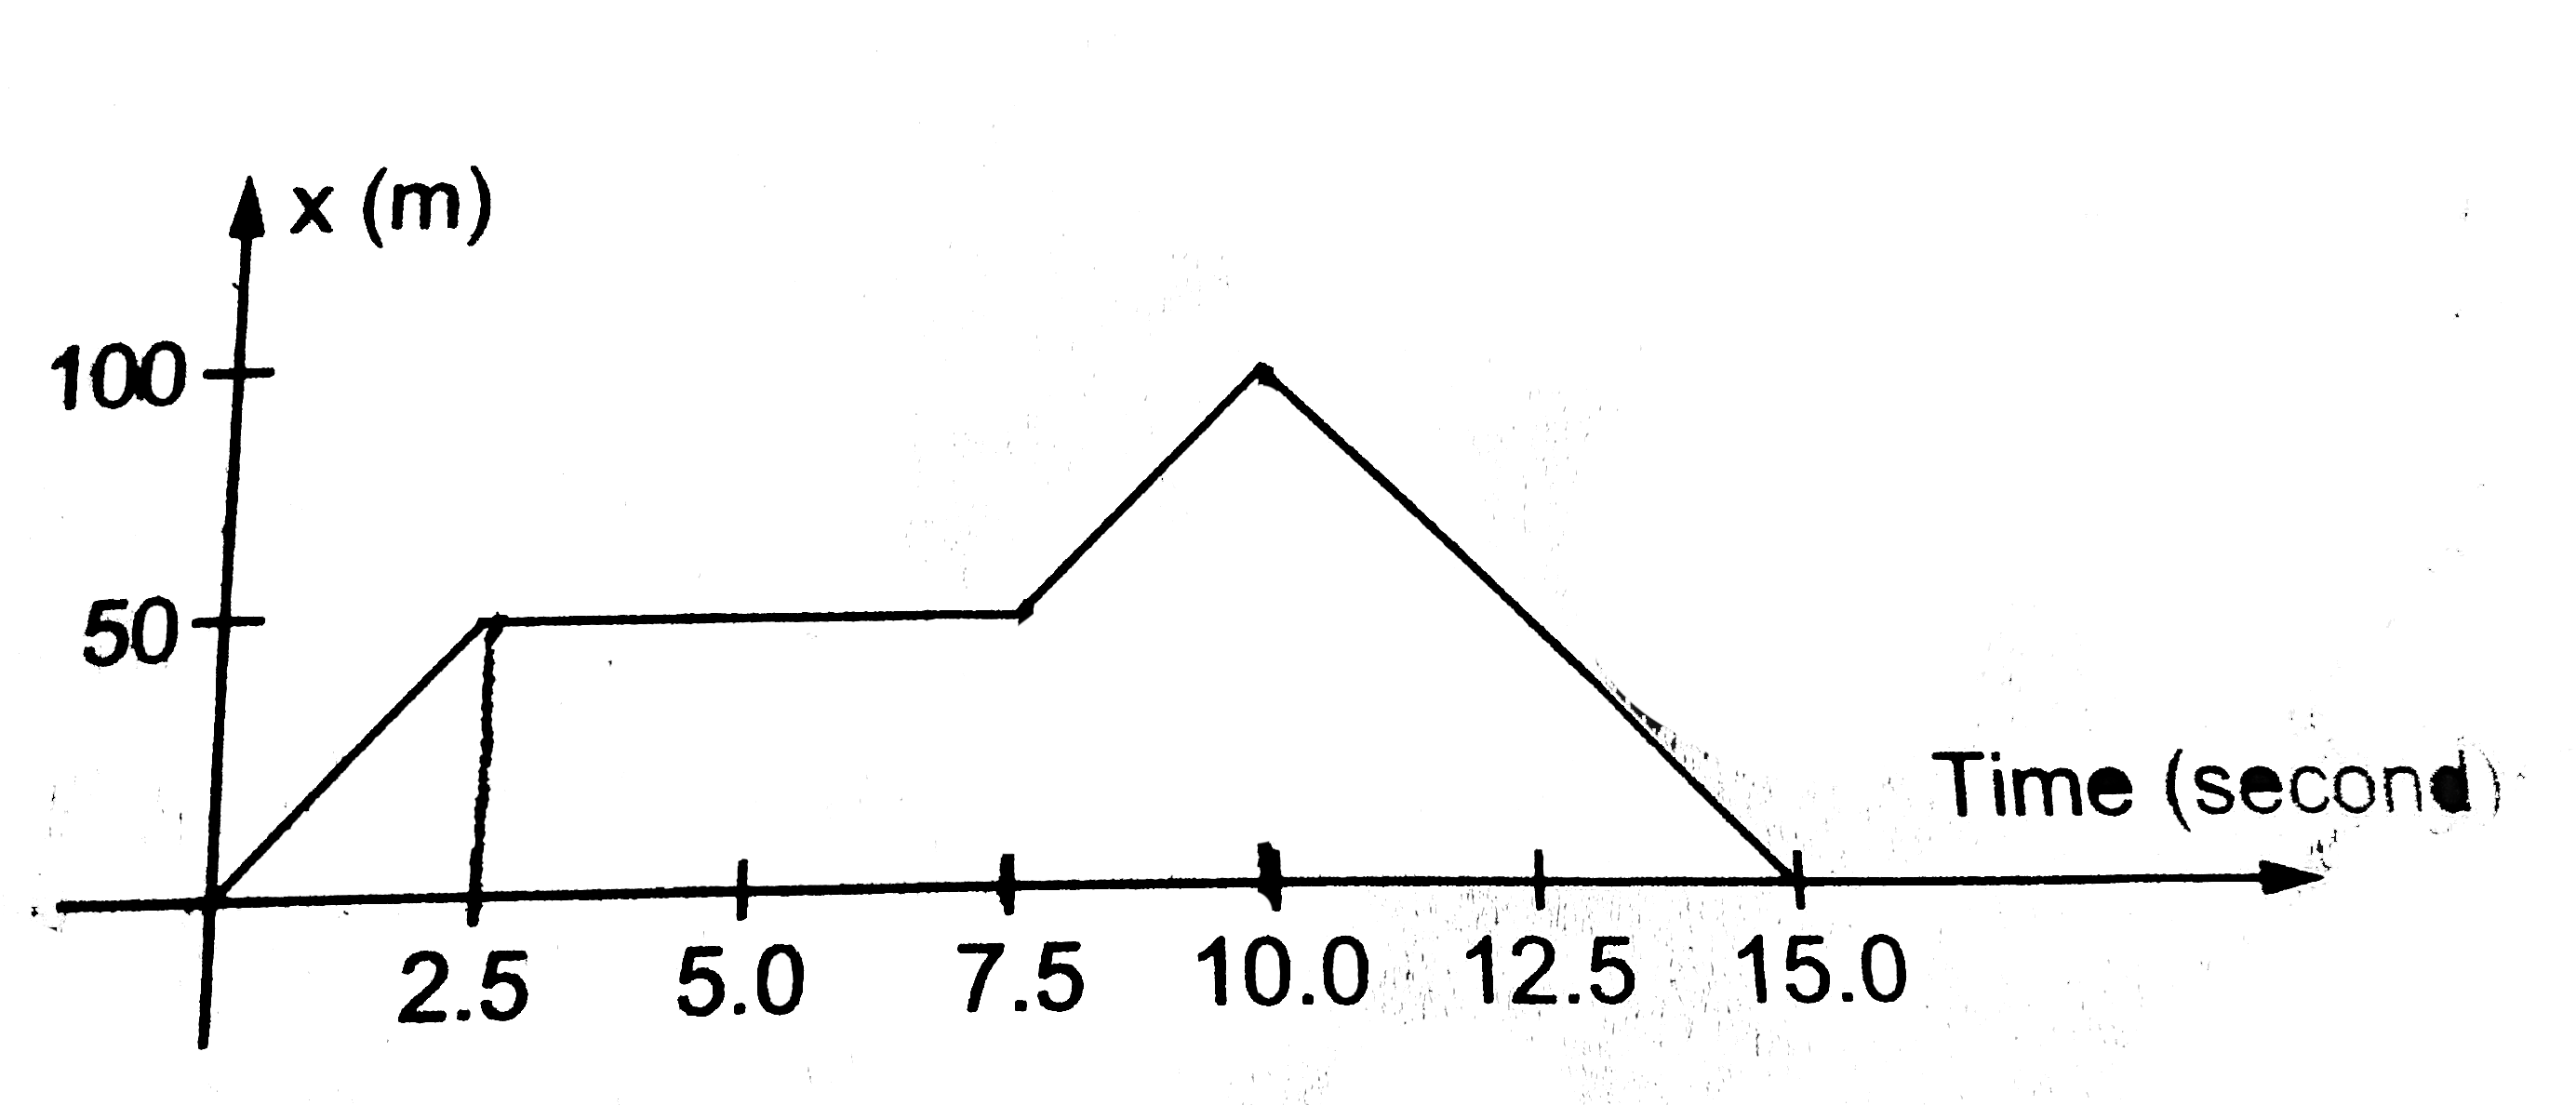
Figure shows the graph of the x-coordinaste of a particle going along the X-axis as a function of time.Find a. te average velocity during 0 to 10s, b. instantaneous velocity at 2,5,8 and 12s.
The correct Answer is:A, B
a. Displacement in 0 to 10 sec is 100 m
time = 10 sec
Vav=St=10010=10ms<br><imga≤ocr_imageload∈g=lazysrc=https://d10lpgp6xz60nq.cloudfront.net/physics_images/HCV_VOL1_C03_E01_046_S01.pngwh=80%mx-autosty≤=background:white;><br>b.Uniformvelocityatwhichitismovkngat2.5sec<br>=50/2.5=20 m/s
At 2.5 sec
V_(inst)= 20 m/s
At 5 sec
velocity is -ve as it moves towards position. V_(inst)=-20 m/s
Topper's Solved these Questions
- REST AND MOTION : KINEMATICSBook:HC VERMA ENGLISHChapter:REST AND MOTION : KINEMATICSExercise:Question for short Answer
Explore 13 Videos
- REST AND MOTION : KINEMATICSBook:HC VERMA ENGLISHChapter:REST AND MOTION : KINEMATICSExercise:Objective -2
Explore 9 Videos
- PHYSICS AND MATHEMATICSBook:HC VERMA ENGLISHChapter:PHYSICS AND MATHEMATICSExercise:Question for short Answer
Explore 14 Videos
- ROTATIONAL MECHANICSBook:HC VERMA ENGLISHChapter:ROTATIONAL MECHANICSExercise:Questions for short Answer
Explore 21 Videos
Similar Questions
Fig. shows the graph of the x-coordinate of a particle going along the x-axis as a function of time. Find (a) the average velocity during 0 to 10s, (b) instantaneous velocity at 2, 5, 8 and 12s.
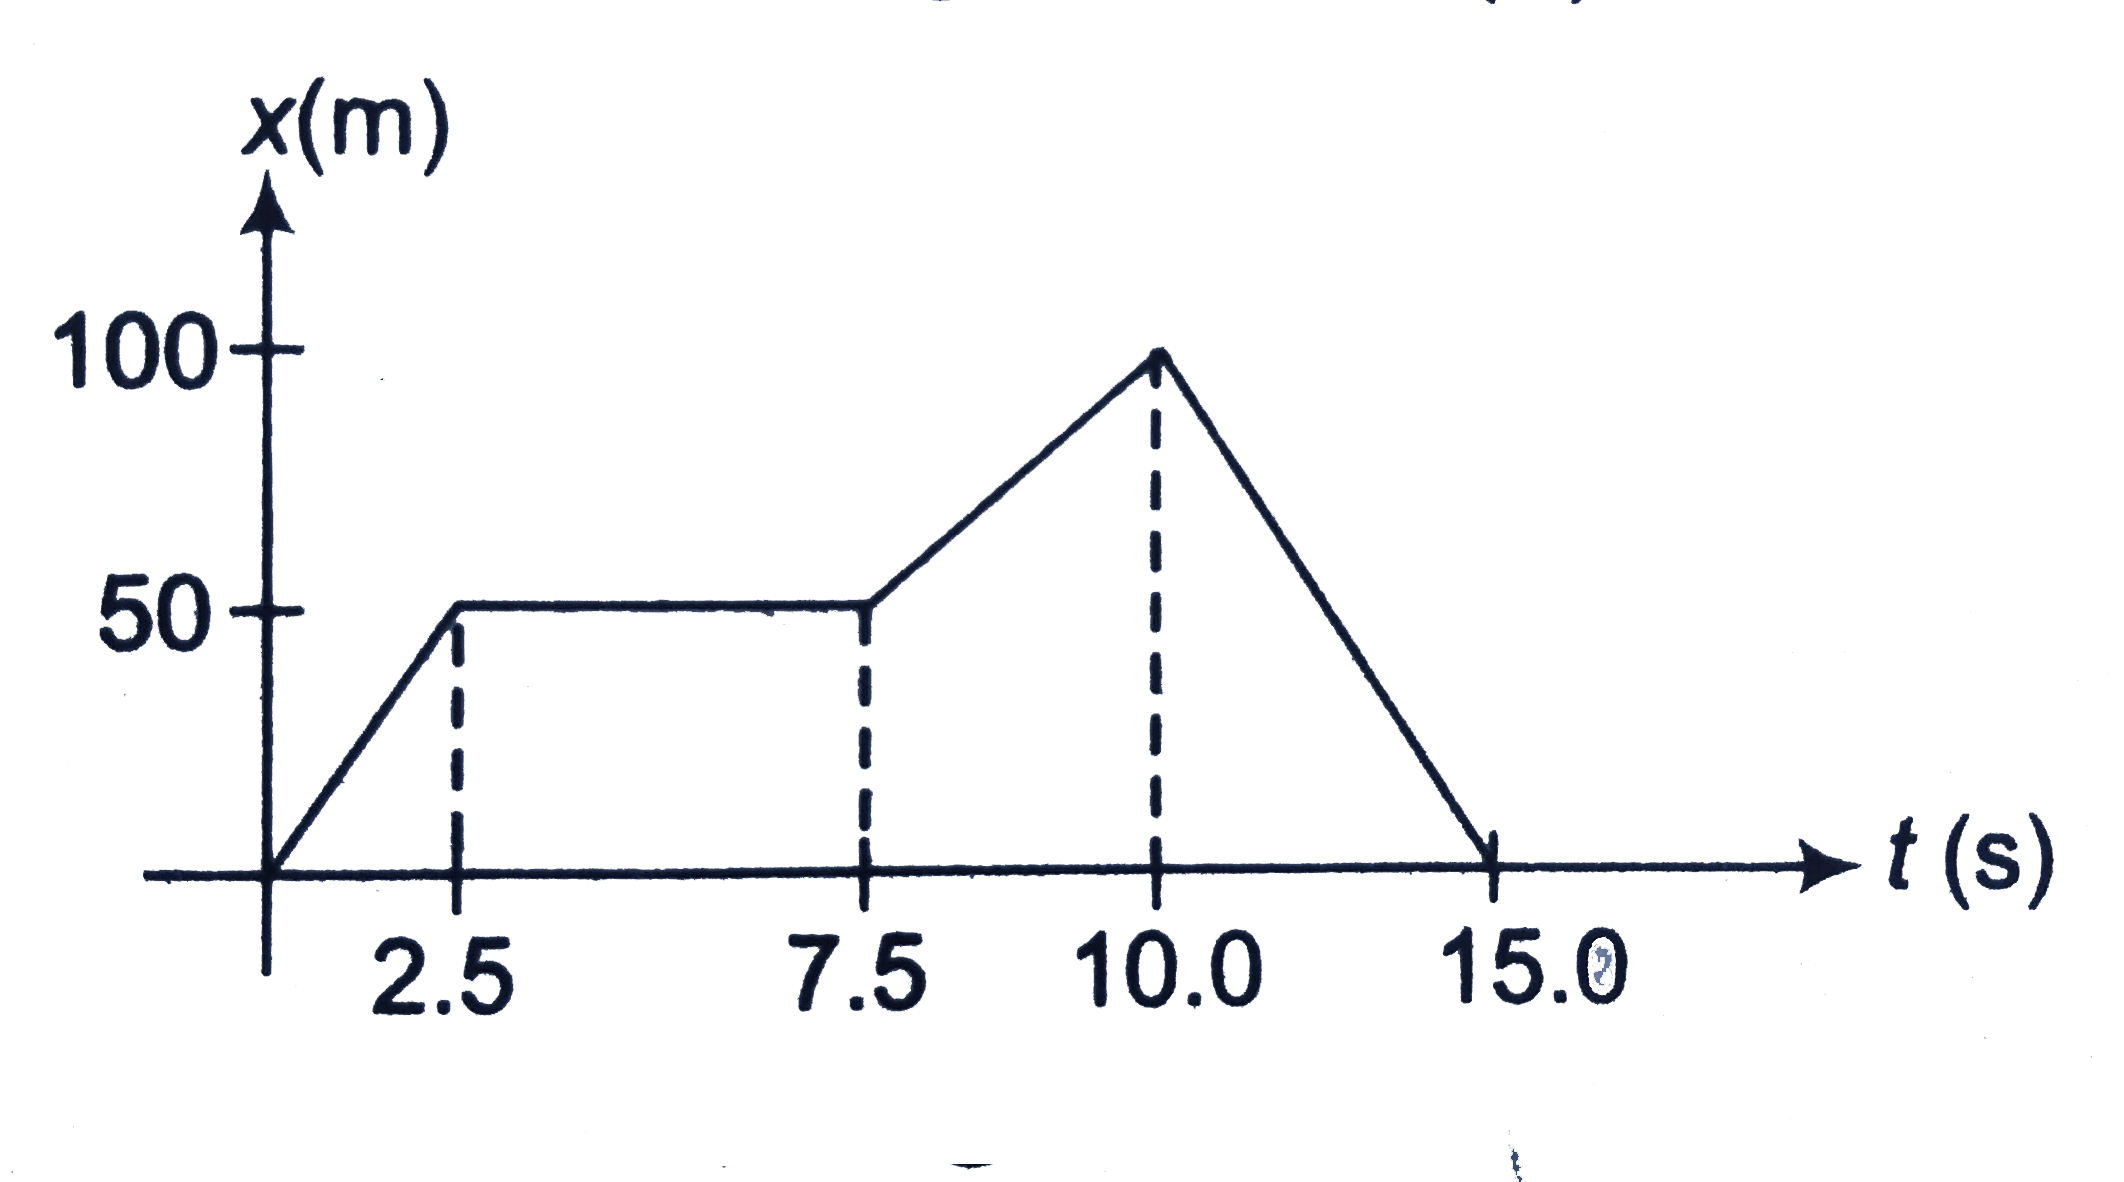
View SolutionFigure shows the graph of x-coordinate of a particle moving along x-axis as a function of time. Average velocity during t = 0 to 4 s and instantaneous velocity at t = 4.113 s respectively will be
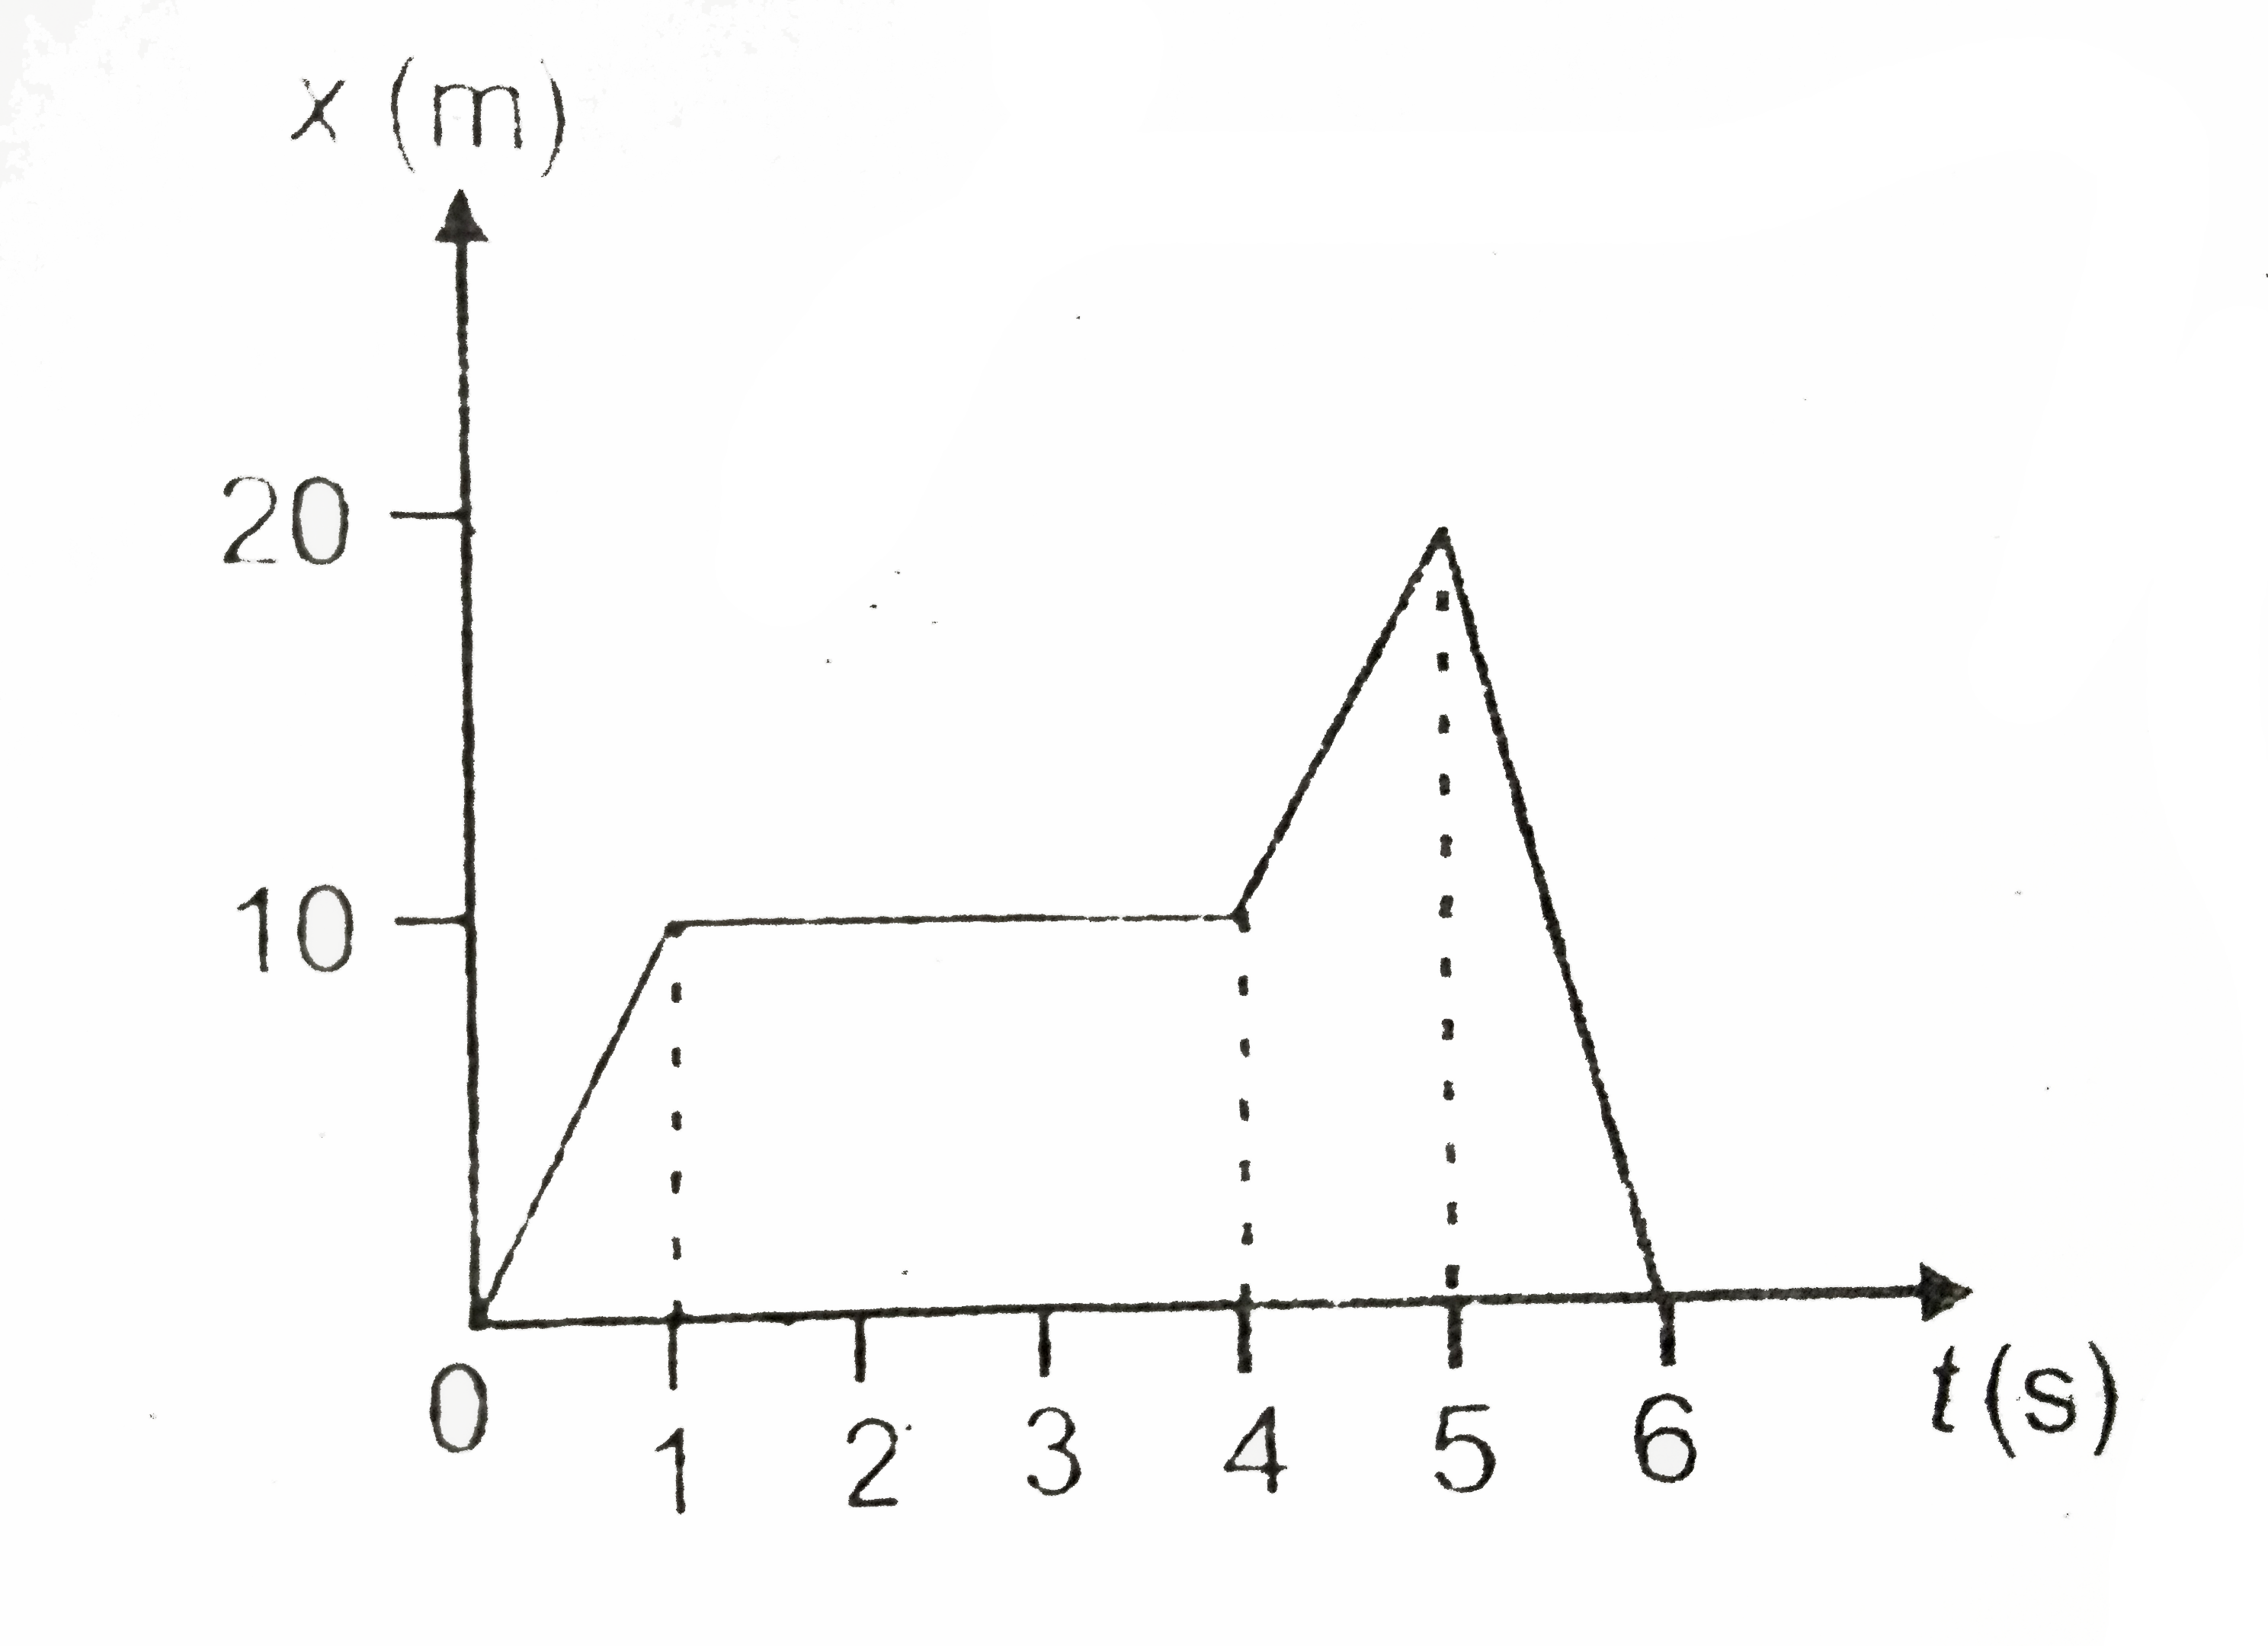
View SolutionFigure shows the graph of x - coordinate of a particle moving along x - axis as a function of time. Average velocity during t = 0 to 6 s and instantaneous velocity at t = 3 s respectively, will be
View SolutionFigure shows the displacement of a particle going along the X-axis as a function of time. The force acting on the particle is zero in the region

View SolutionFigure shows the velocity time graph of a particle moving along straight line (v is m/s and t is in second). It average velocity in 20 seconds will be:
 .
.
View Solutionfigure
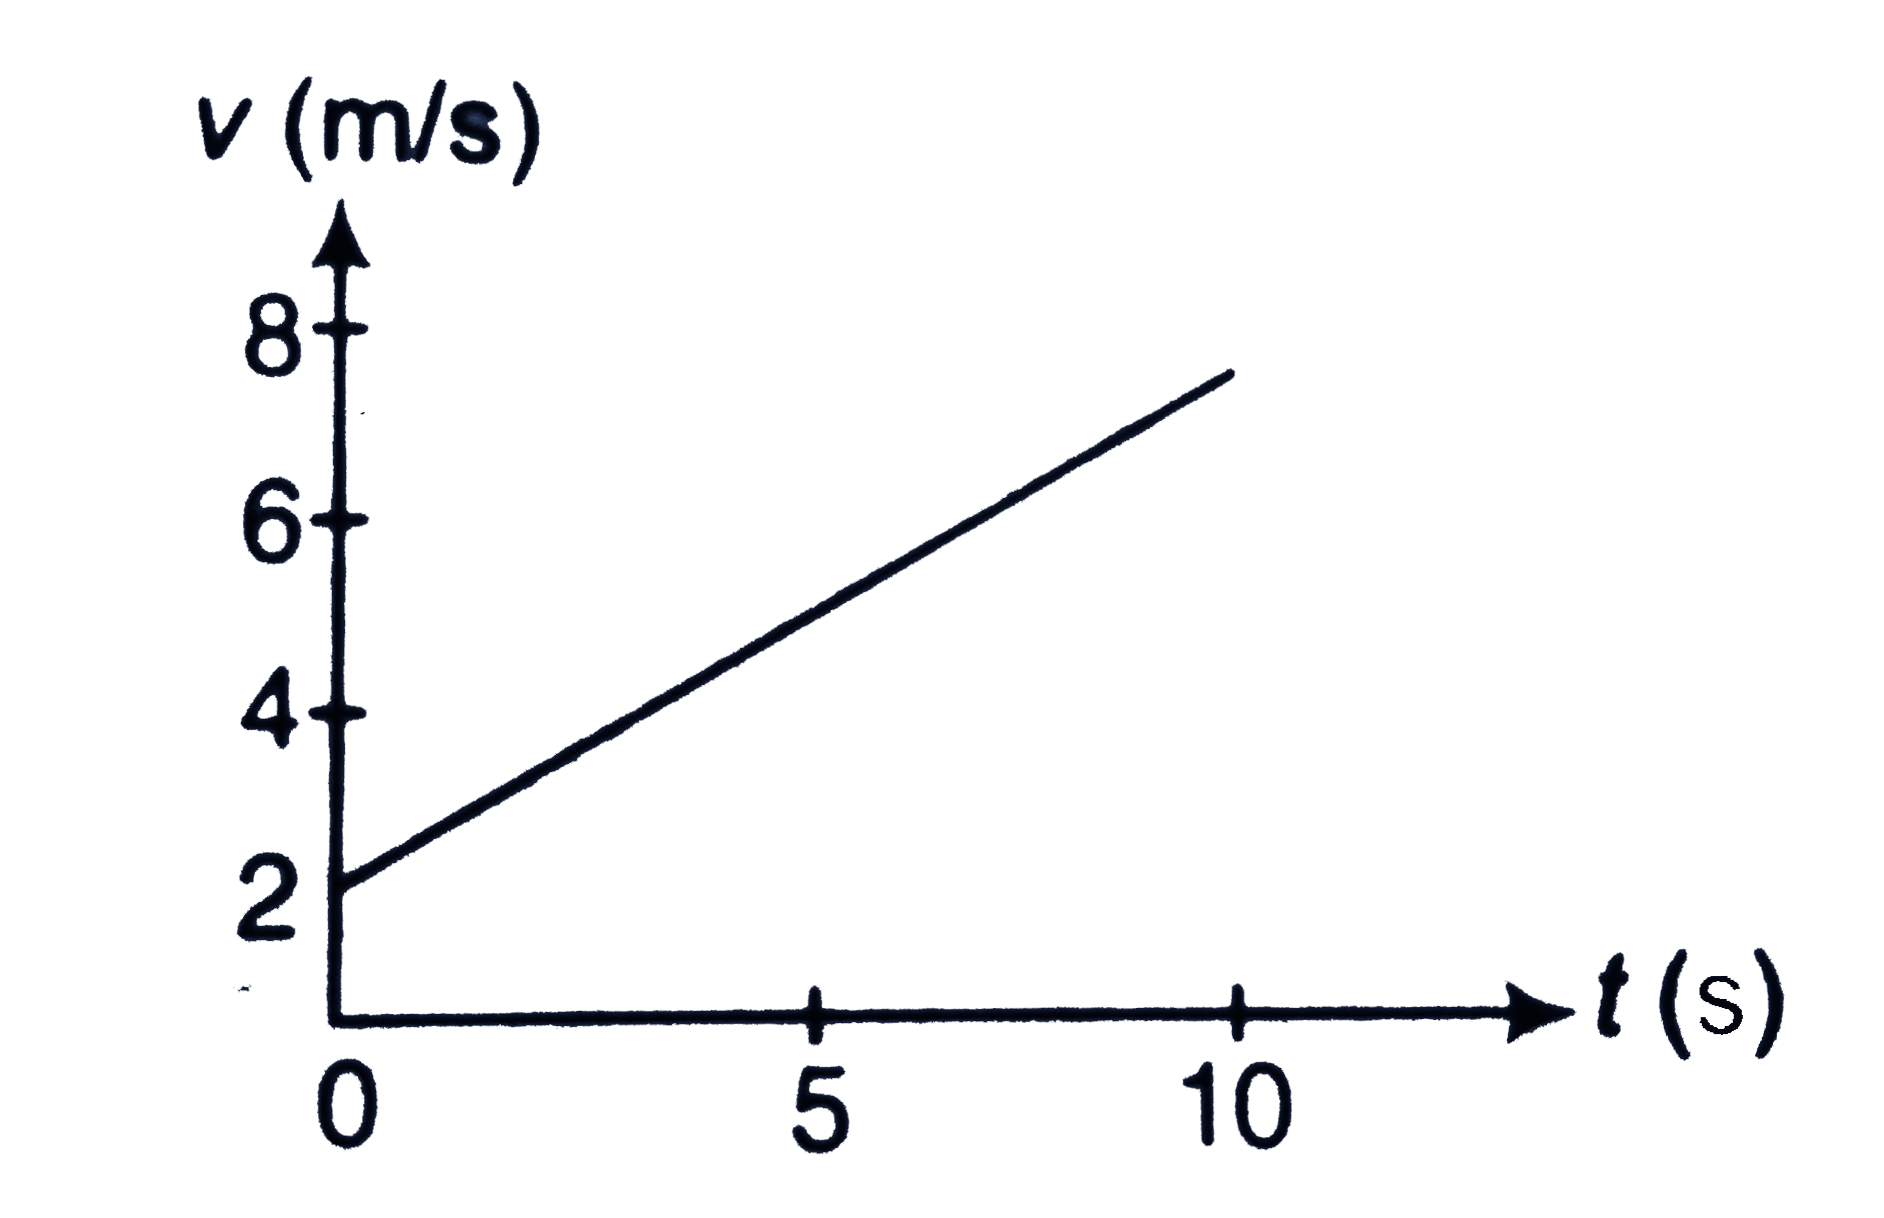
 shows the graph of velocity versus tie for a particle going along the X-axis. Find a. the acceleration, b. The distance travelled in 0 to 10 s and c. the displacement in 0 to 10 s.
View SolutionFig. shows the graph of velocity versus time for a particle going along the x-axis. Find (a) acceleration, (b) the distance traveled in 0→10s and (c) the displacement in 0 to 10s.
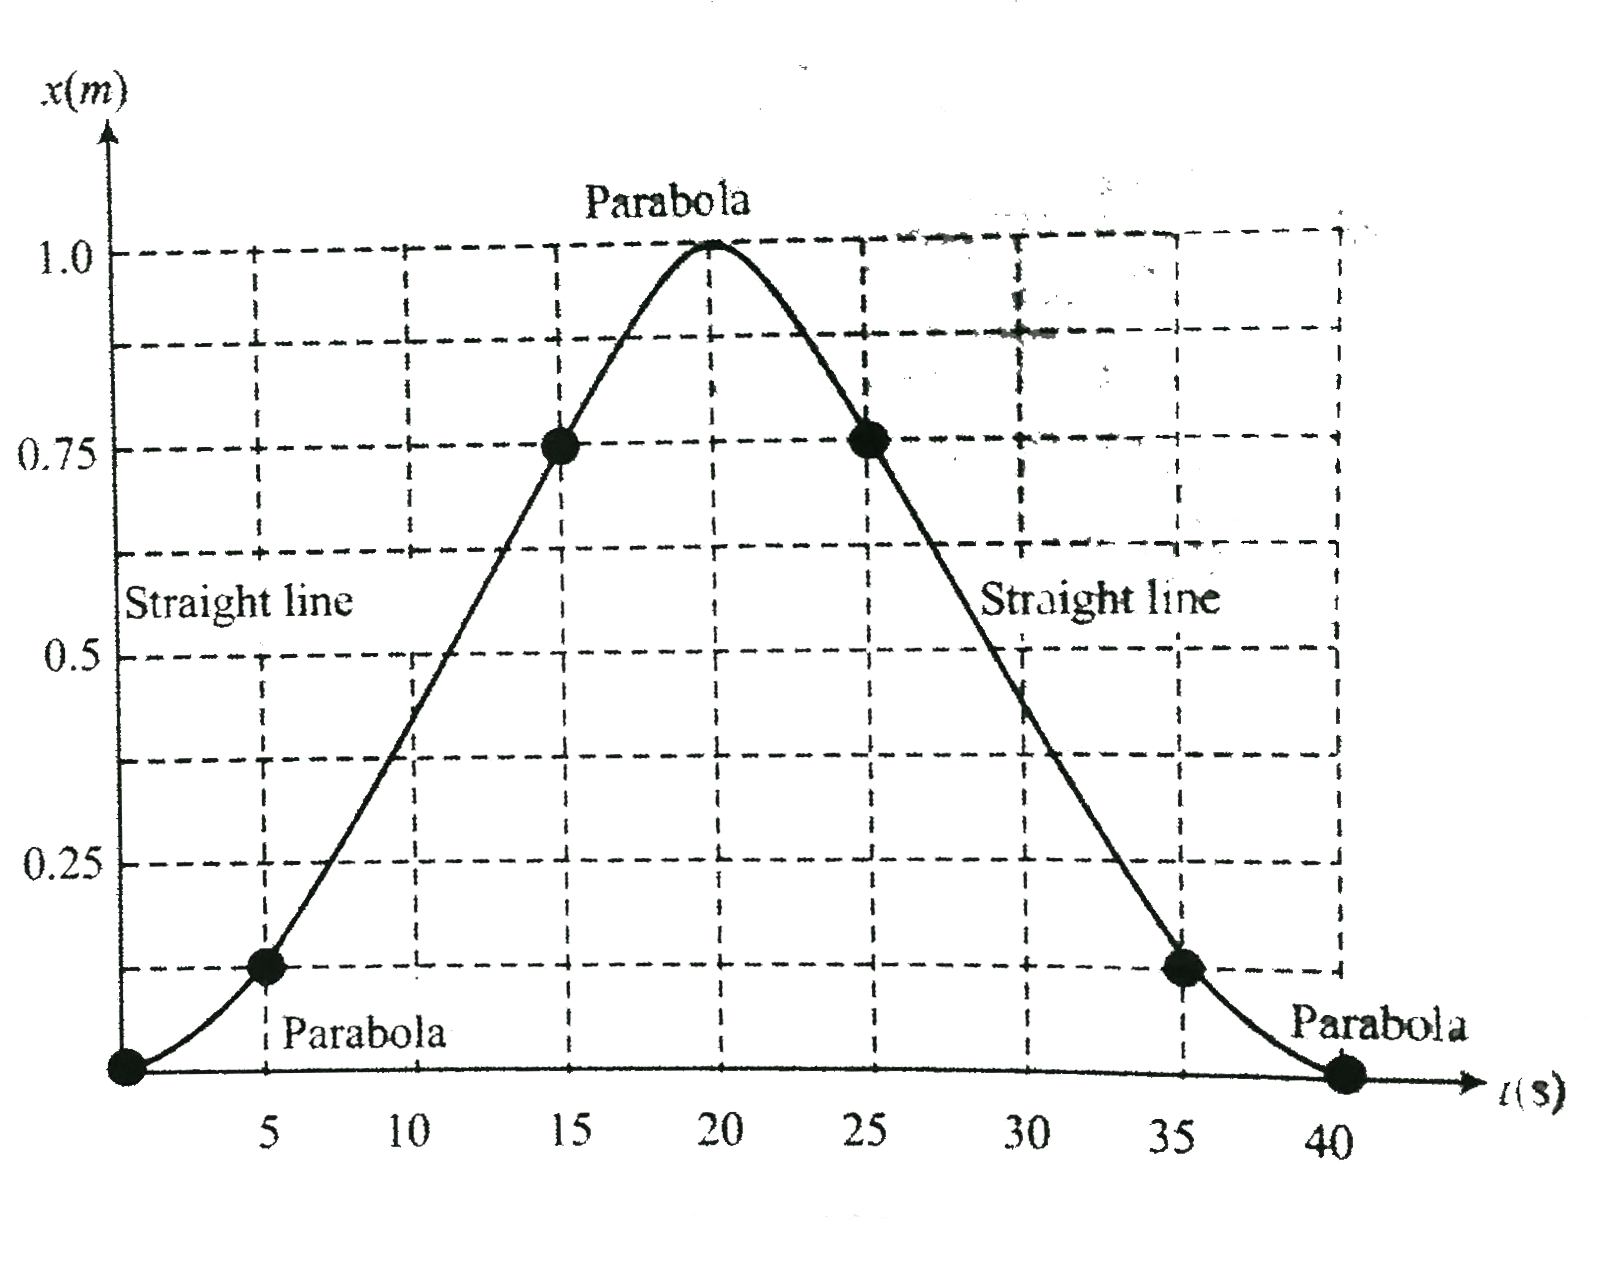
View SolutionFigure is a graph of the coordinate of a spider crawling along the x-axis. (a) Fraph tis velocity and acceleration as functionsof time. (b) In a motion diagram, show the position, velocity, and acceleration of the spider at the five times: t=2.5s, t=10 s, t=20 s, t=30 s,
 .
.
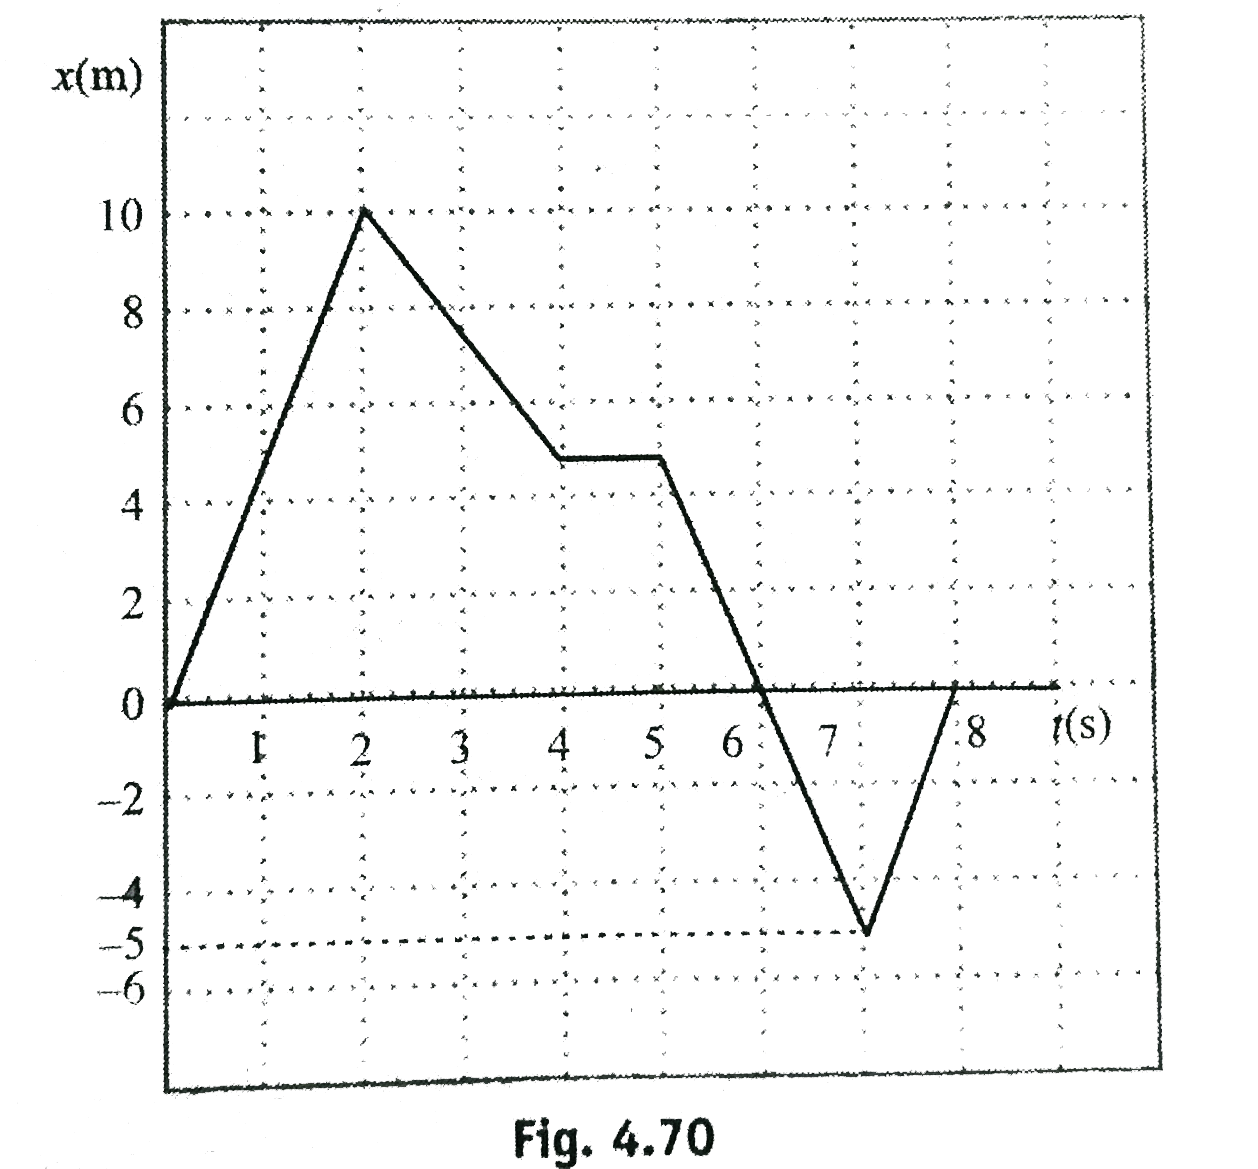
View SolutionThe position verus time graph time graph for a certain particle moving along the x-axis is shown in . Find the average velocity in the time intervals (a) 0 to 2s, (b) 2s to 4s, and (c) 4,s to 7s,
 .
.
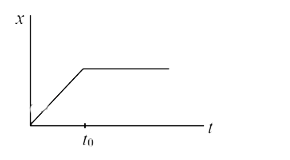
View SolutionFigure shows the position-time graph of a particle moving on the X--axis. Which of these option correctly describes the particle 's motion?
View Solution

