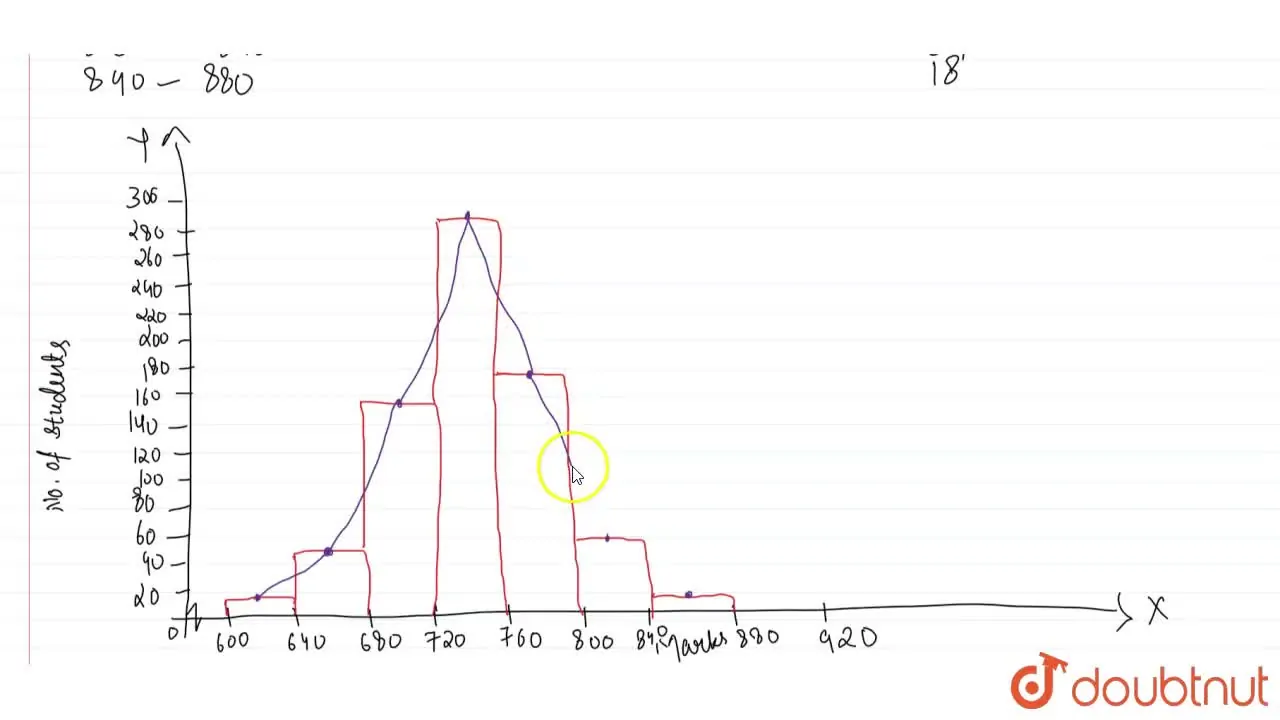
The marks scored by 750 students in an examination are given in the form of a frequency distribution table. Marks 600-640 640-680 680-720 720-760 760-800 800-840 840-880 No. of Students: 16 45 156 284 172 59 18 Represent this data in the form of a histogram and construct a frequency polygon.
Step by step video & image solution for The marks scored by 750 students in an examination are given in the form of a frequency distribution table. Marks 600-640 640-680 680-720 720-760 760-800 800-840 840-880 No. of Students: 16 45 156 284 172 59 18 Represent this data in the form of a histogram and construct a frequency polygon. by Maths experts to help you in doubts & scoring excellent marks in Class 9 exams.
Related Playlists
Similar Questions
The marks scored by 750 students in an examination are given in the form of a frequency distribution table.
.Marks 600−640,640−680,680−720and720−760,760−800,800−840,840−880
N⊙ofStudents:16451562841725918 Represent this data in the form of a histogram and construct a frequency polygon.View SolutionThe marks scored by 750 students in an examination are given in the form of a frequency distribution table: Marks No. of students Marks No. of students 600-640 16 760-800 172 640-680 45 800-840 59 680-720 156 840-880 18 720-760 284 Prepare a cumulative frequency table by less than method and draw an ogive.
View SolutionThe following table gives the marks scored by 100 students in an entrance examination. Marks: 0-10 10-20 20-30 30-40 40-50 50-60 60-70 70-80 No. of Students (Frequency): 4 10 16 22 20 18 8 2 Represent this data in the form of a histogram.
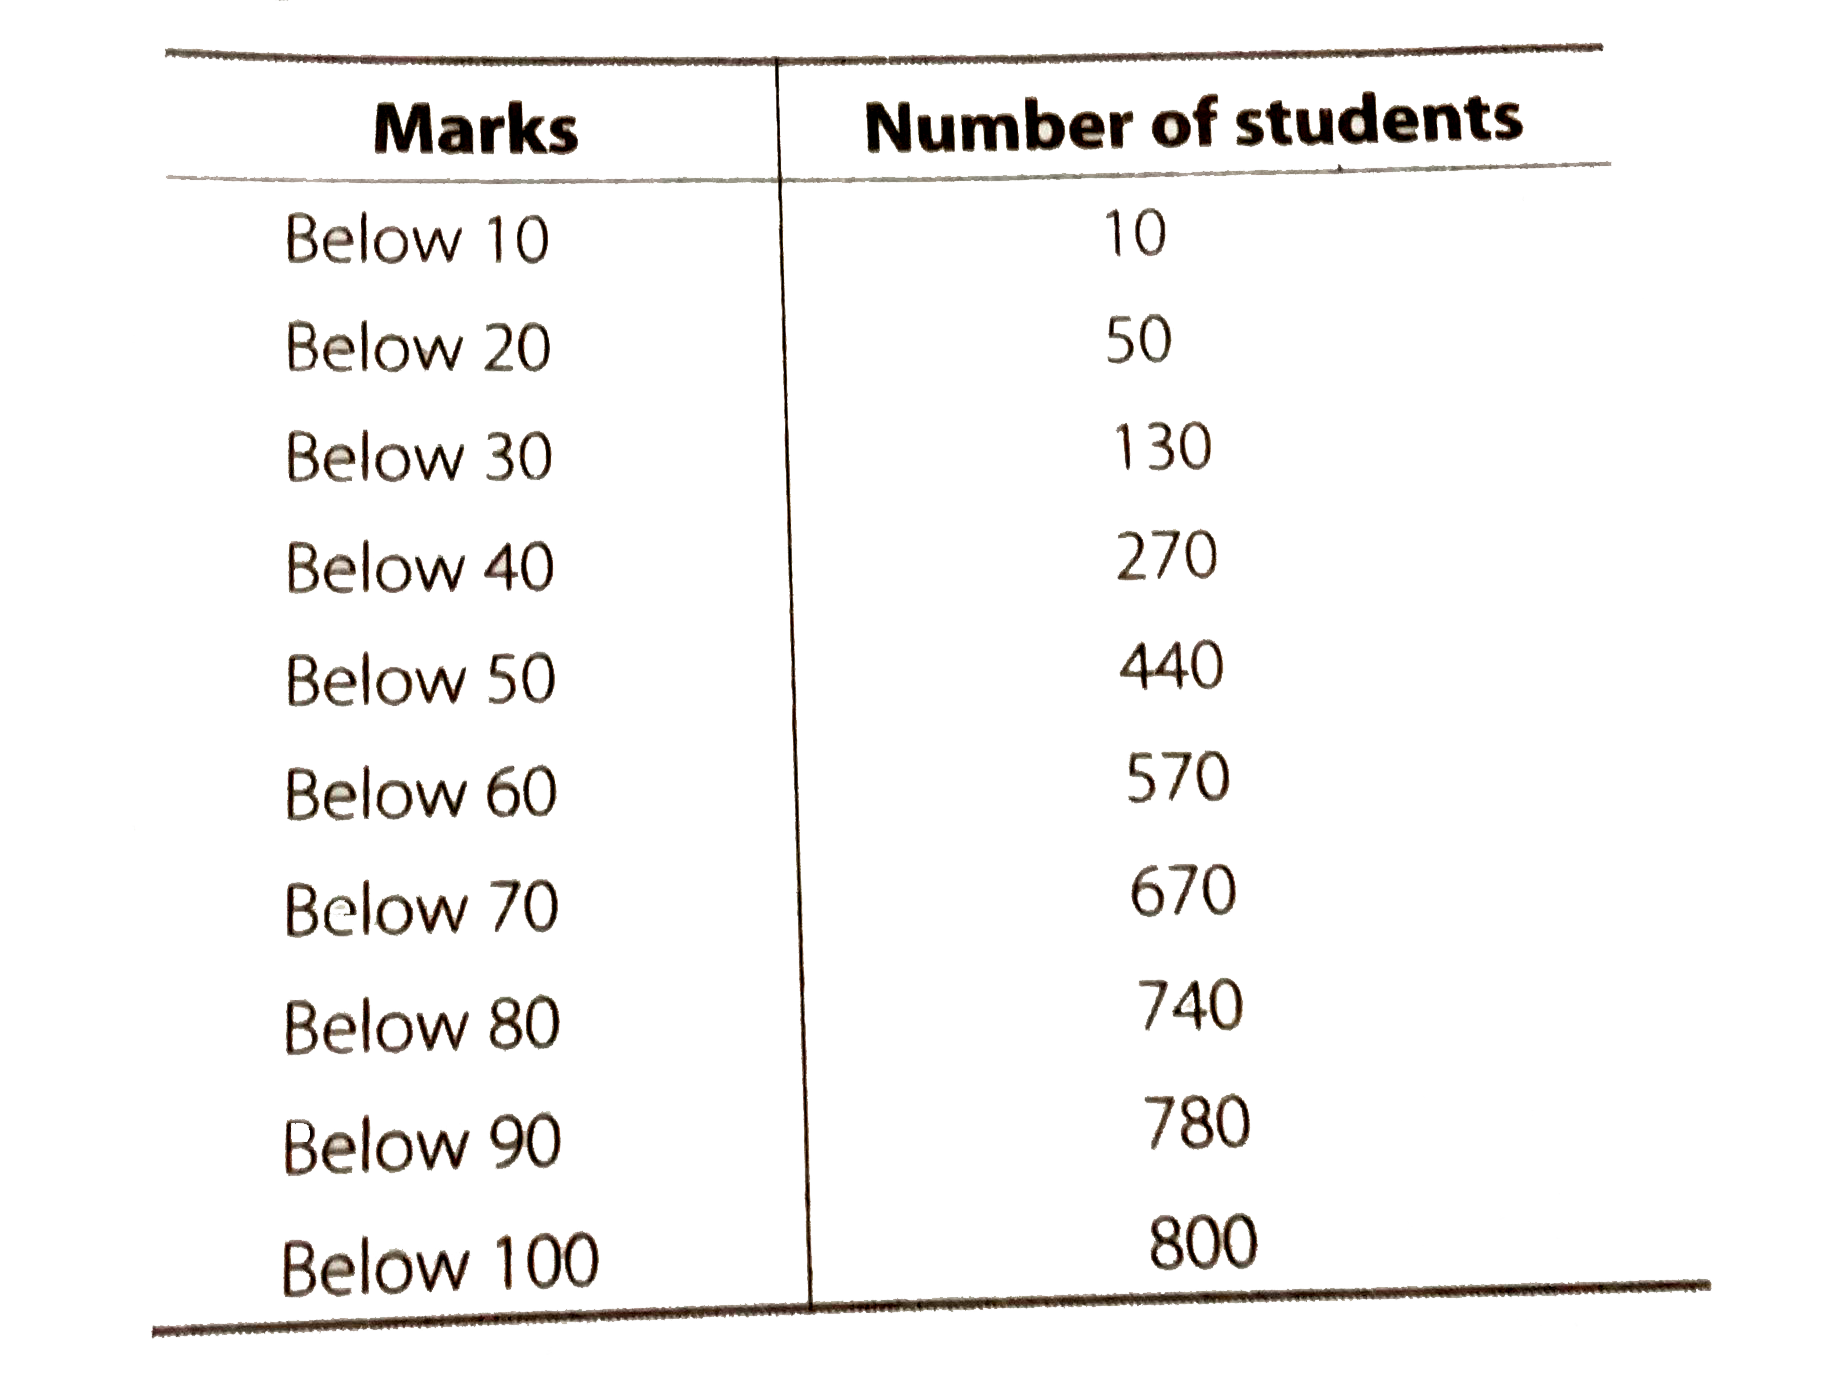
View SolutionThe following table show tha cumulative frequency distribution of marks of 800 students in an examination.

Construct a frequency distribution table for the data above.View SolutionThe marks obtained by 40 students of class IX in an examination are given below: 18, 8, 12, 6, 8, 16, 12, 5, 23, 2, 16, 23, 2, 10, 20, 12, 9, 7, 6, 5, 3, 5, 13, 21, 13, 15, 20, 24, 1, 7, 21, 16, 13, 18, 23, 7, 3, 18, 17, 16 Present the data in the form of a frequency distribution using the same class size, one such class being 15-20 (where 20 is not included)
View SolutionThe marks obtained by 40 students of class VIII in an examination are given below: 18,8,12,0,8,16,12,5,23,2,16,23,2,10,20,12,9,7,6,5,3,5, 13,21,13,15,20,24,1,7,21,16,13,18,23,7,3,18,17,16 Present the data in the form of a frequency distribution using the same class size, one such class being 15-20 (where 20 is not included).
View SolutionGiven below are the marks obtained by 40 students in an examination :
40 56 24 41 51 22 59 12 26 46
51 14 23 59 58 29 41 35 36 40
42 43 36 33 38 52 23 24 13 55
18 54 20 57 30 24 43 50 26 15
Taking class intervals 10−20,20−30,.....,50−60, construct a frequency table for the above distribution.View SolutionThe marks obtained by 40 students of class VIII in an examination are given below: 16,17,18,3,7,23,18,13,10,21,7,1,13,21,13,15,19,24,16,3, 23,5,12,18,8,12,6,8,16,5,3,5,0,7,9,12,20,10,2,23 Divide the data into five groups, namely 0-5, 5-10, 10-15, 15-20 and 20-25 and prepare a grouped frequency table.
View SolutionGiven below are the marks obtained by 24 students in an examination :
181716242519412232424421432628402930372749273431
Taking class intervals 10 - 20, 20 - 30, ............... , 50 - 60, make a frequency table for the above distribution.View SolutionGiven below are the marks obtained by 30 students in an examination :
081733414723203409184214301929113648402422021621153247443301
Taking class intervals 1-10, 11-20 ,......, 41 - 50 , Make a frequency table for the above distribution.View Solution


