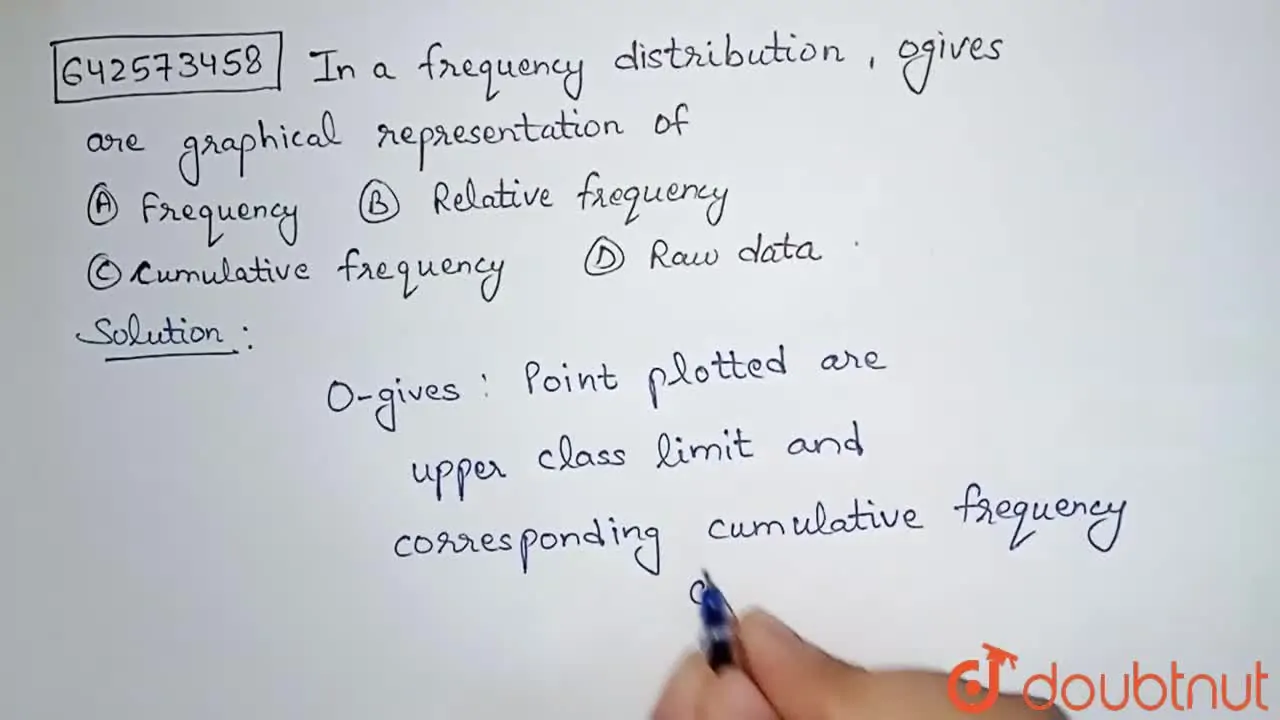
In a frequency distribution, ogives are graphical representation of (a) Frequency (b) Relative frequency (c) Cumulative frequency (d) Raw data
The correct Answer is:c
Step by step video & image solution for In a frequency distribution, ogives are graphical representation of (a) Frequency (b) Relative frequency (c) Cumulative frequency (d) Raw data by Maths experts to help you in doubts & scoring excellent marks in Class 9 exams.
Related Playlists
Similar Questions
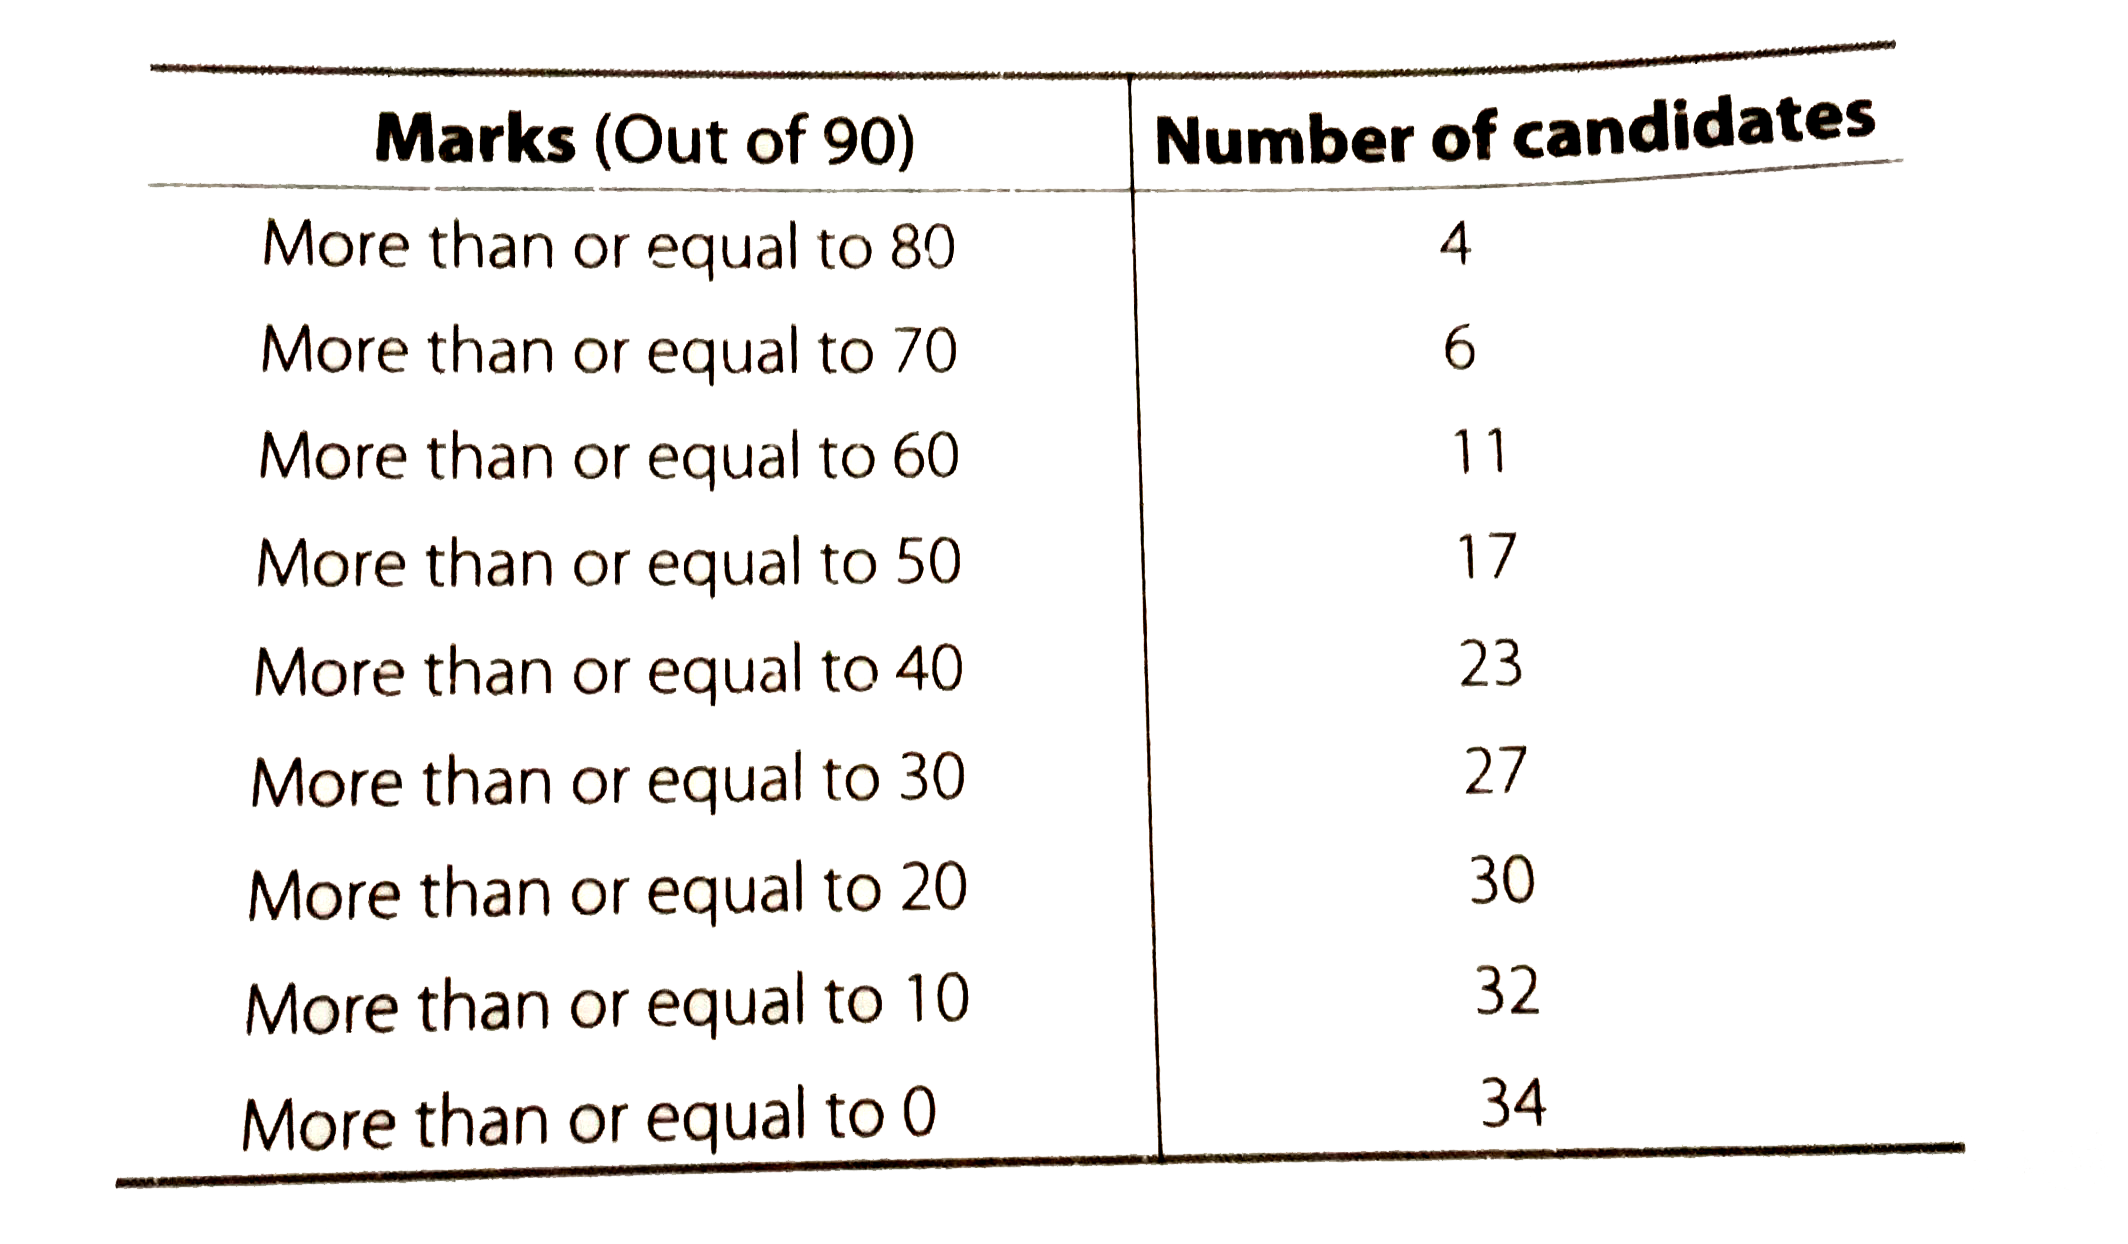
Cumulative Frequency Distribution
View SolutionQuartile deviation for a frequency distribution is
View SolutionFrom the frequency distribution table from the following data
 View Solution
The mode of a frequency distribution can be determined graphically from (a) Histogram (b) Frequency polygon (c) Ogive (d) Frequency curve
View SolutionFor a frequency distribution 7th decile is computed by the formula
View SolutionThe median of a given frequency distribution is found graphically with the help of (a) Histogram (b) Frequency curve (c) Frequency polygon (d) Ogive
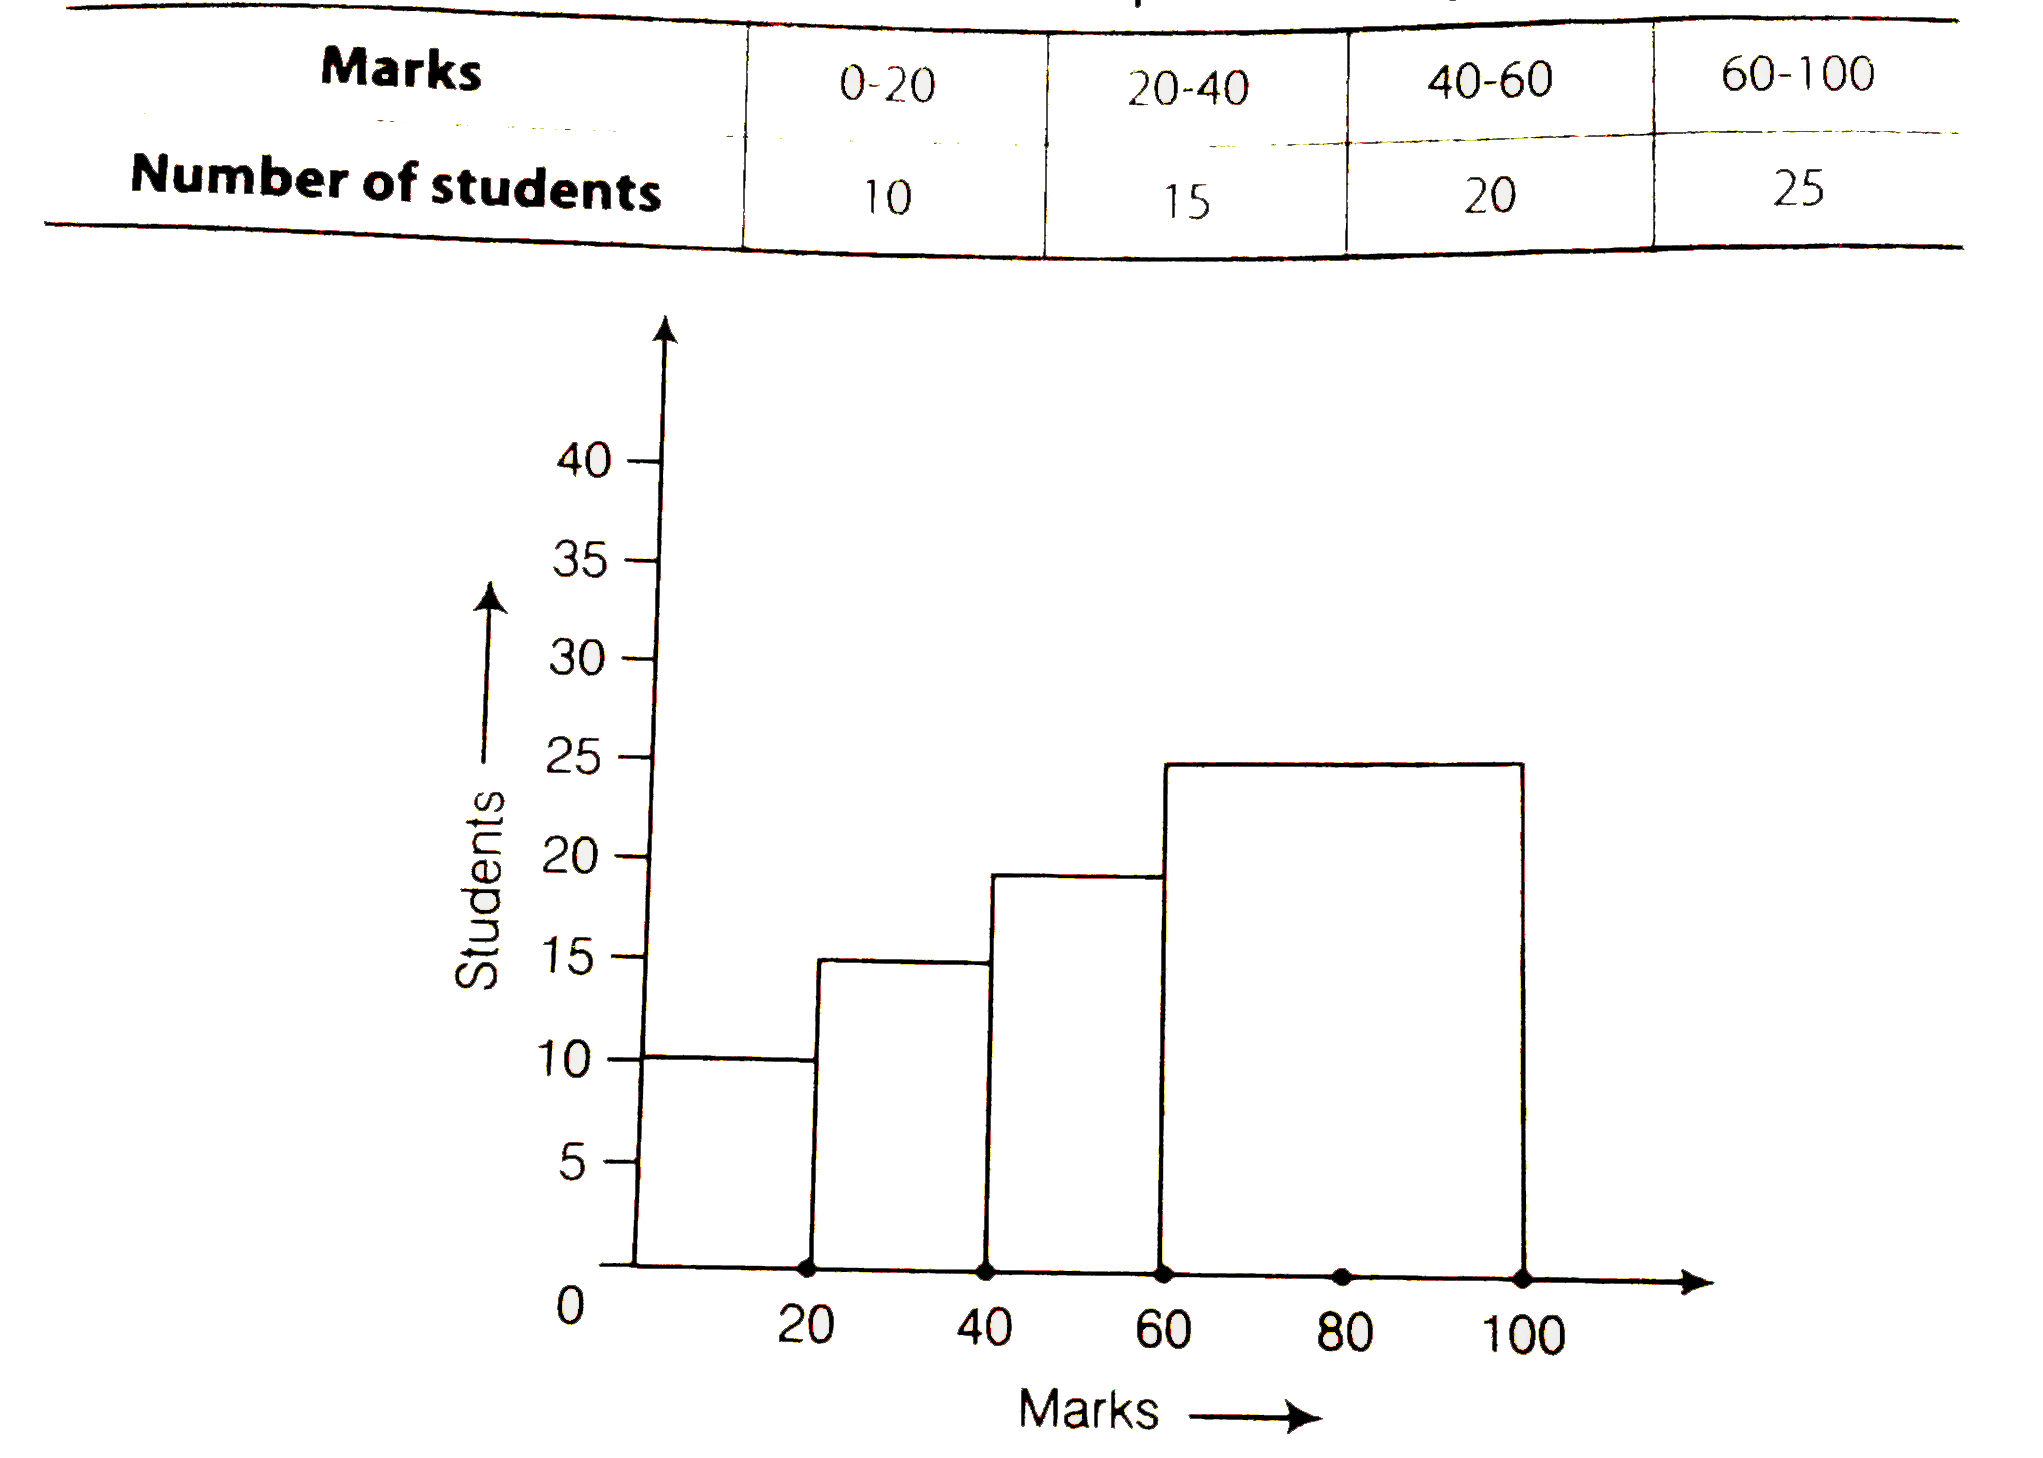
View SolutionThe frequency distributions been represented graphically as follows.

Do you think representation is correct? Why?View SolutionFor the following frequency distribution

The upper limit of median class isView SolutionWhich one of the following is not the graphical representation of statistical data: bar graph (b) Histogram Frequency polygon (d) Comulative frequency distribution
View SolutionExplain the difference between a frequency distribution and a cumulative frequency distribution.
View Solution


