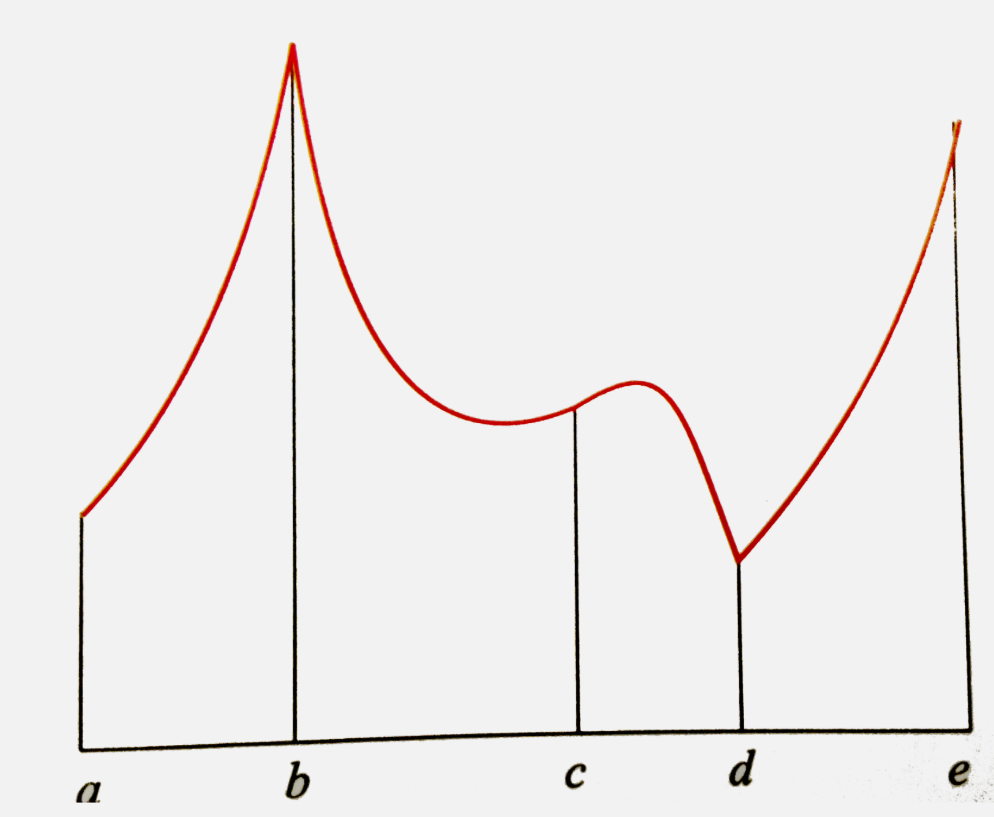
In which of the following graphs is x=c the point of inflection? figure (b) figure (c) figure (d) figure


The correct Answer is:1,2,4
At the point of inflection concavity of the curve changes in respictive of any other factor
Topper's Solved these Questions
- MONOTONICITY AND MAXIMA MINIMA OF FUNCTIONSBook:CENGAGE ENGLISHChapter:MONOTONICITY AND MAXIMA MINIMA OF FUNCTIONSExercise:Numerical Value Type
Explore 24 Videos
- MONOTONICITY AND MAXIMA MINIMA OF FUNCTIONSBook:CENGAGE ENGLISHChapter:MONOTONICITY AND MAXIMA MINIMA OF FUNCTIONSExercise:Single Correct Answer Type
Explore 13 Videos
- MONOTONICITY AND MAXIMA MINIMA OF FUNCTIONSBook:CENGAGE ENGLISHChapter:MONOTONICITY AND MAXIMA MINIMA OF FUNCTIONSExercise:Exercise
Explore 93 Videos
- METHODS OF DIFFERENTIATIONBook:CENGAGE ENGLISHChapter:METHODS OF DIFFERENTIATIONExercise:Single Correct Answer Type
Explore 46 Videos
- MONOTONOCITY AND NAXINA-MINIMA OF FUNCTIONSBook:CENGAGE ENGLISHChapter:MONOTONOCITY AND NAXINA-MINIMA OF FUNCTIONSExercise:Comprehension Type
Explore 6 Videos
Similar Questions
Knowledge Check
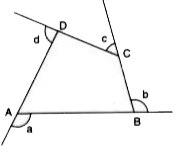
Using the adjoining figure, find a+b+c+d.
 A180∘B360∘C270∘D380∘
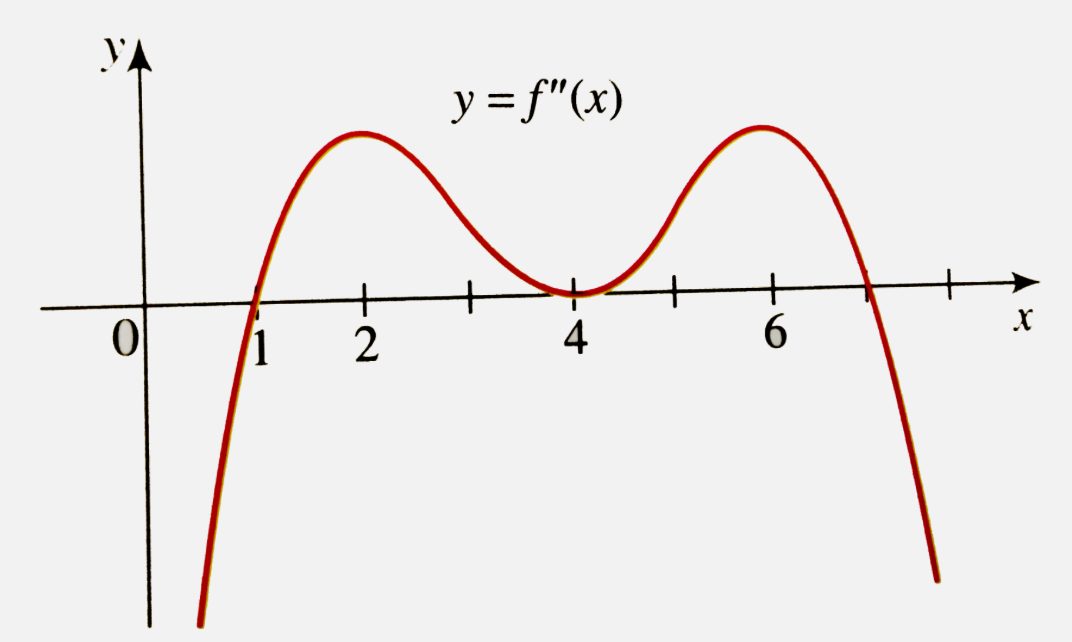
The graph of the second derivation f''(x) is given in the following figure. State the x - coordinate of the point of inflection of f. Given reasons for your answer.

View SolutionRefer the figures A , B , C and D given below. Which of the following option shows the correct name of the animals shown by the figures A , B, C and D ?

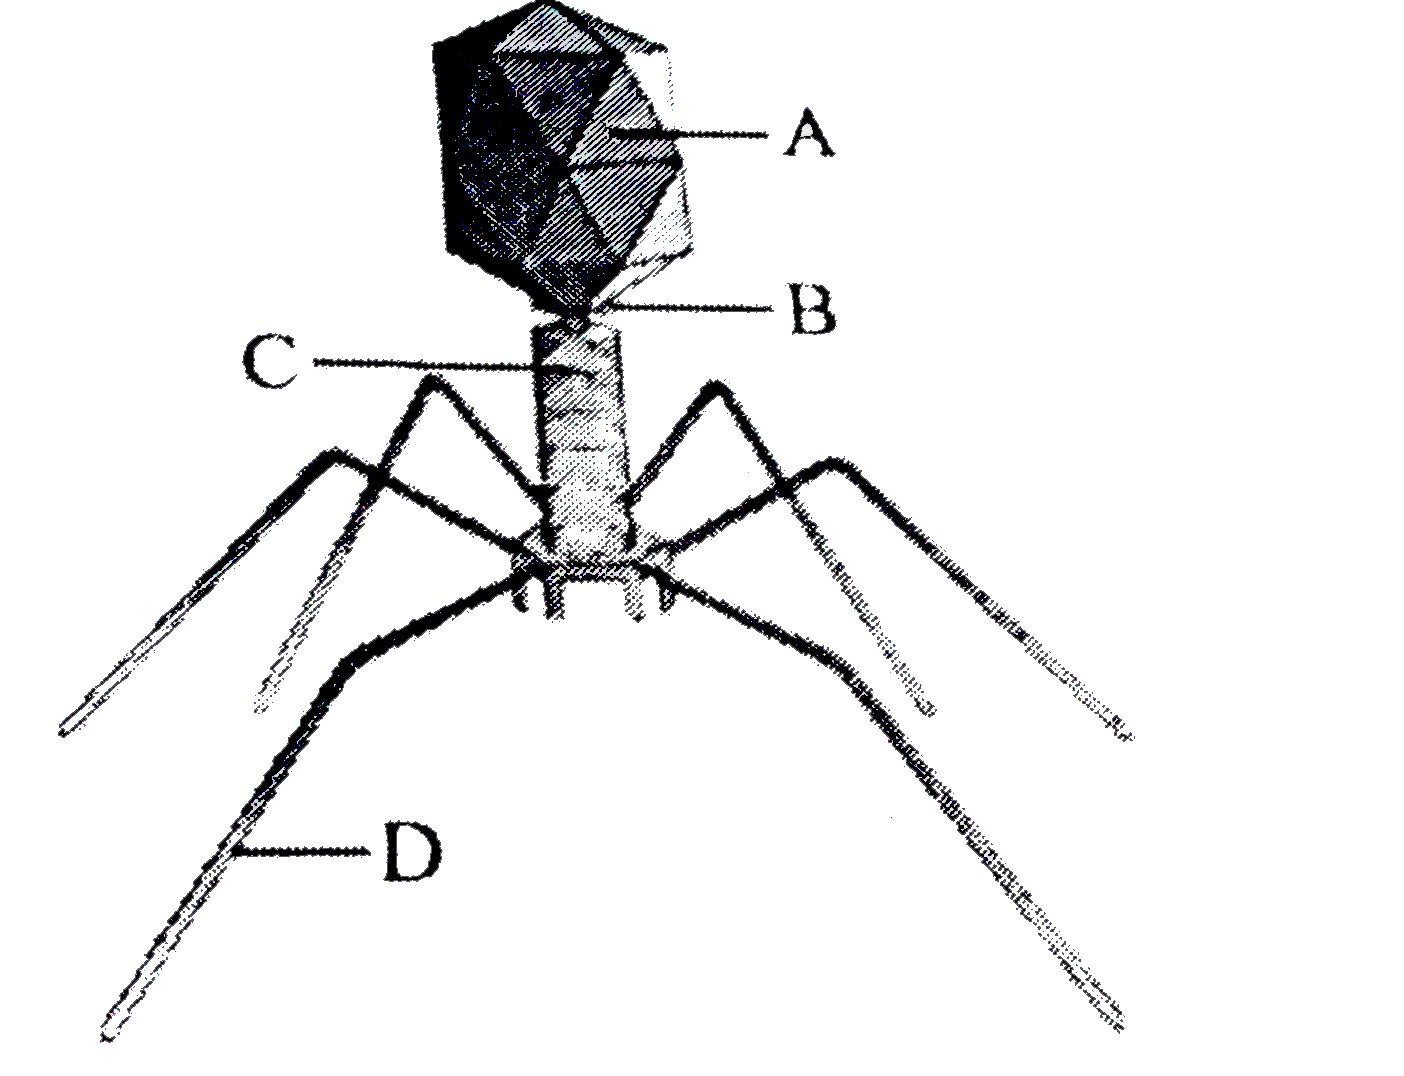
View SolutionIndentify the following figures (A,B,C and D)
 .
.
View SolutionMatch the following figures Prisms Nets with areas of faces (a) (b) (c) (d)
View SolutionIdentify the following A,B,C and D in given figure:

View SolutionFind a + b + c in the following figure:
View SolutionThe graph of a function is shown in the following figure.

Determine the intervals on which the function is concave up and the intervals on which it is concave down. Find the x - coordinates of any inflection points.
View Solution


