A tall cylinder is filled with viscous oil. A round pebble is dropped from the top with zero initial velocity. From the plot shown in figure, indicate the one that represents the velocity (v) of the pebble as a function of time (t)
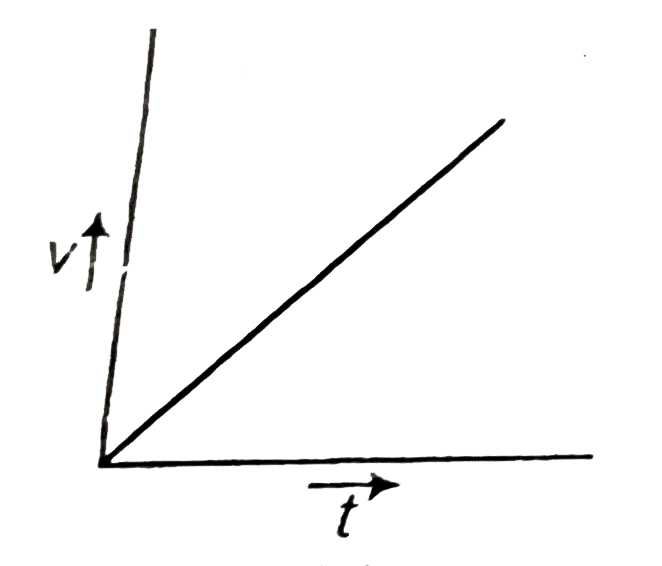
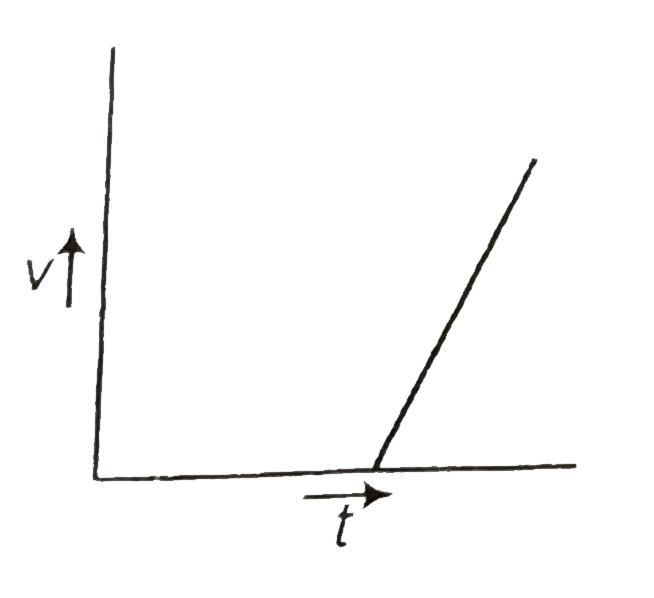
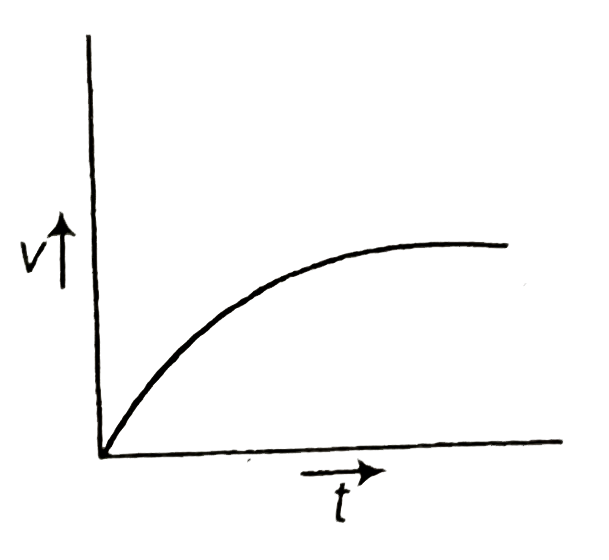
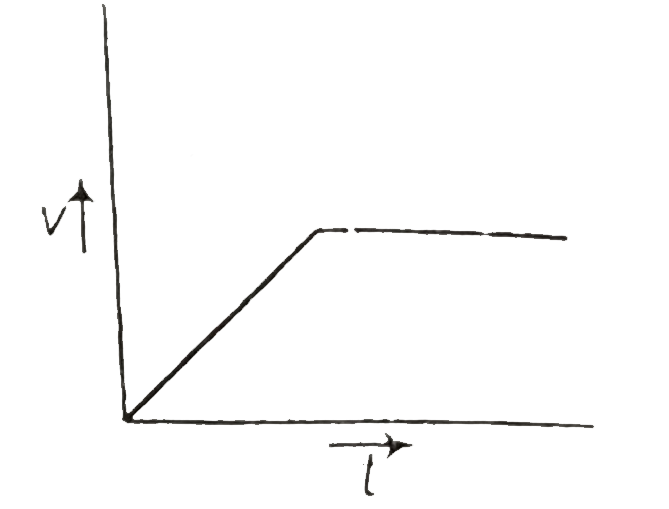
The correct Answer is:C
To solve the problem of determining the velocity of a pebble dropped into a viscous fluid (oil) as a function of time, we can follow these steps:
Step 1: Understand the Forces Acting on the Pebble
When the pebble is dropped, three main forces act on it:
1. Gravitational Force (Weight): This force acts downward and is constant, given by Fg=mg.
2. Buoyant Force: This acts upward and is equal to the weight of the fluid displaced by the pebble, given by Fb=ρfVg, where ρf is the density of the fluid, V is the volume of the pebble, and g is the acceleration due to gravity.
3. Viscous Drag Force: This force opposes the motion of the pebble and increases with velocity, given by Fd=6πηrv, where η is the viscosity of the fluid, r is the radius of the pebble, and v is the velocity of the pebble.
Step 2: Analyze the Motion of the Pebble
Initially, when the pebble is dropped, it has zero velocity. As it falls, the gravitational force causes it to accelerate downward. However, as the velocity increases, the viscous drag force also increases, opposing the motion.
Step 3: Determine the Terminal Velocity
Eventually, the pebble will reach a point where the net force acting on it becomes zero. This occurs when the downward gravitational force is balanced by the upward buoyant force and the viscous drag force. At this point, the pebble reaches its terminal velocity vt:
mg=Fb+Fd
At terminal velocity, the acceleration becomes zero, and the velocity remains constant.
Step 4: Sketch the Velocity vs. Time Graph
1. Initial Phase: The pebble starts from rest (velocity = 0) and begins to accelerate downward. The velocity increases rapidly at first.
2. Decreasing Acceleration: As the pebble continues to fall, the acceleration decreases because the viscous drag force increases with velocity.
3. Terminal Velocity: Eventually, the pebble reaches a constant terminal velocity where the velocity no longer increases, and the graph levels off.
Step 5: Identify the Correct Graph
From the description of the motion:
- The graph should start at the origin (0,0) since the initial velocity is zero.
- It should show a curve that rises steeply at first (indicating increasing velocity) and then levels off as it approaches terminal velocity.
Conclusion
The graph that represents the velocity of the pebble as a function of time will show a curve that starts at zero, rises quickly, and then flattens out as it approaches terminal velocity.
When the pebble is dropped, three main forces act on it:
1. Gravitational Force (Weight): This force acts downward and is constant, given by Fg=mg.
2. Buoyant Force: This acts upward and is equal to the weight of the fluid displaced by the pebble, given by Fb=ρfVg, where ρf is the density of the fluid, V is the volume of the pebble, and g is the acceleration due to gravity.
3. Viscous Drag Force: This force opposes the motion of the pebble and increases with velocity, given by Fd=6πηrv, where η is the viscosity of the fluid, r is the radius of the pebble, and v is the velocity of the pebble.
Initially, when the pebble is dropped, it has zero velocity. As it falls, the gravitational force causes it to accelerate downward. However, as the velocity increases, the viscous drag force also increases, opposing the motion.
Eventually, the pebble will reach a point where the net force acting on it becomes zero. This occurs when the downward gravitational force is balanced by the upward buoyant force and the viscous drag force. At this point, the pebble reaches its terminal velocity vt:
mg=Fb+Fd
At terminal velocity, the acceleration becomes zero, and the velocity remains constant.
1. Initial Phase: The pebble starts from rest (velocity = 0) and begins to accelerate downward. The velocity increases rapidly at first.
2. Decreasing Acceleration: As the pebble continues to fall, the acceleration decreases because the viscous drag force increases with velocity.
3. Terminal Velocity: Eventually, the pebble reaches a constant terminal velocity where the velocity no longer increases, and the graph levels off.
From the description of the motion:
- The graph should start at the origin (0,0) since the initial velocity is zero.
- It should show a curve that rises steeply at first (indicating increasing velocity) and then levels off as it approaches terminal velocity.
The graph that represents the velocity of the pebble as a function of time will show a curve that starts at zero, rises quickly, and then flattens out as it approaches terminal velocity.
Topper's Solved these Questions
- MECHANICAL PROPERTIES OF FLUIDSBook:NCERT EXEMPLAR ENGLISHChapter:MECHANICAL PROPERTIES OF FLUIDSExercise:Multiple Choice Questions (More than One Options)
Explore 5 Videos
- MECHANICAL PROPERTIES OF FLUIDSBook:NCERT EXEMPLAR ENGLISHChapter:MECHANICAL PROPERTIES OF FLUIDSExercise:Very Short Answer Type Questions
Explore 5 Videos
- LAWS OF MOTIONBook:NCERT EXEMPLAR ENGLISHChapter:LAWS OF MOTIONExercise:Long answer Type Questions
Explore 9 Videos
- MECHANICAL PROPERTIES OF SOLIDSBook:NCERT EXEMPLAR ENGLISHChapter:MECHANICAL PROPERTIES OF SOLIDSExercise:LONG SHORT ANSWER TYPE QUESTION
Explore 16 Videos
Similar Questions
The figure shows the velocity (v) of a particle plotted against time (t).
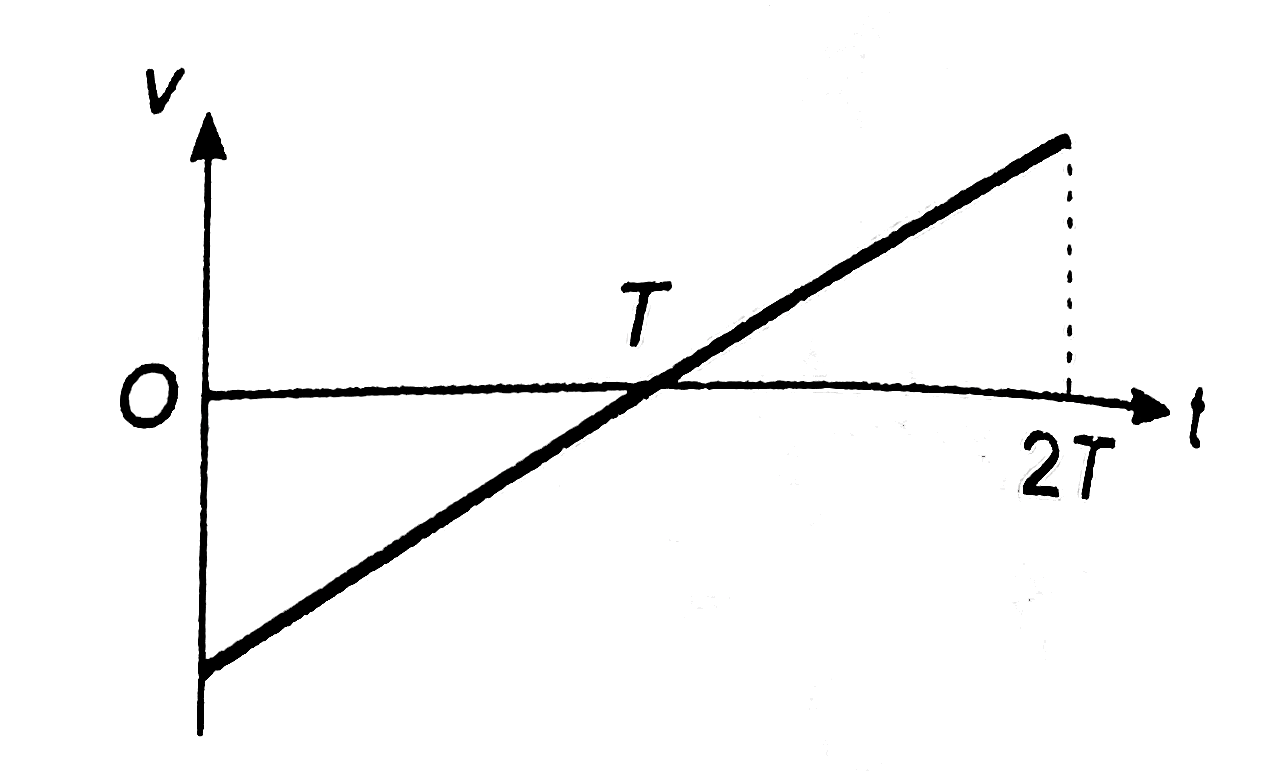
View SolutionThe figure shows the velocity (v) of a particle plotted against time (t).

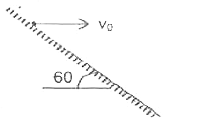
View SolutionA ball is projected horizontally from an inclined plane with a velocity V, as shown in the figure. It will strike the plane after a time
View SolutionA ball is thrown vertically upwards from the top of tower of height h with velocity v . The ball strikes the ground after time.
View SolutionA trolley filled with sand is moving with a velocity v on a smooth horizontal surface due to inertia. If the sand falls off at the rate of μkg/sec, the velocity of the trolley as a function of time will be best represented by:
View SolutionFrom the velocity time plot shown in figure find the distance travelled by the particle dureing the first 40 seconds. Also find the average velocity during this period.

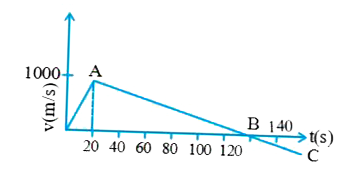
View SolutionA rocket is launched upward from the earth surface whose velocity time graph shown in figure. Then maximum height attained by the rocket is :
View SolutionThe graph shown the variation with times t of the velocity v of an object . Which one of the following graphs best represents the variation of acceleration a of the object with time t?

View SolutionA pobble is thrown vertically upwards from a bridge with an initial velocity of 4.9ms−1 . It strikes the water after 2 s. If acceleration due to gravity does the pebble strike the water ?
View SolutionA car changes its velocity linearly from 10m/s to 20m/s in 5 seconds. Plot v-t graph and write velocity as a function of time.
View Solution

