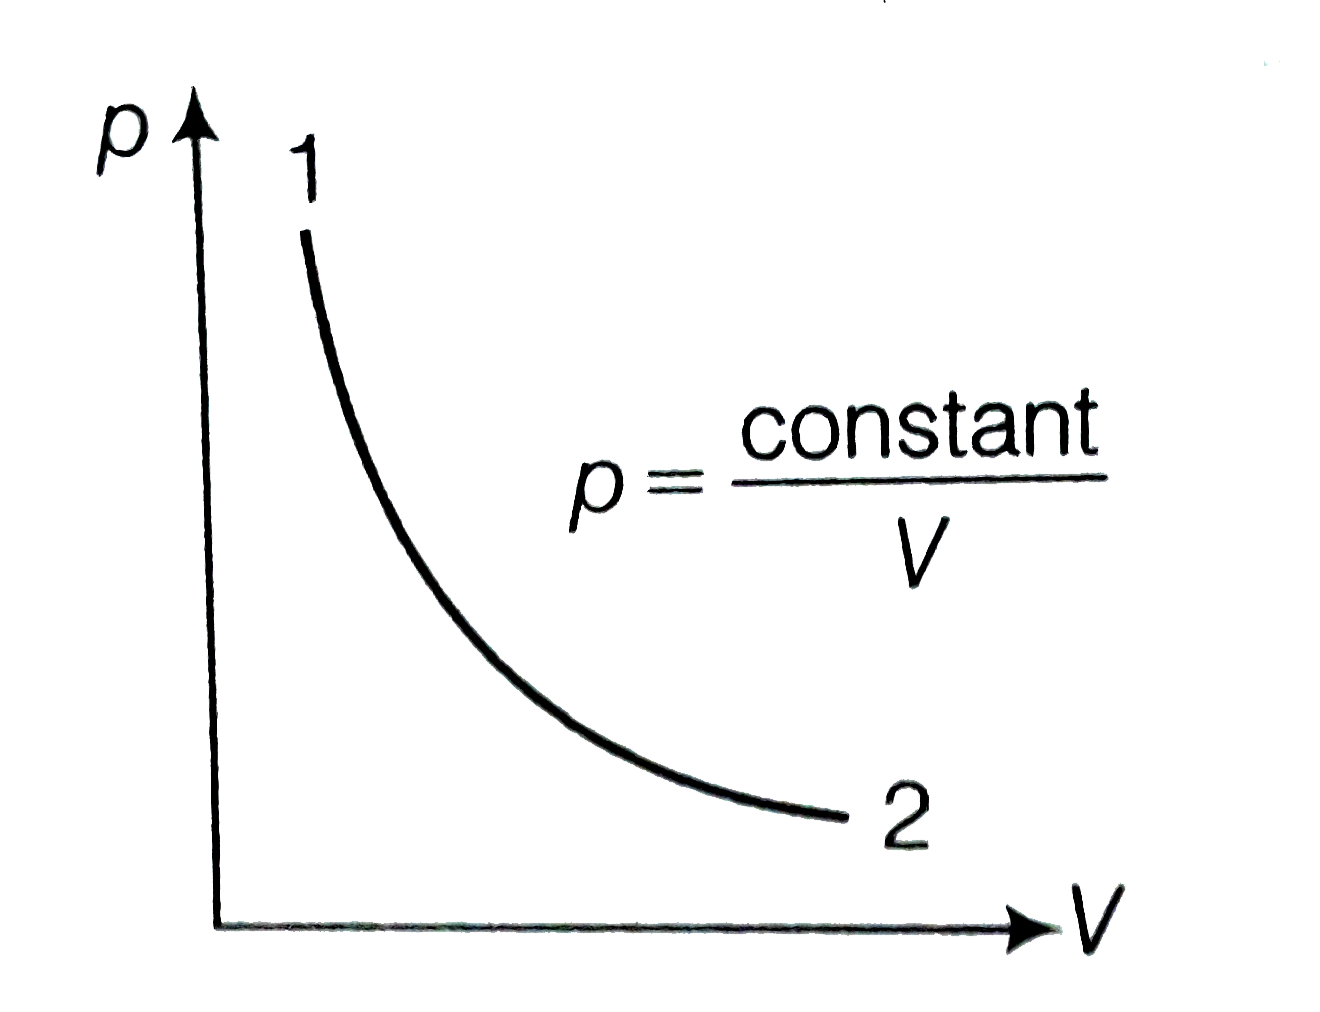
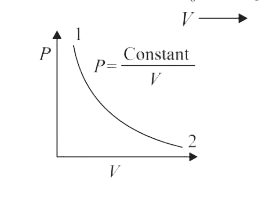
Consider p-V diagram for an ideal gas shown in figure.
Out of the following diagrams, which figure represents the T−p diagram ?
(i) 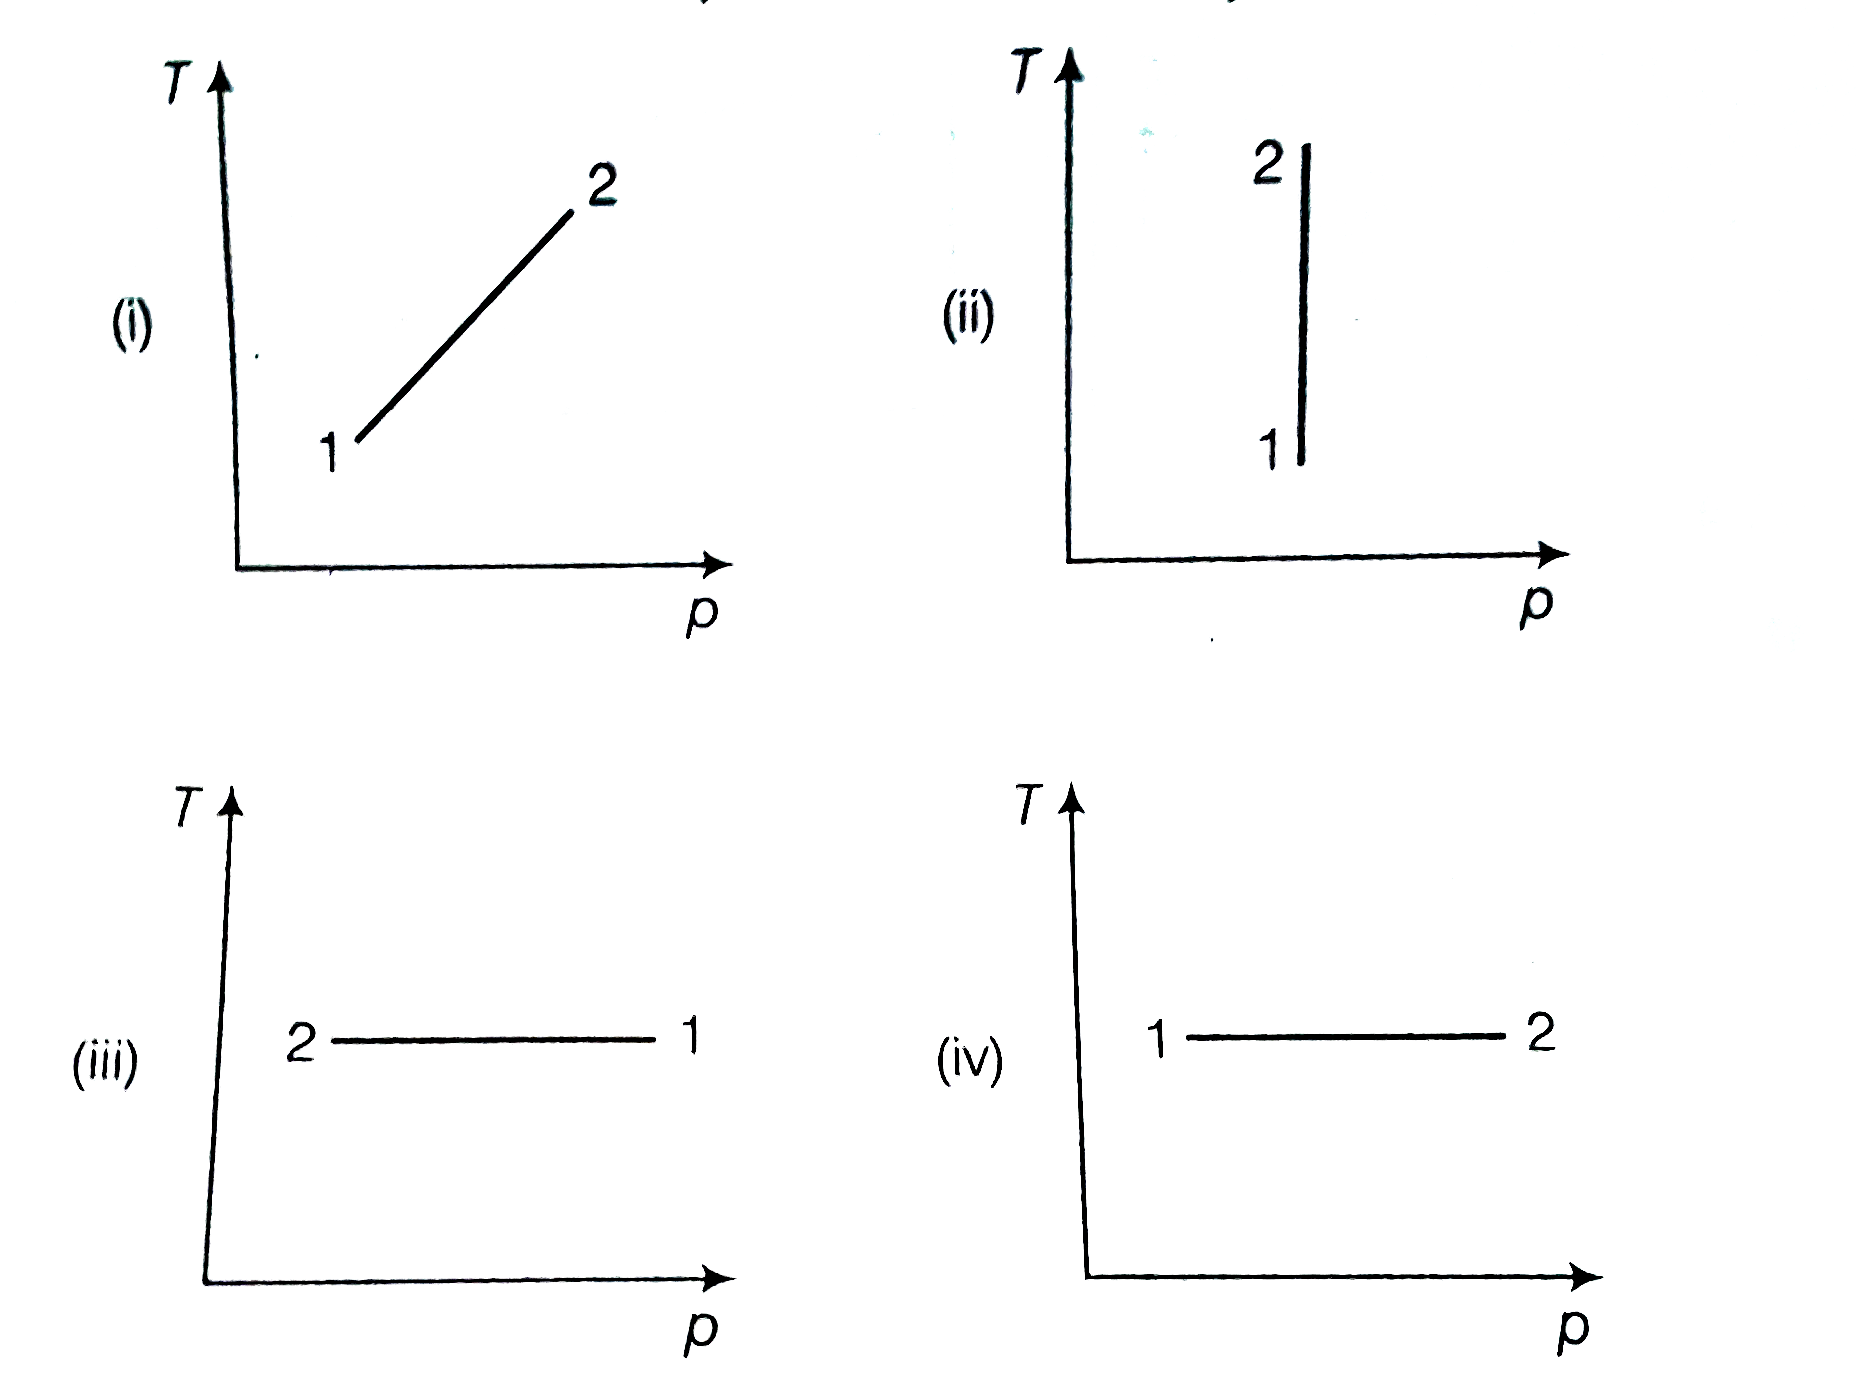
A
(iv)
B
(ii)
C
(iii)
D
(i)
Video Solution
Text Solution
The correct Answer is:C
According to the question given that pV = constant
Hence, we can say that the gas is going through an isothermal process.
Clearly, from the graph that between process 1 and 2 themperature is constant and the gas expands and pressure decreases i.e., p2<p1 which corresponds to diagram (iii).
|
Topper's Solved these Questions
- THERMODYNAMICS BOOK - NCERT EXEMPLAR ENGLISHCHAPTER - THERMODYNAMICS EXERCISE - MULTIPLE CHOICE QUESTIONS (MORE THAN ONE OPTIONS)
5 Videos
- THERMODYNAMICS BOOK - NCERT EXEMPLAR ENGLISHCHAPTER - THERMODYNAMICS EXERCISE - VERY SHORT ANSWER TYPE QUESTIONS
5 Videos
- THERMAL PROPERTIES OF MATTERBOOK - NCERT EXEMPLAR ENGLISHCHAPTER - THERMAL PROPERTIES OF MATTEREXERCISE - Very short Answer type Questions
15 Videos
- UNITS AND MEASUREMENTS BOOK - NCERT EXEMPLAR ENGLISHCHAPTER - UNITS AND MEASUREMENTS EXERCISE - Long Answer Type Questions
9 Videos
Similar Questions
Knowledge Check
Which of the following P-V diagram represent the graph of isometric process?
A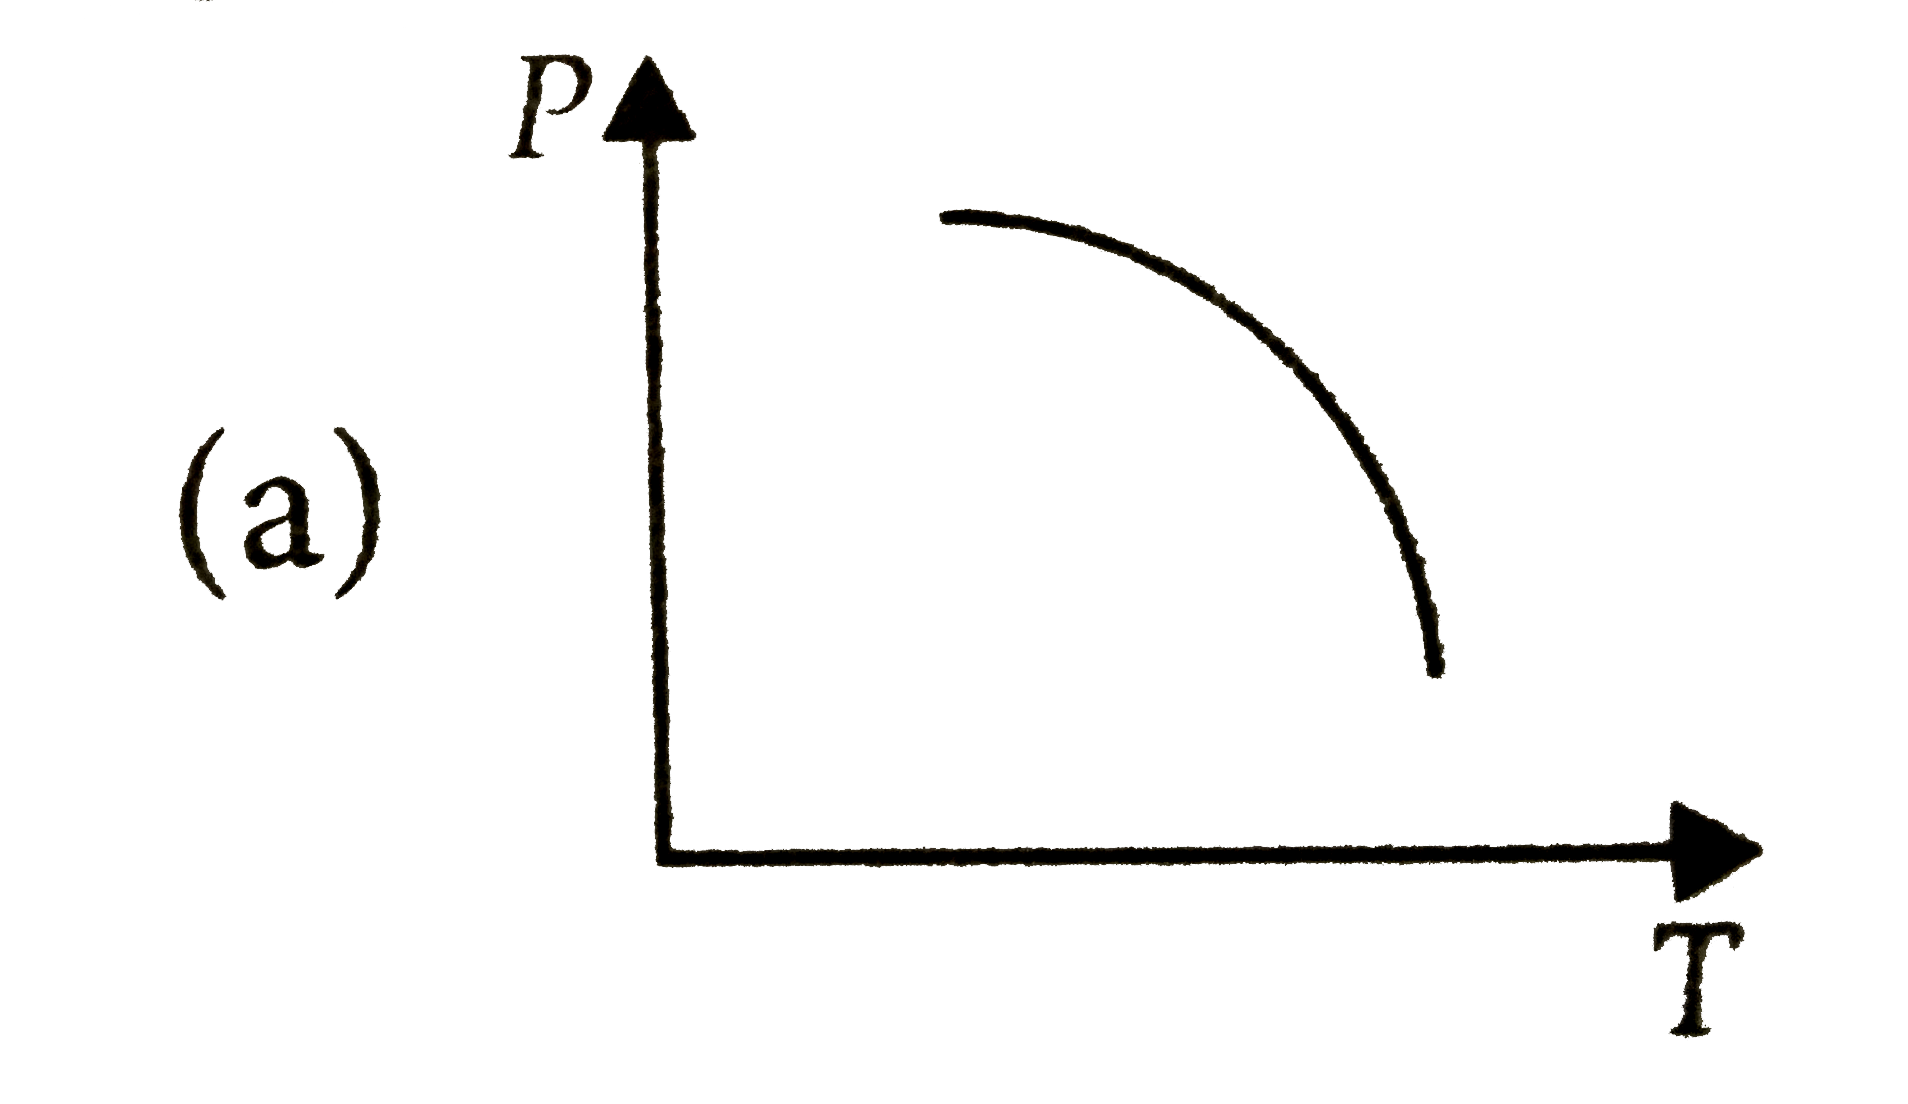 B
B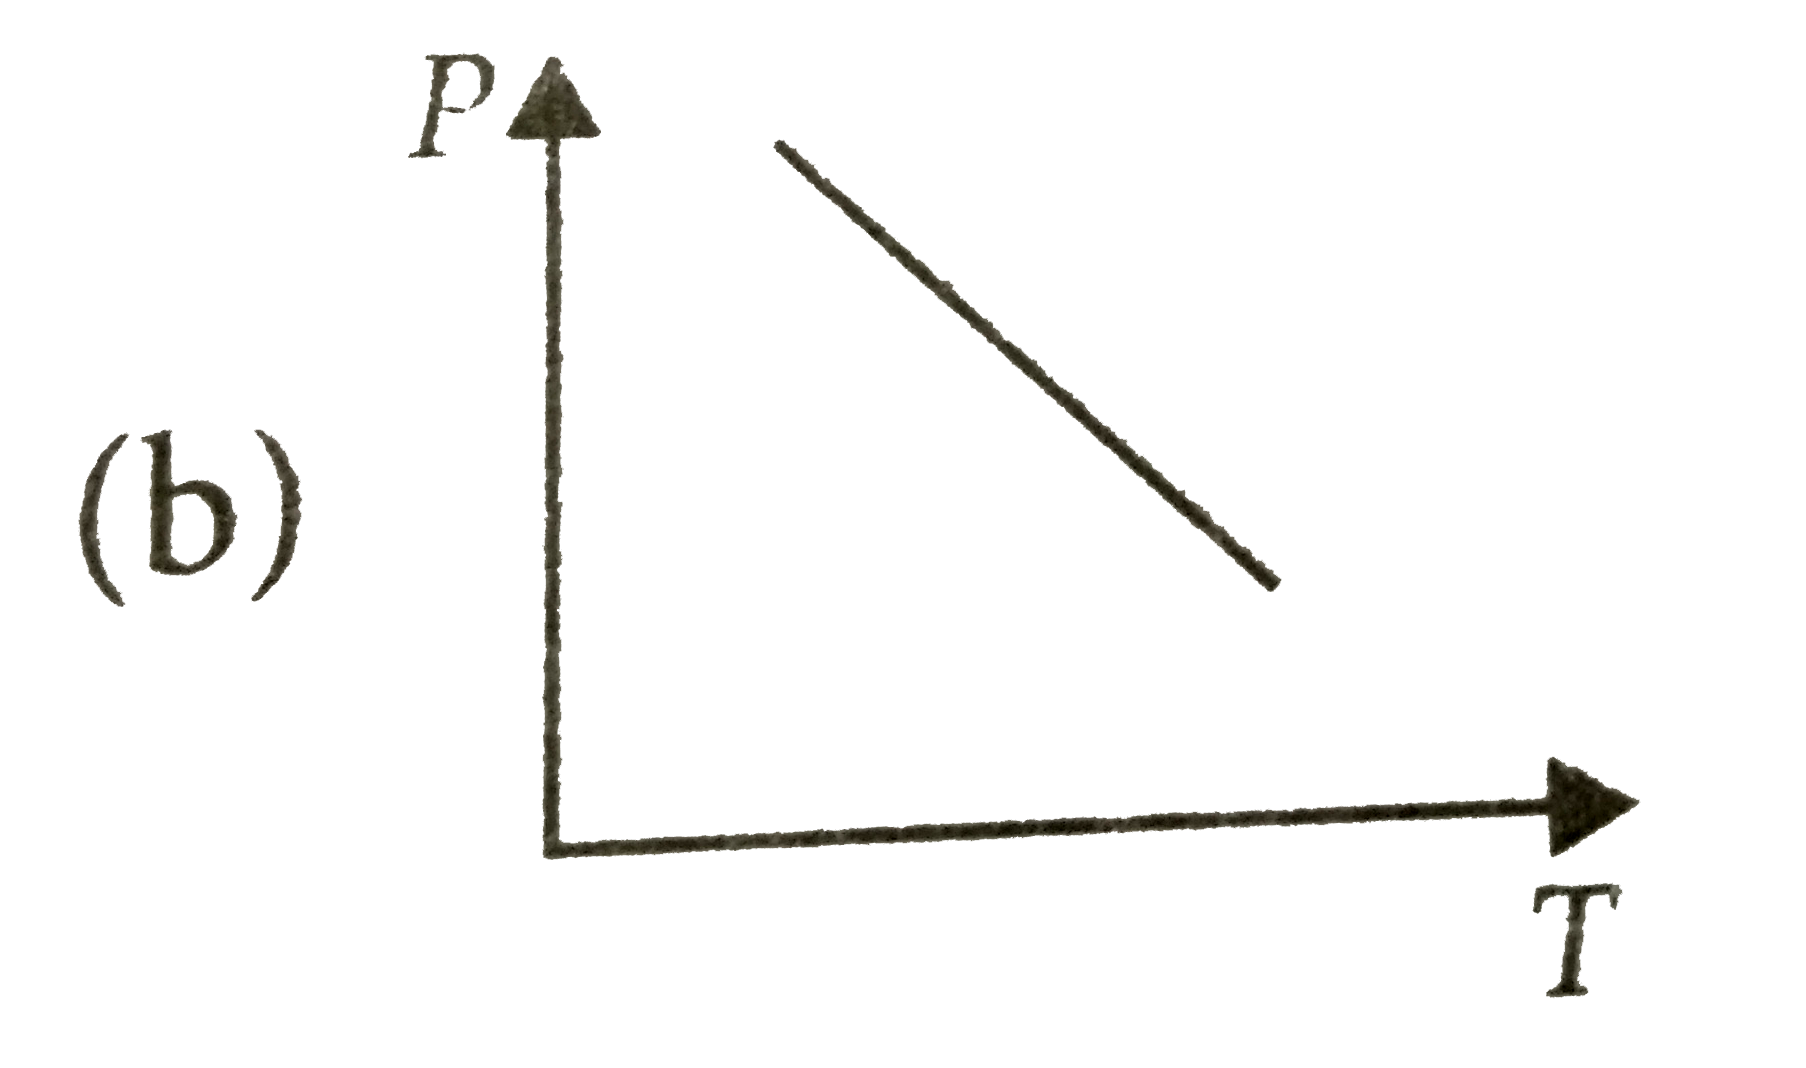 C
C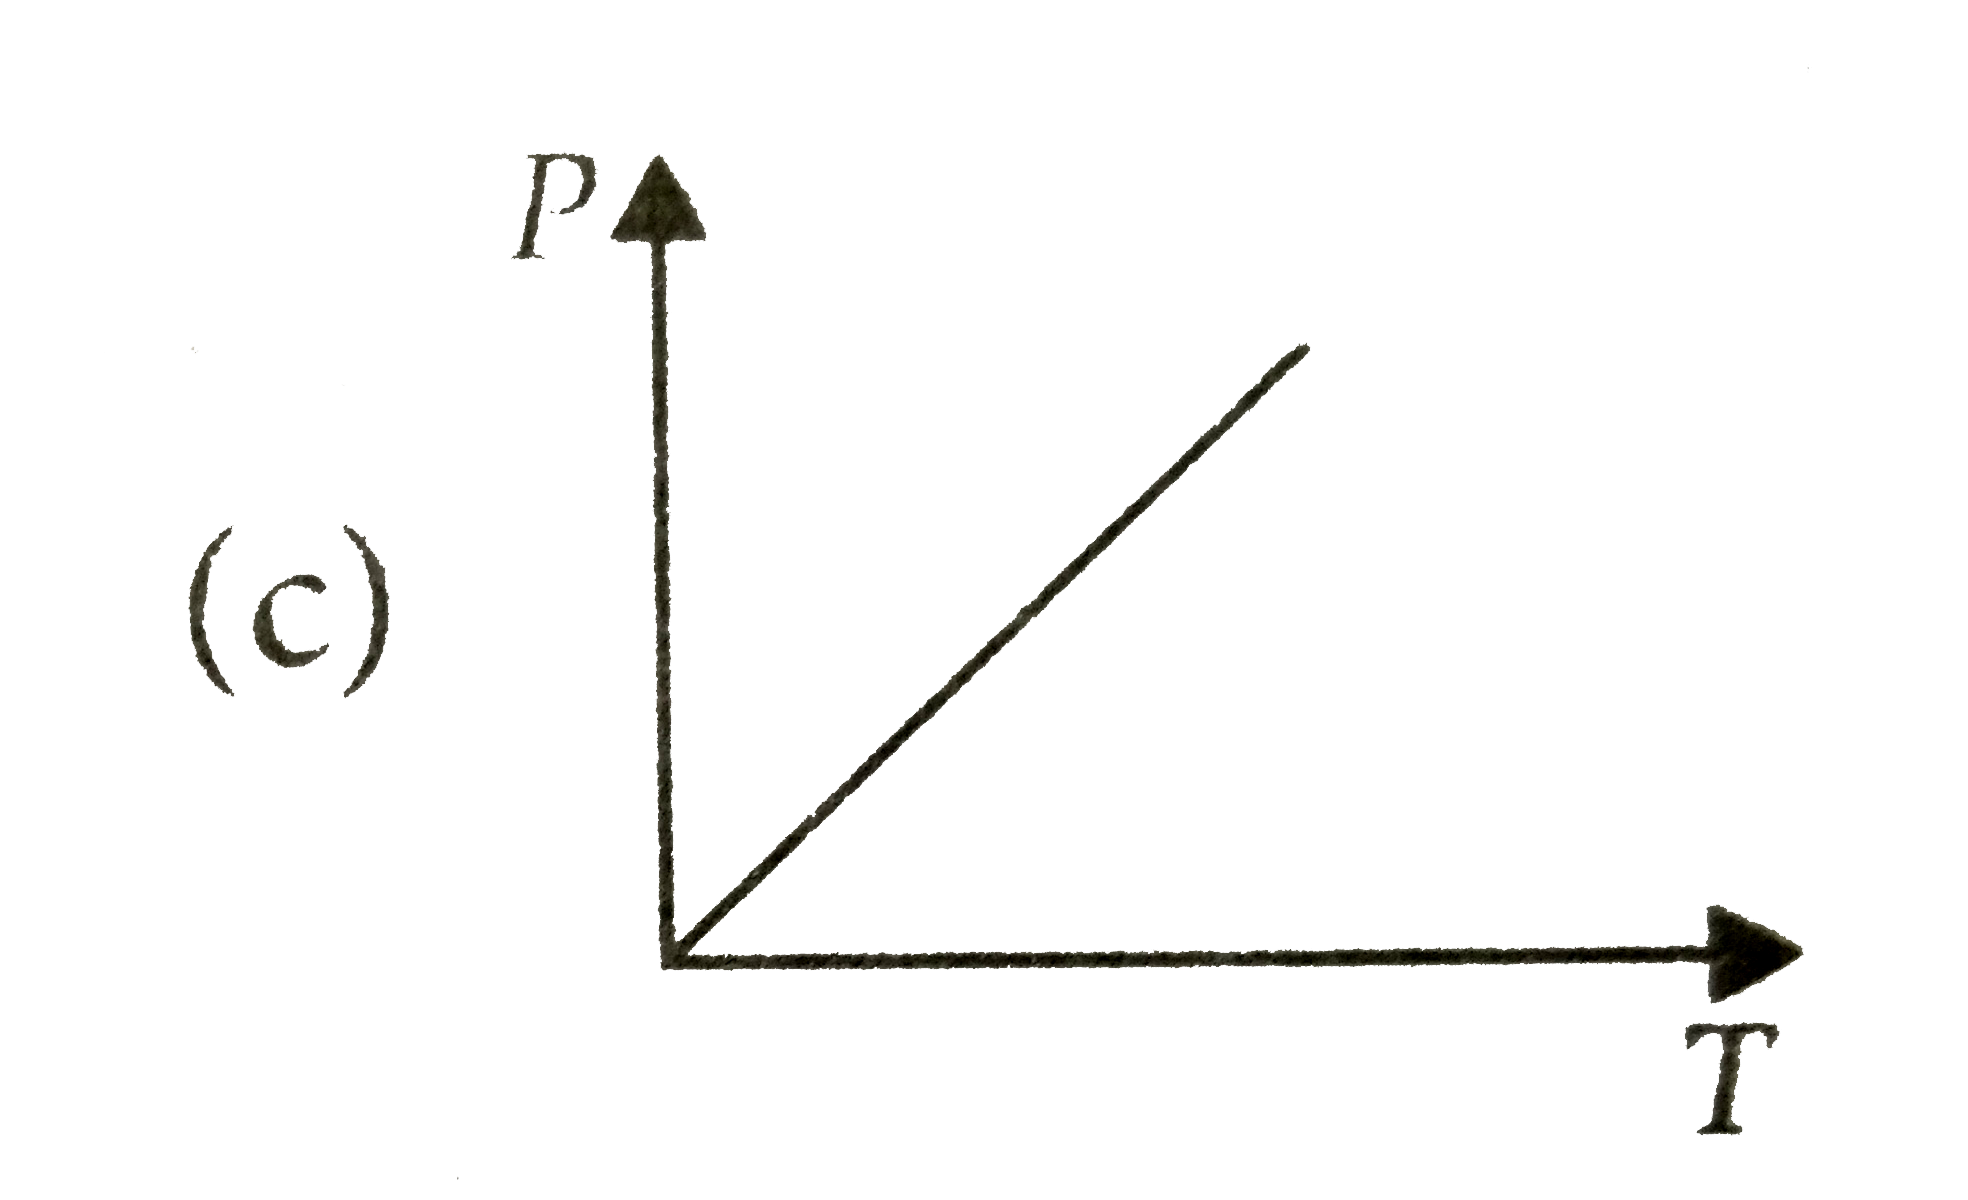 D
D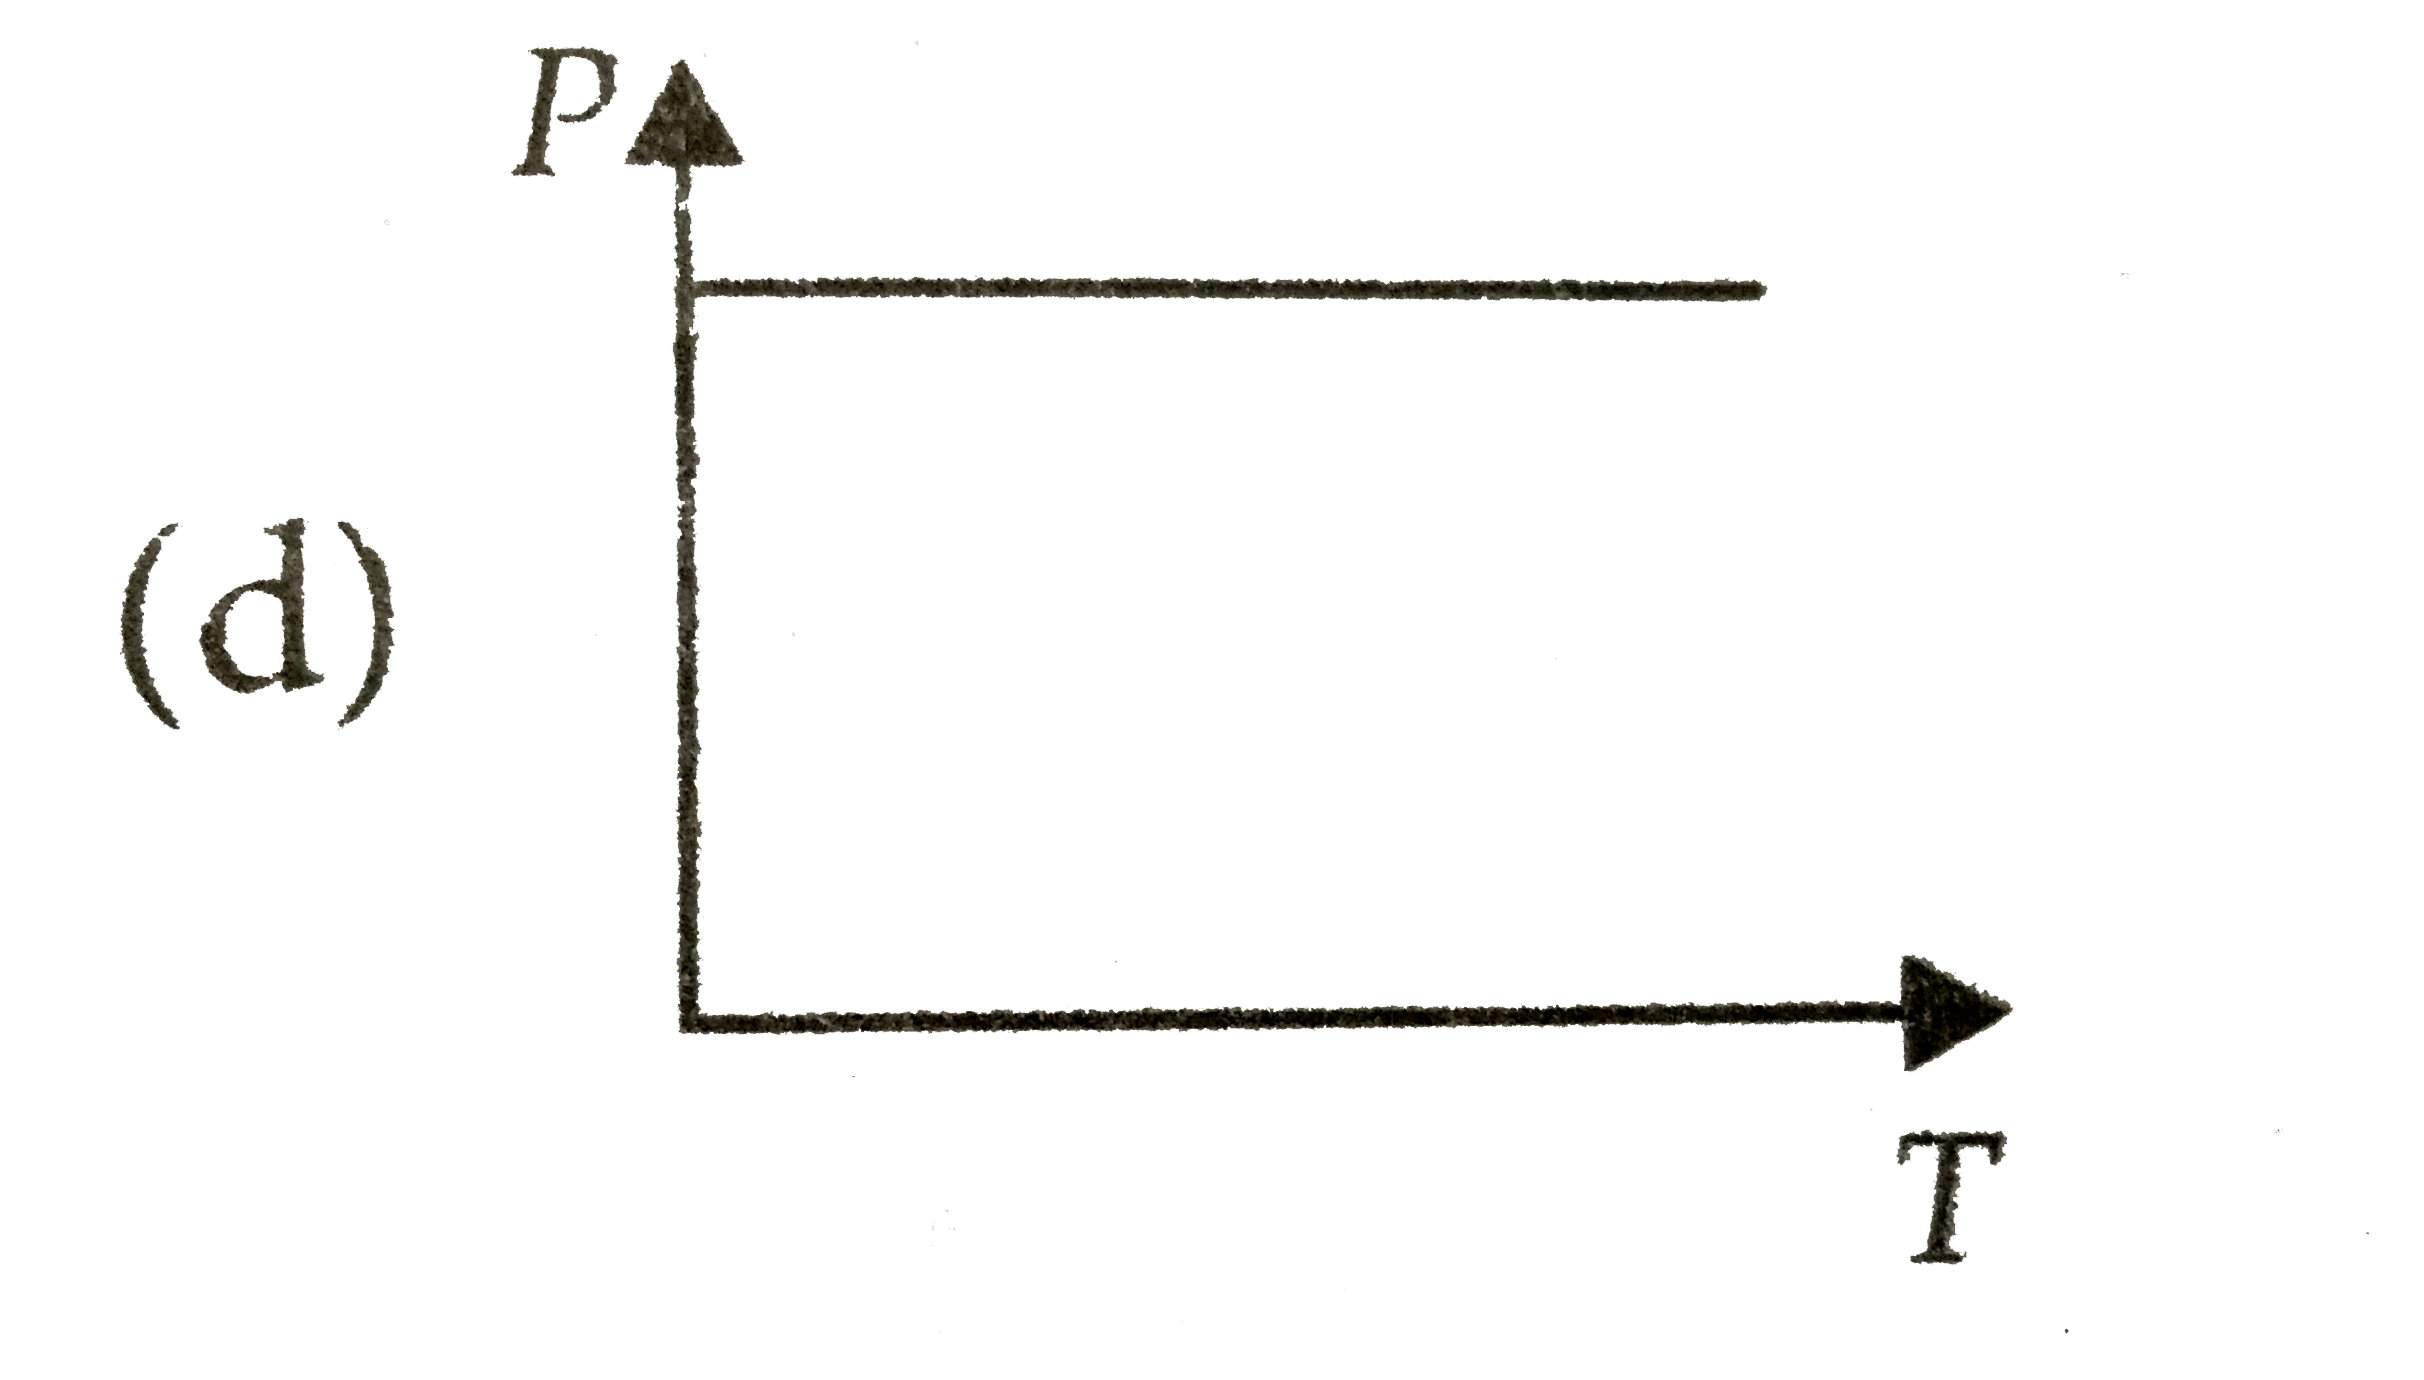
P−V diagram of an ideal gas is as shown in figure. Work done by the gas in process ABCD is
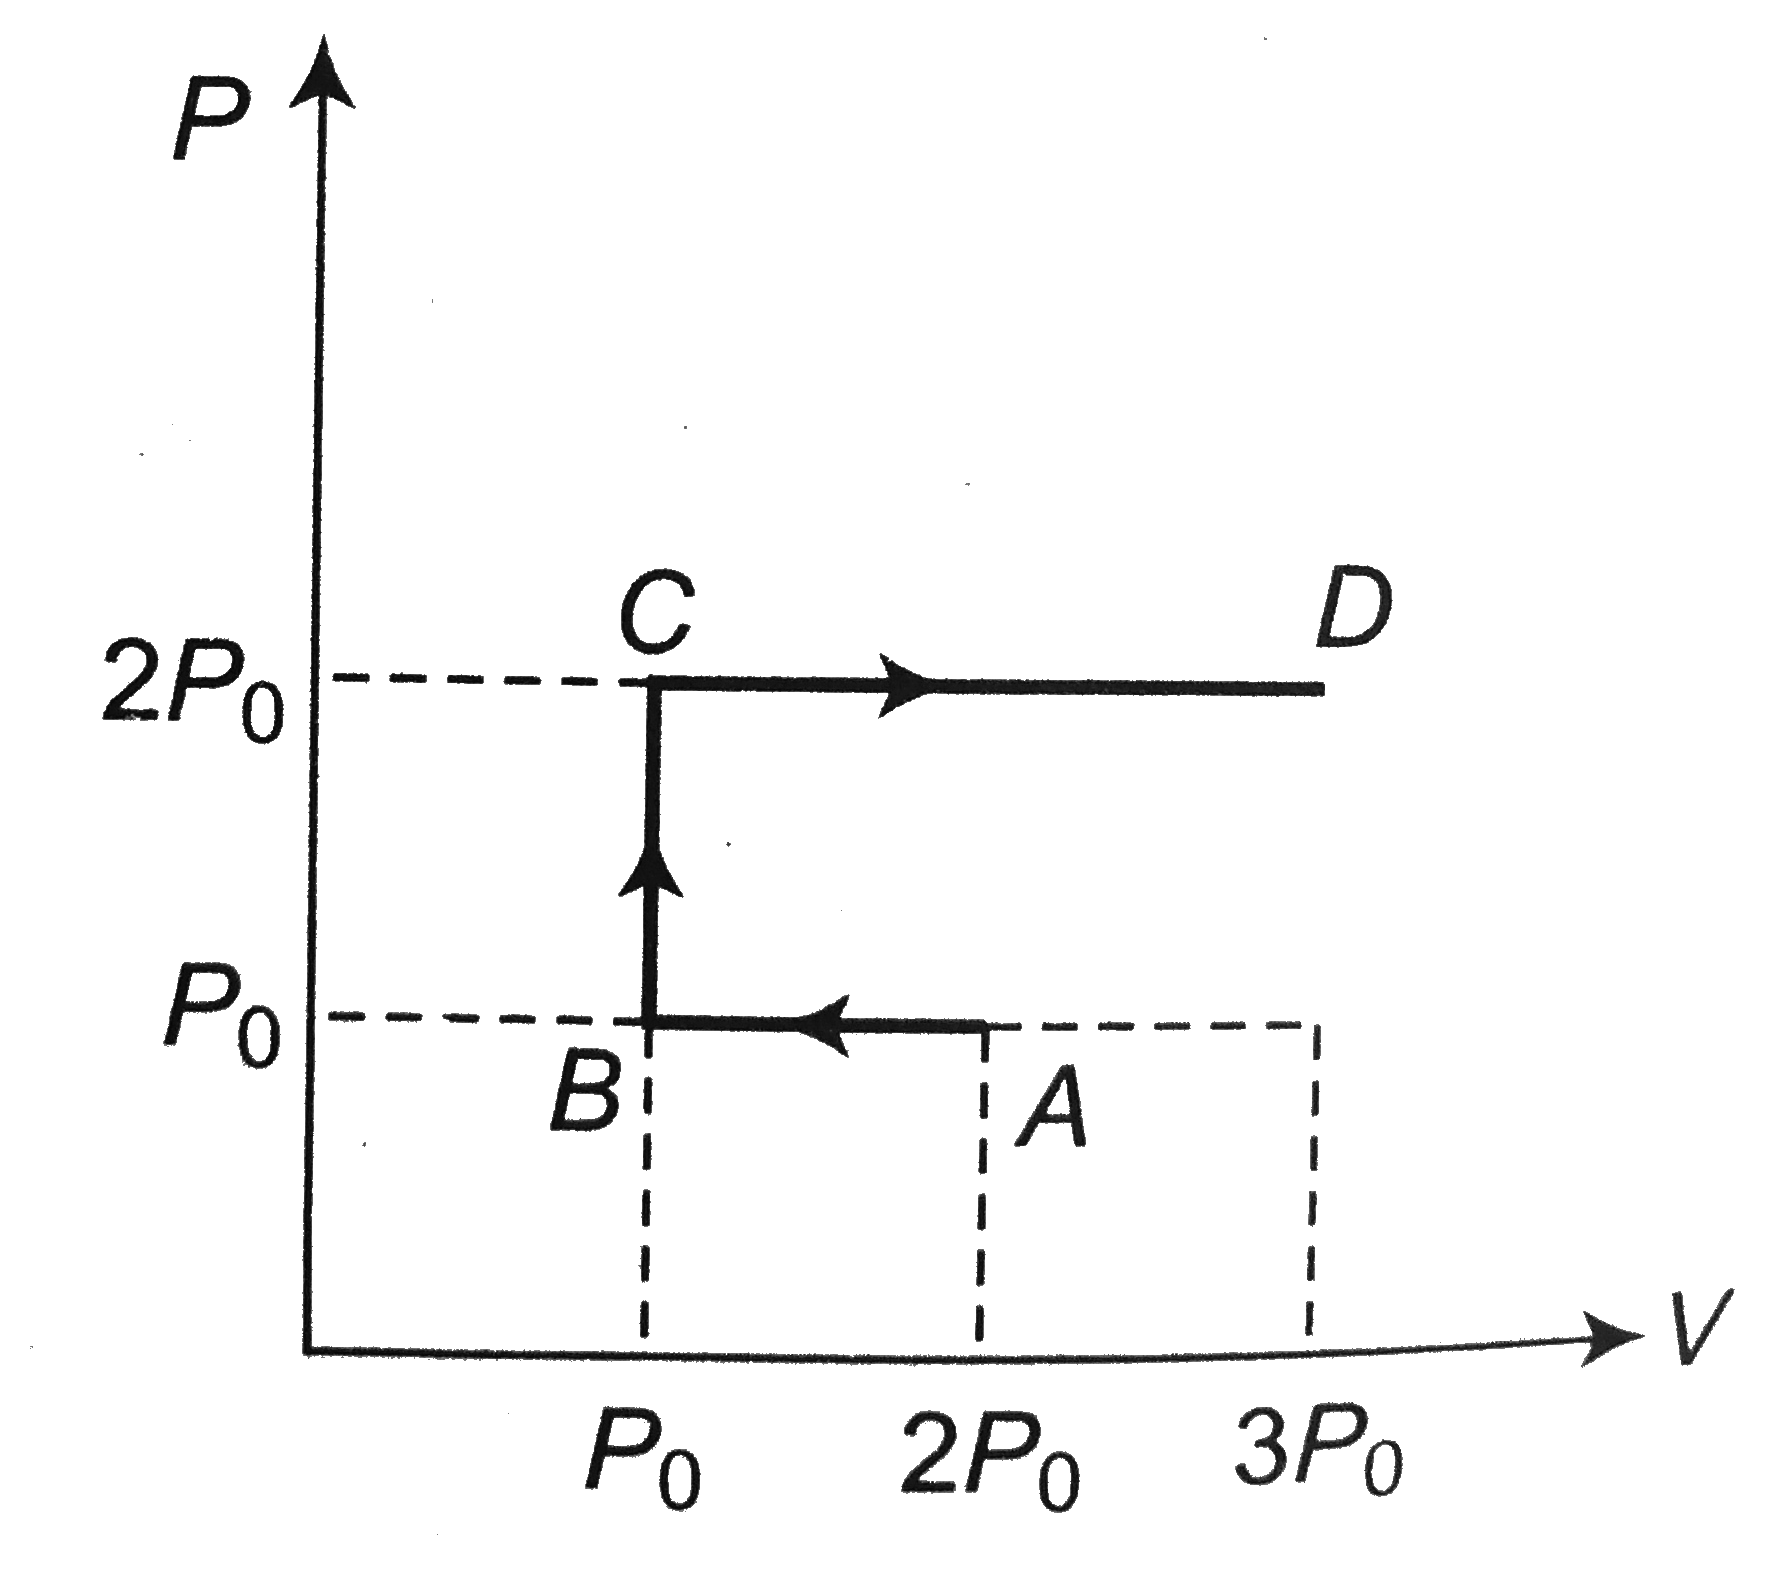
View SolutionFor the diagram given for an ideal gas, out of the following which one correctly represent the diagram?
View SolutionThe PT diagram for an ideal gas is shown in the figure, where AC is an adiabatic process, find the corresponding PV diagram.
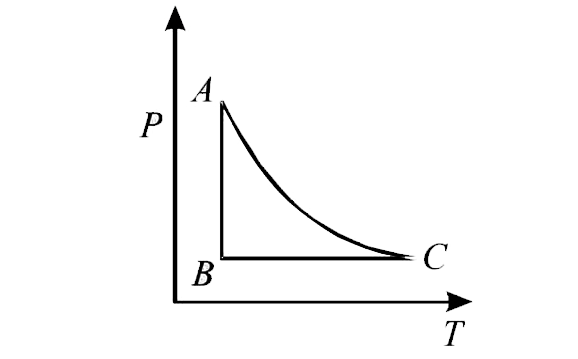
View SolutionThe PT diagram for an ideal gas is shown in the figure, where AC is an adiabatic process, find the corresponding PV diagram.

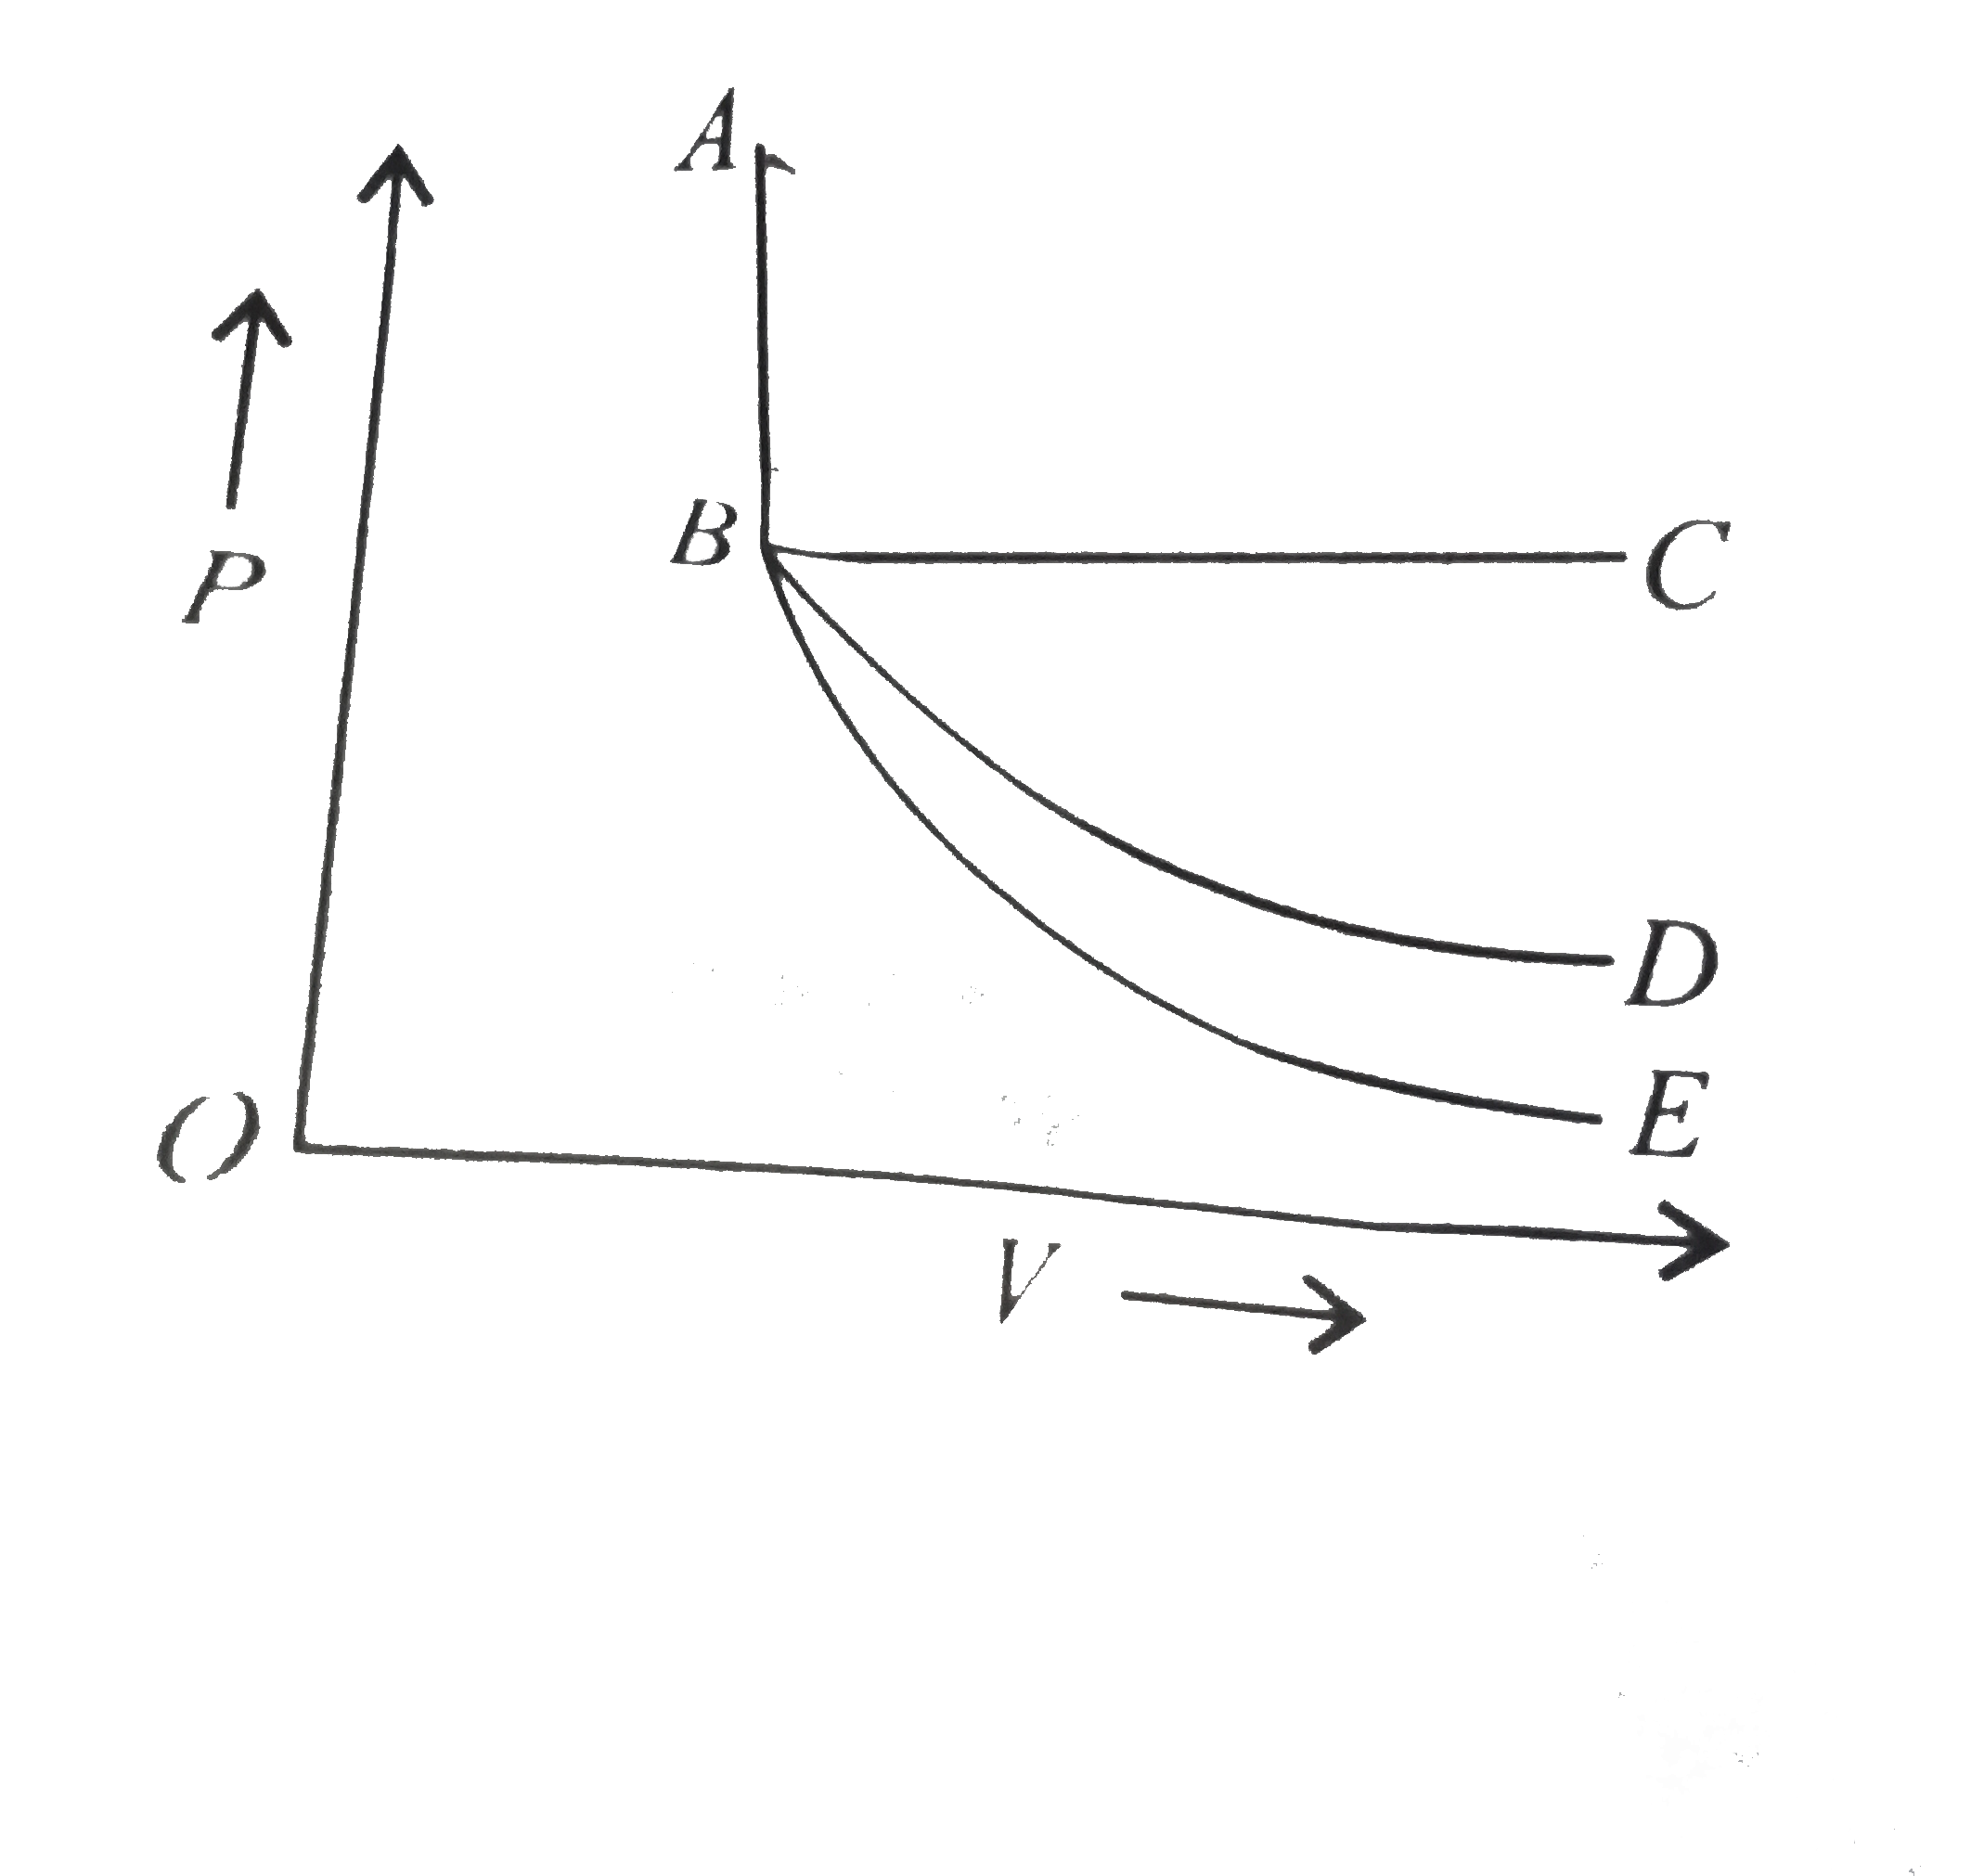
View SolutionIn P−V diagram shown below,
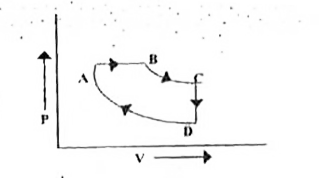
View SolutionA cyclic process ABCD is shown in the figure P-V diagram. Which of the following curves represent the same process?
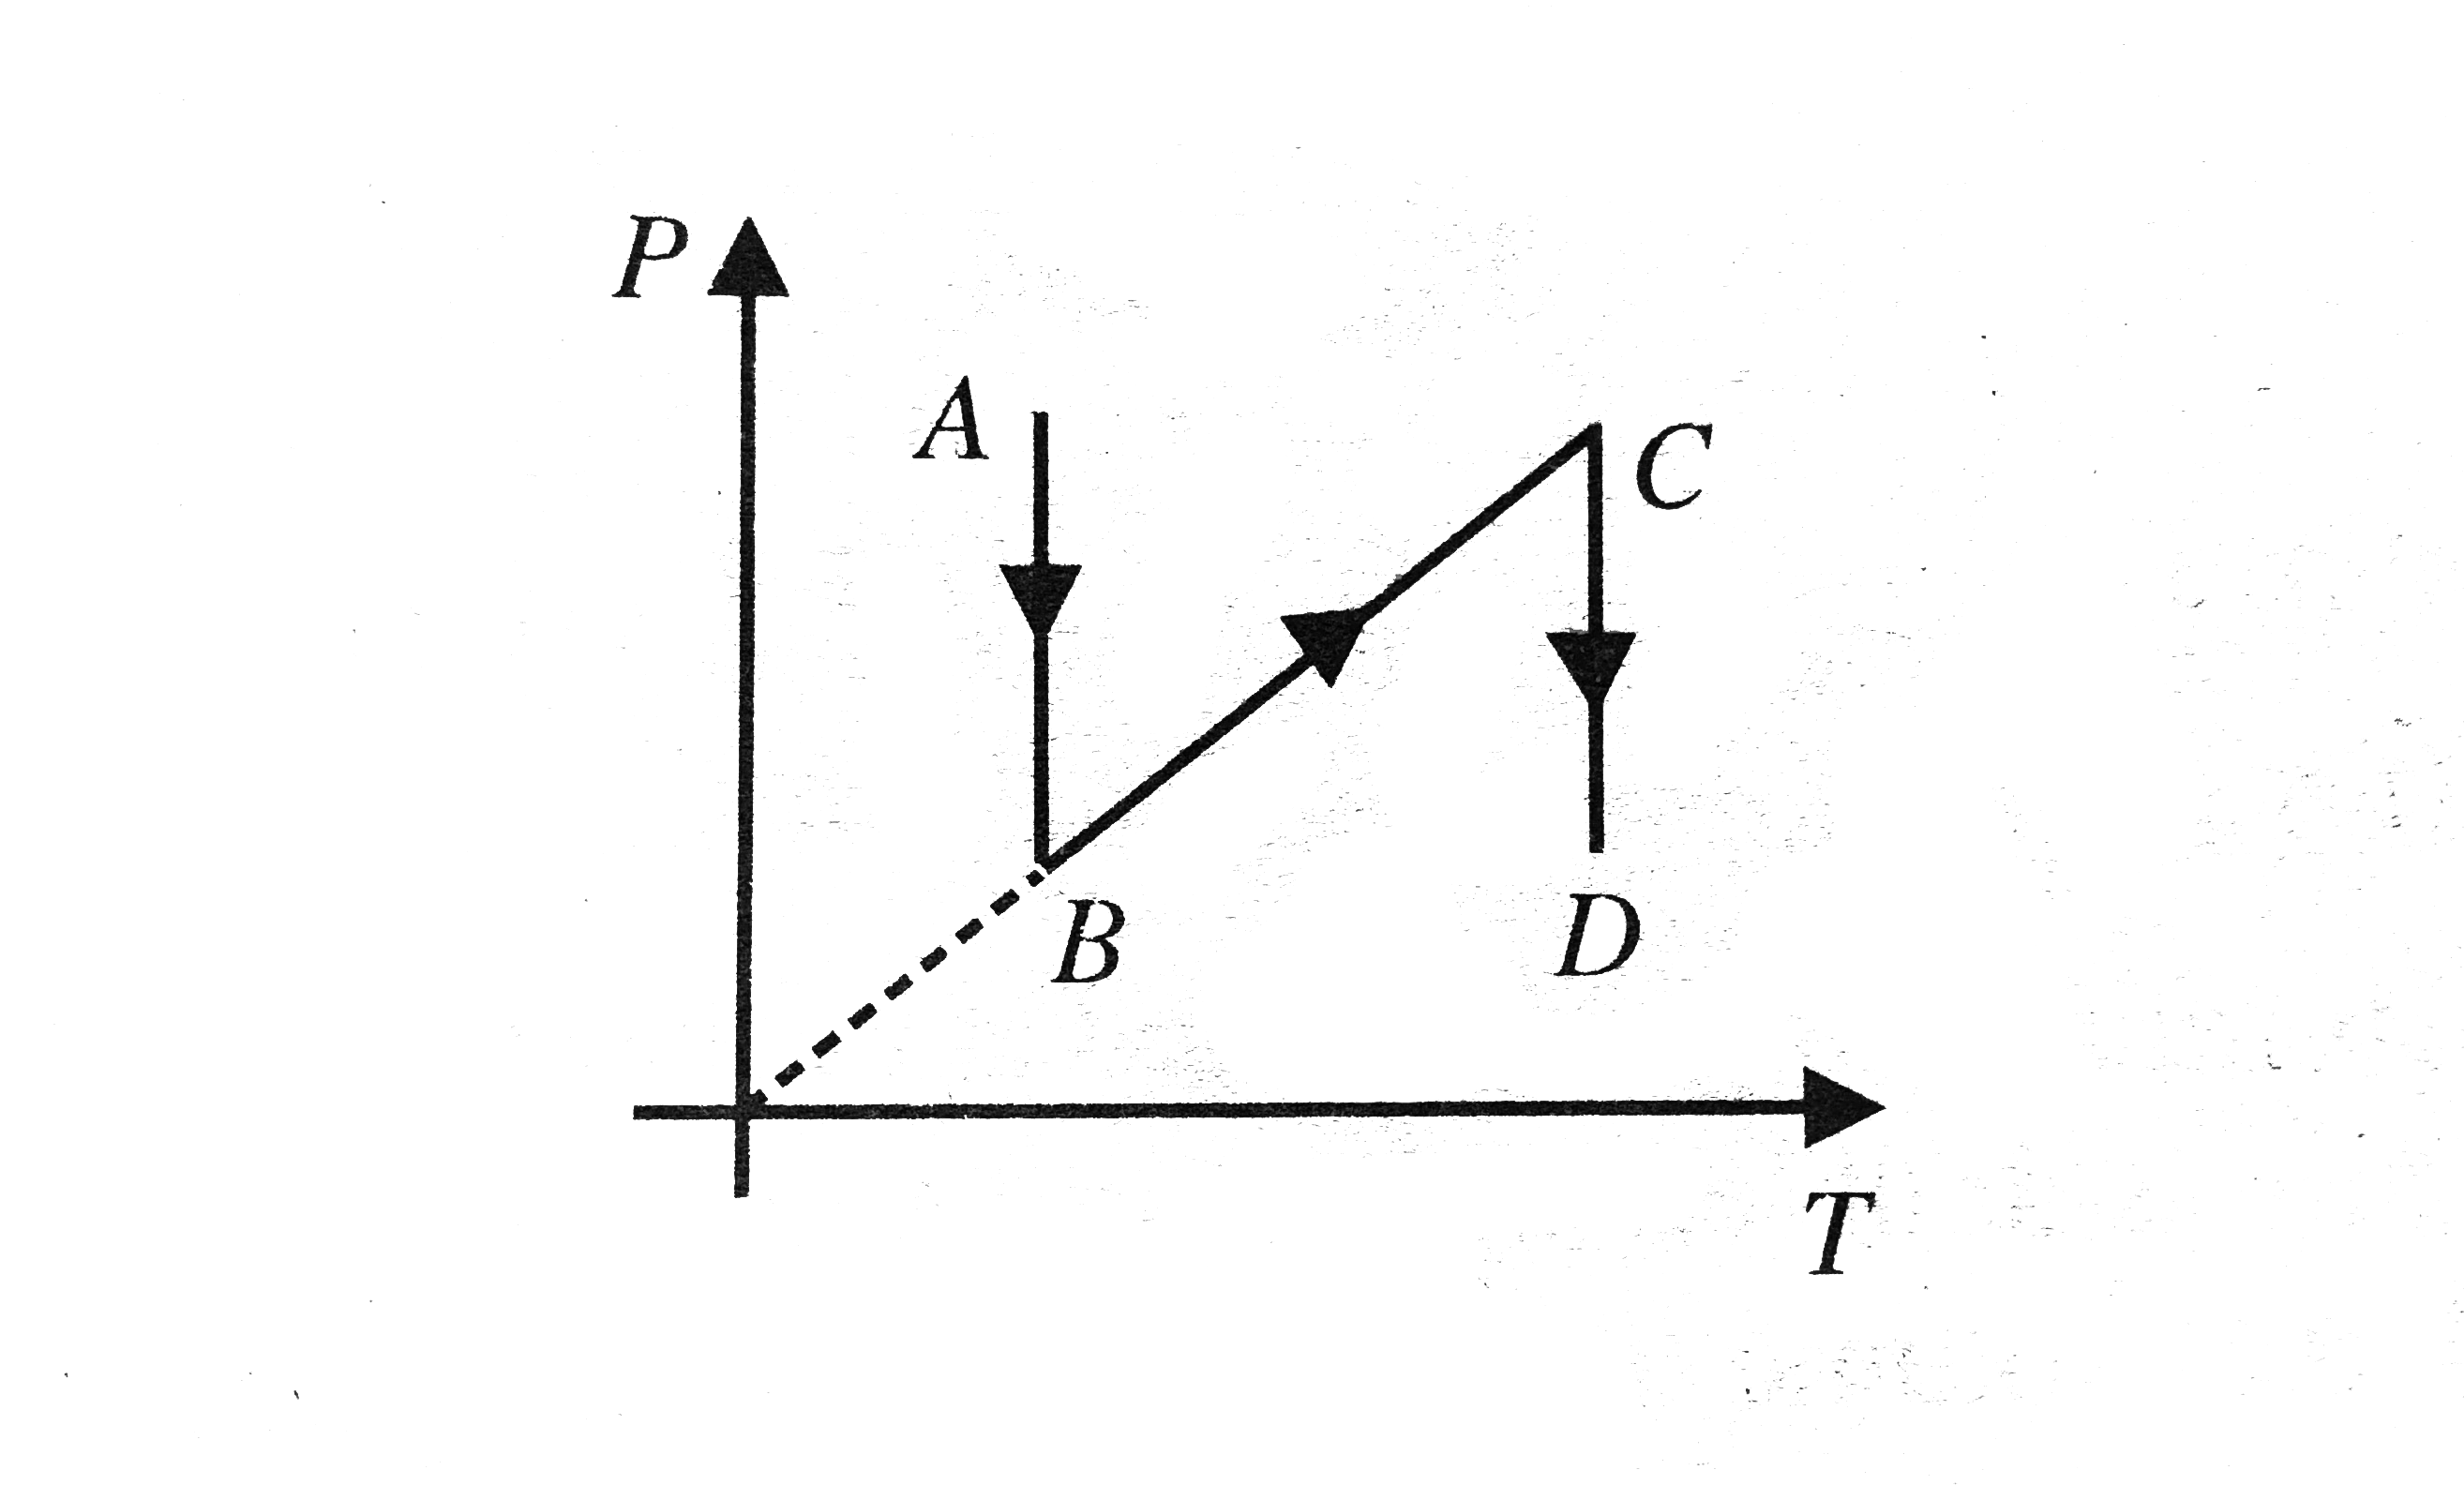
View SolutionP−T diagram is shown in Fig. Choose the corresponding V−T diagram.
View Solution

