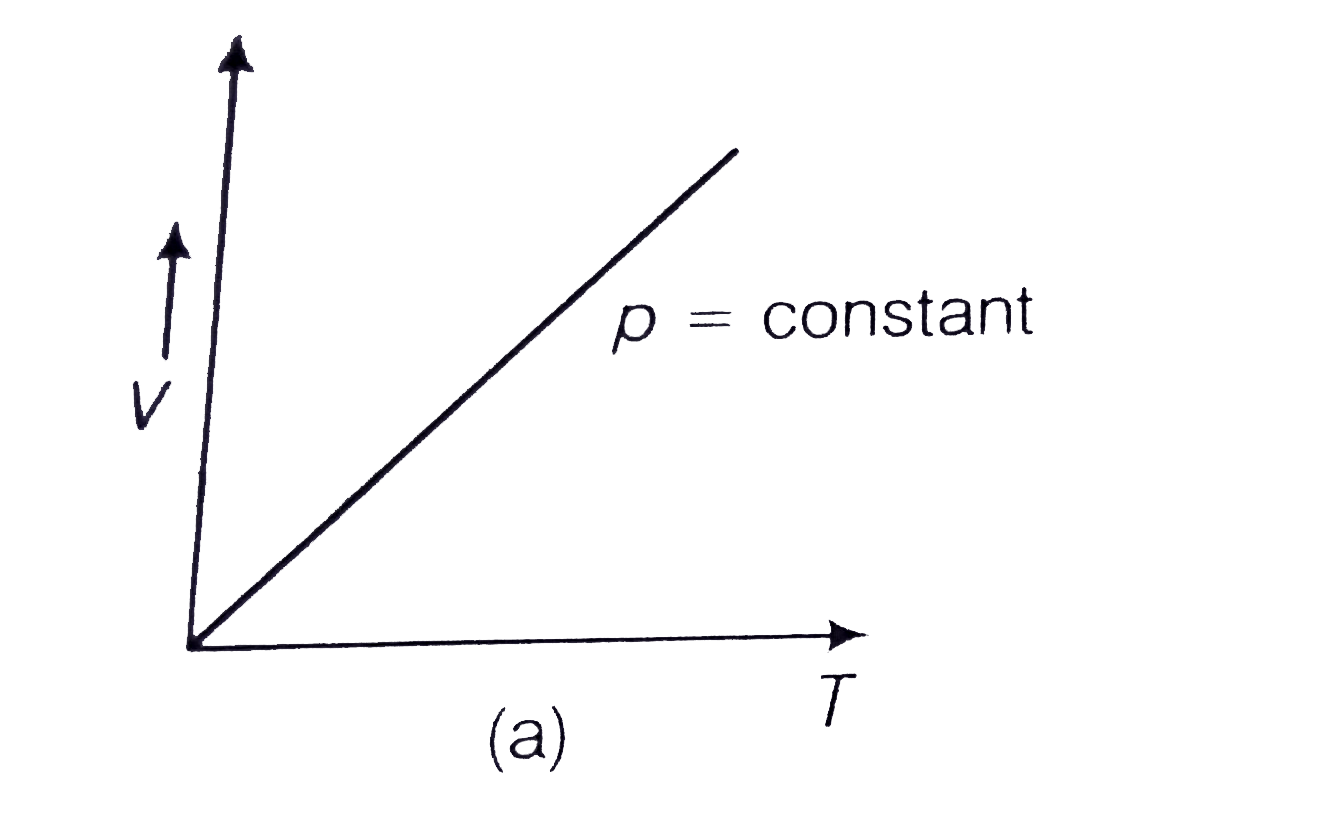
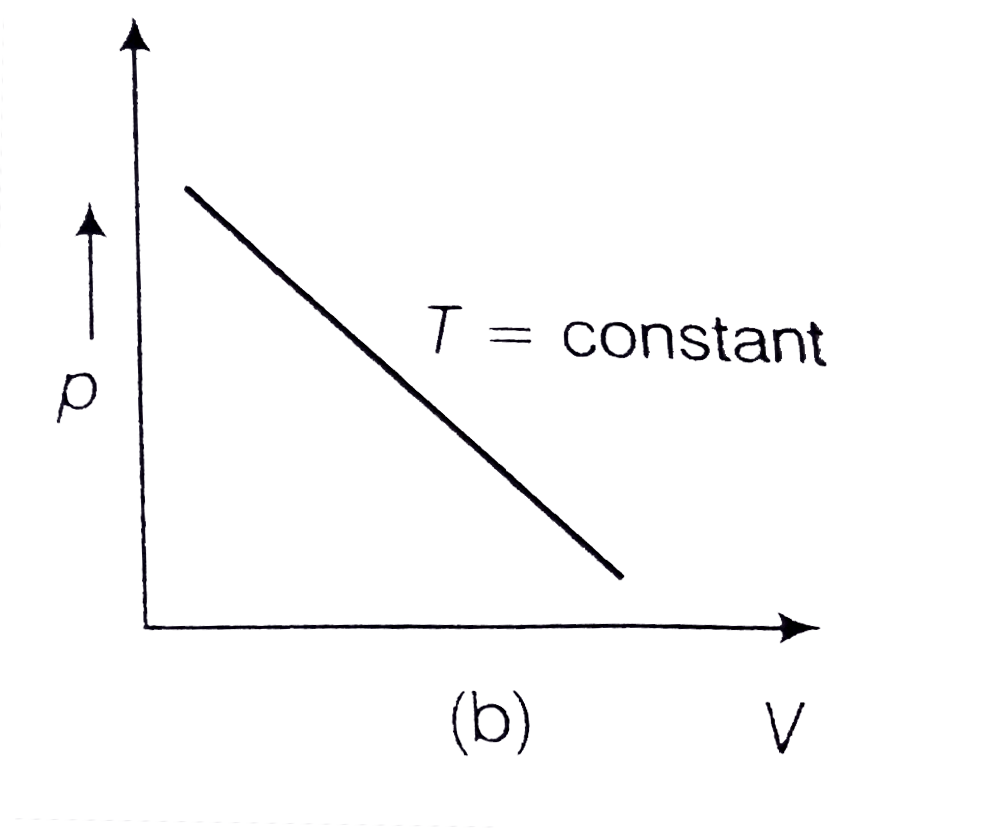
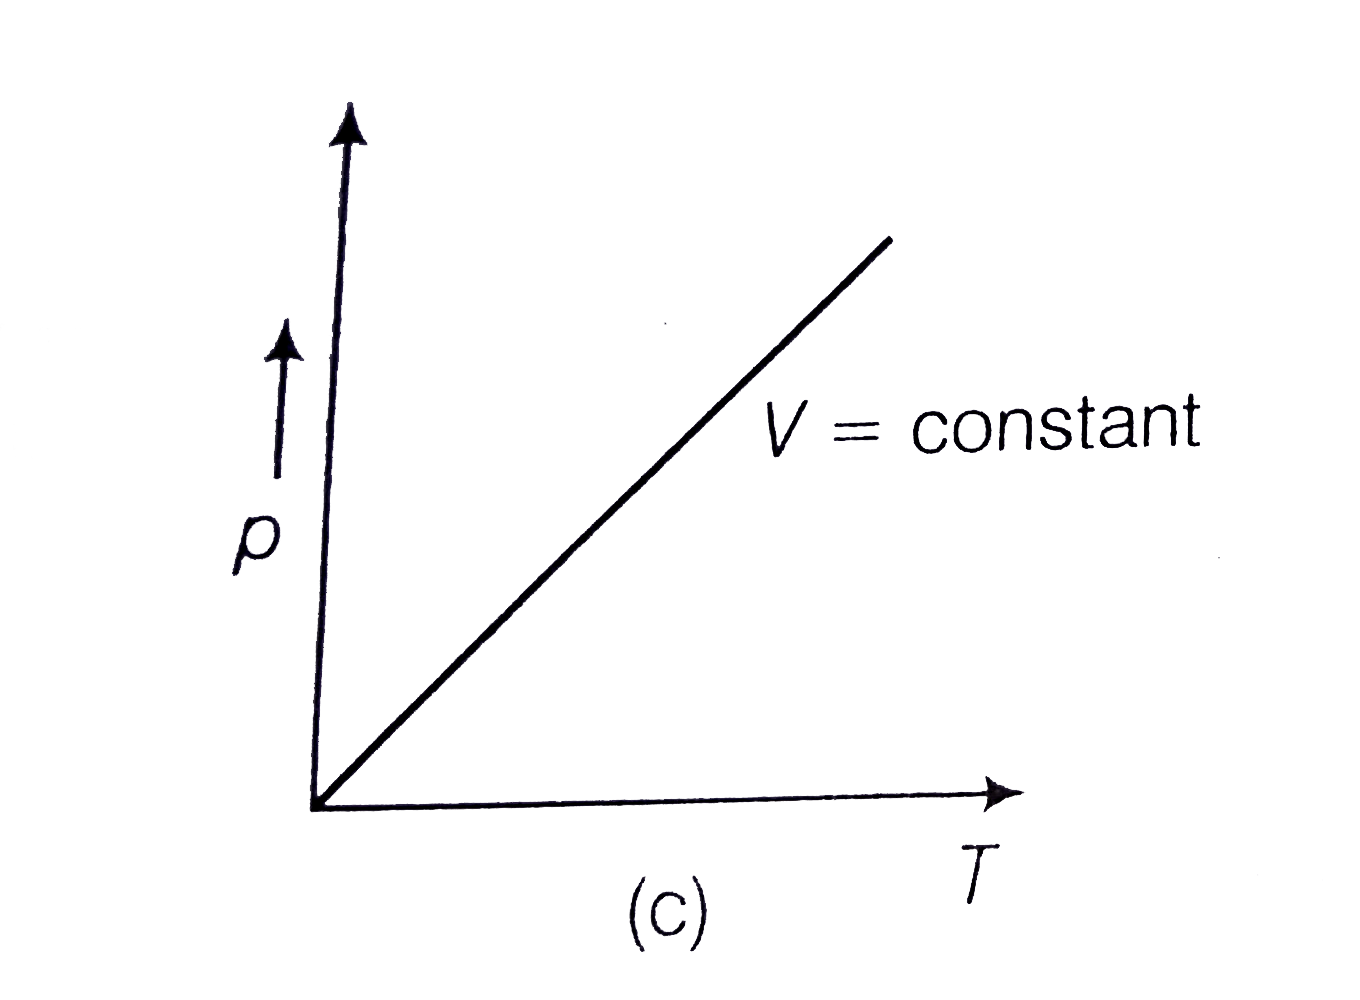
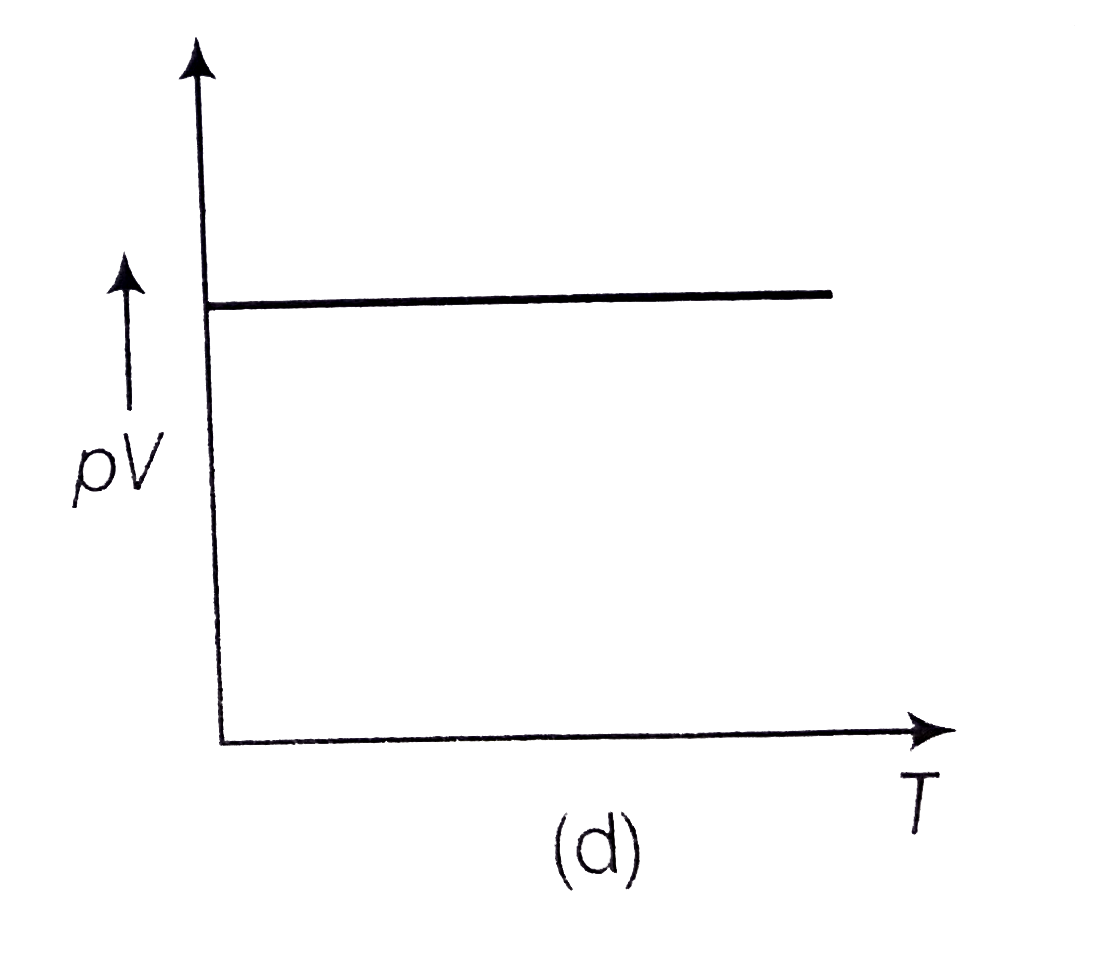
Which of the following diagrams (figure) depicts ideal gas behaviour?


To determine which of the given diagrams depicts ideal gas behavior, we can analyze each option based on the ideal gas law, which is expressed as:
PV=nRT
Where:
- P = Pressure
- V = Volume
- n = Number of moles of gas
- R = Ideal gas constant
- T = Temperature
We will evaluate each option step by step.
Step 1: Analyze Option A
In Option A, it is stated that pressure P is constant.
Using the ideal gas law:
PV=nRT
Since P is constant, we can express volume V as:
V=nRTP
Here, n, R, and P are constants, so we can rewrite this as:
V=kT
where k=nRP is a constant. This equation represents a straight line that passes through the origin when plotted as V versus T.
Conclusion for Option A: This option depicts ideal gas behavior.
Step 2: Analyze Option B
In Option B, it is stated that temperature T is constant.
Using the ideal gas law:
PV=nRT
Since T is constant, we have:
PV=nR⋅T
This means that PV is a constant. The relationship XY=k (where X=P and Y=V) describes a rectangular hyperbola.
Conclusion for Option B: This option does not depict ideal gas behavior.
Step 3: Analyze Option C
In Option C, it is stated that volume V is constant.
Using the ideal gas law:
PV=nRT
Since V is constant, we can express pressure P as:
P=nRTV
Here, n, R, and V are constants, so we can rewrite this as:
P=kT
where k=nRV is a constant. This equation represents a straight line that passes through the origin when plotted as P versus T.
Conclusion for Option C: This option also depicts ideal gas behavior.
Step 4: Analyze Option D
In Option D, we are asked to find the graph between PV versus T.
From the ideal gas law:
PV=nRT
This can be rearranged as:
PV=nR⋅T
This means that PV is directly proportional to T, which gives us a straight line that passes through the origin when plotted as PV versus T.
Conclusion for Option D: This option depicts ideal gas behavior.
Final Conclusion
Based on the analysis:
- Option A: Correct (depicts ideal gas behavior)
- Option B: Incorrect (does not depict ideal gas behavior)
- Option C: Correct (depicts ideal gas behavior)
- Option D: Correct (depicts ideal gas behavior)
Summary
The diagrams that depict ideal gas behavior are Option A, Option C, and Option D.
---
- P = Pressure
- V = Volume
- n = Number of moles of gas
- R = Ideal gas constant
- T = Temperature
In Option A, it is stated that pressure P is constant.
PV=nRT
Since P is constant, we can express volume V as:
V=nRTP
Here, n, R, and P are constants, so we can rewrite this as:
V=kT
where k=nRP is a constant. This equation represents a straight line that passes through the origin when plotted as V versus T.
In Option B, it is stated that temperature T is constant.
PV=nRT
Since T is constant, we have:
PV=nR⋅T
This means that PV is a constant. The relationship XY=k (where X=P and Y=V) describes a rectangular hyperbola.
In Option C, it is stated that volume V is constant.
PV=nRT
Since V is constant, we can express pressure P as:
P=nRTV
Here, n, R, and V are constants, so we can rewrite this as:
P=kT
where k=nRV is a constant. This equation represents a straight line that passes through the origin when plotted as P versus T.
In Option D, we are asked to find the graph between PV versus T.
PV=nRT
This can be rearranged as:
PV=nR⋅T
This means that PV is directly proportional to T, which gives us a straight line that passes through the origin when plotted as PV versus T.
Based on the analysis:
- Option A: Correct (depicts ideal gas behavior)
- Option B: Incorrect (does not depict ideal gas behavior)
- Option C: Correct (depicts ideal gas behavior)
- Option D: Correct (depicts ideal gas behavior)
The diagrams that depict ideal gas behavior are Option A, Option C, and Option D.
Topper's Solved these Questions
Similar Questions
Which of the following graphs is consistent with ideal gas behaviour?
View SolutionWhich of the following graphs is inconsistent with ideal gas behaviour ? (Assume n = constant)
View SolutionWhich of the following graph is incorrect for an ideal gas?

View SolutionWhich of the following reaction depicts the oxidsing behaviour of H2SO4?
View SolutionWhich of the following depict the same ?

View SolutionWhich of the following does not represent ideal gas equation?
View SolutionWhich of the following curve is correct for an ideal gas ?
View SolutionWhich of the following relation is correct for an ideal gas ?
View SolutionWhich of the following chemical reactions depicts the oxidizing behaviour of H2SO4 ?
View SolutionFor the given ideal gas equation PV=nRT, answer the following questions:
Which of the following does not represent ideal gas equation?
View Solution
