Consider a P−V diagram in which the path followed by one mole of perfect gas in a cyclinderical container is shown in (figure)
(a) Find the work done when the gas is taken from state 1 to state 2.
(b) What is the ratio of temperatures T1/T2,ifV2=2V1?
(c ) Given the internal energy for one mole of gas at temperature Tis(3/2)RT, find the heat supplied to the gas when it is taken from state 1 to 2, with V2=2V1.
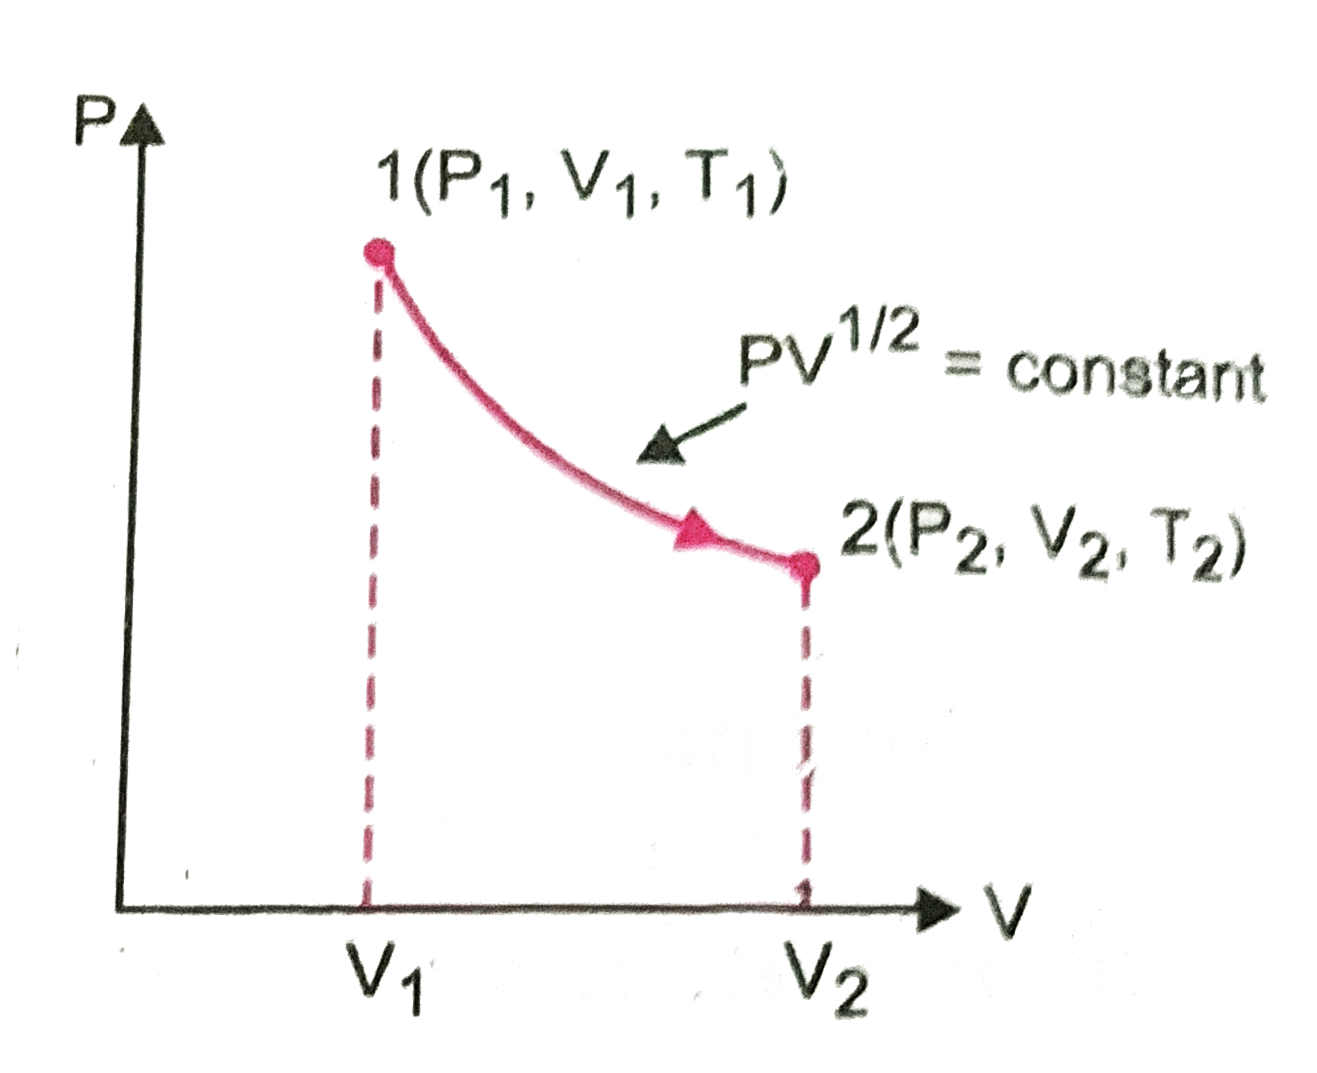
Let pV1/2 = Constant = K,p=K√V
(a) Work done for the process 1 to 2, ltBrgt W=∫V2V1pdV=K∫V2V1dV√V=K[√V1/2]V2V1=2K(√V2−√V1)
=2p1V1/21(√V2−√V1)=2p2V1/22(√V2−√V1)
(b) From ideal gas equation,
pV=nRT⇒T=pVnR=p√V√VnR
⇒ T=K√VnR (As,p√V=K)
Hence, T1=K√V1nR⇒T2=K√V2nR
⇒ T1T2=K√V1nRK√V2nR=√V1V2=√V12V1=1√2 (∵V2=2V1)
(c ) Given, internal energy of the gas = U=(32)RT
ΔU=U2−U1=32R(T2−T1)
=32RT1(√V−1) [∵T2=√2T1from(b)] ltbgt ΔW=2p1V1/21(√V2−√V1) ltBrgt =2p1V1/21(√2×√V1−√V1)
=2p1V1(√2−1)=2RT1(√2−1)
∵ ΔQ=ΔU+ΔW
=32RT1(√2−1)+2RT1(√2−1)
=(√2−1)RT1(2+3/2)
=(72)RT1(√2−1)
This is the amount of heat supplied.
Topper's Solved these Questions
- THERMODYNAMICS Book:NCERT EXEMPLAR ENGLISHChapter:THERMODYNAMICS Exercise:SHORT ANSWER TYPE QUESTIONS
Explore 6 Videos
- THERMAL PROPERTIES OF MATTERBook:NCERT EXEMPLAR ENGLISHChapter:THERMAL PROPERTIES OF MATTERExercise:Very short Answer type Questions
Explore 15 Videos
- UNITS AND MEASUREMENTS Book:NCERT EXEMPLAR ENGLISHChapter:UNITS AND MEASUREMENTS Exercise:Long Answer Type Questions
Explore 9 Videos
Similar Questions
Internal energy of n moles of helium at temperature T1K is equal to the internal energy of 2n moles of oxygen gas at temperature T2K then the value of T1T2will be
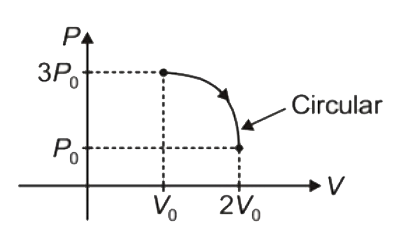
View SolutionOne mole of an ideal diatomic gas is taken through a process whose P−V diagram is shown in the figure. The work done by the gas is
View Solution
Knowledge Check
The P-V diagram of path followed by one mole of perfect gas in a cylindrical container is shown in figure, the work done when the gas is taken from state A to state B is
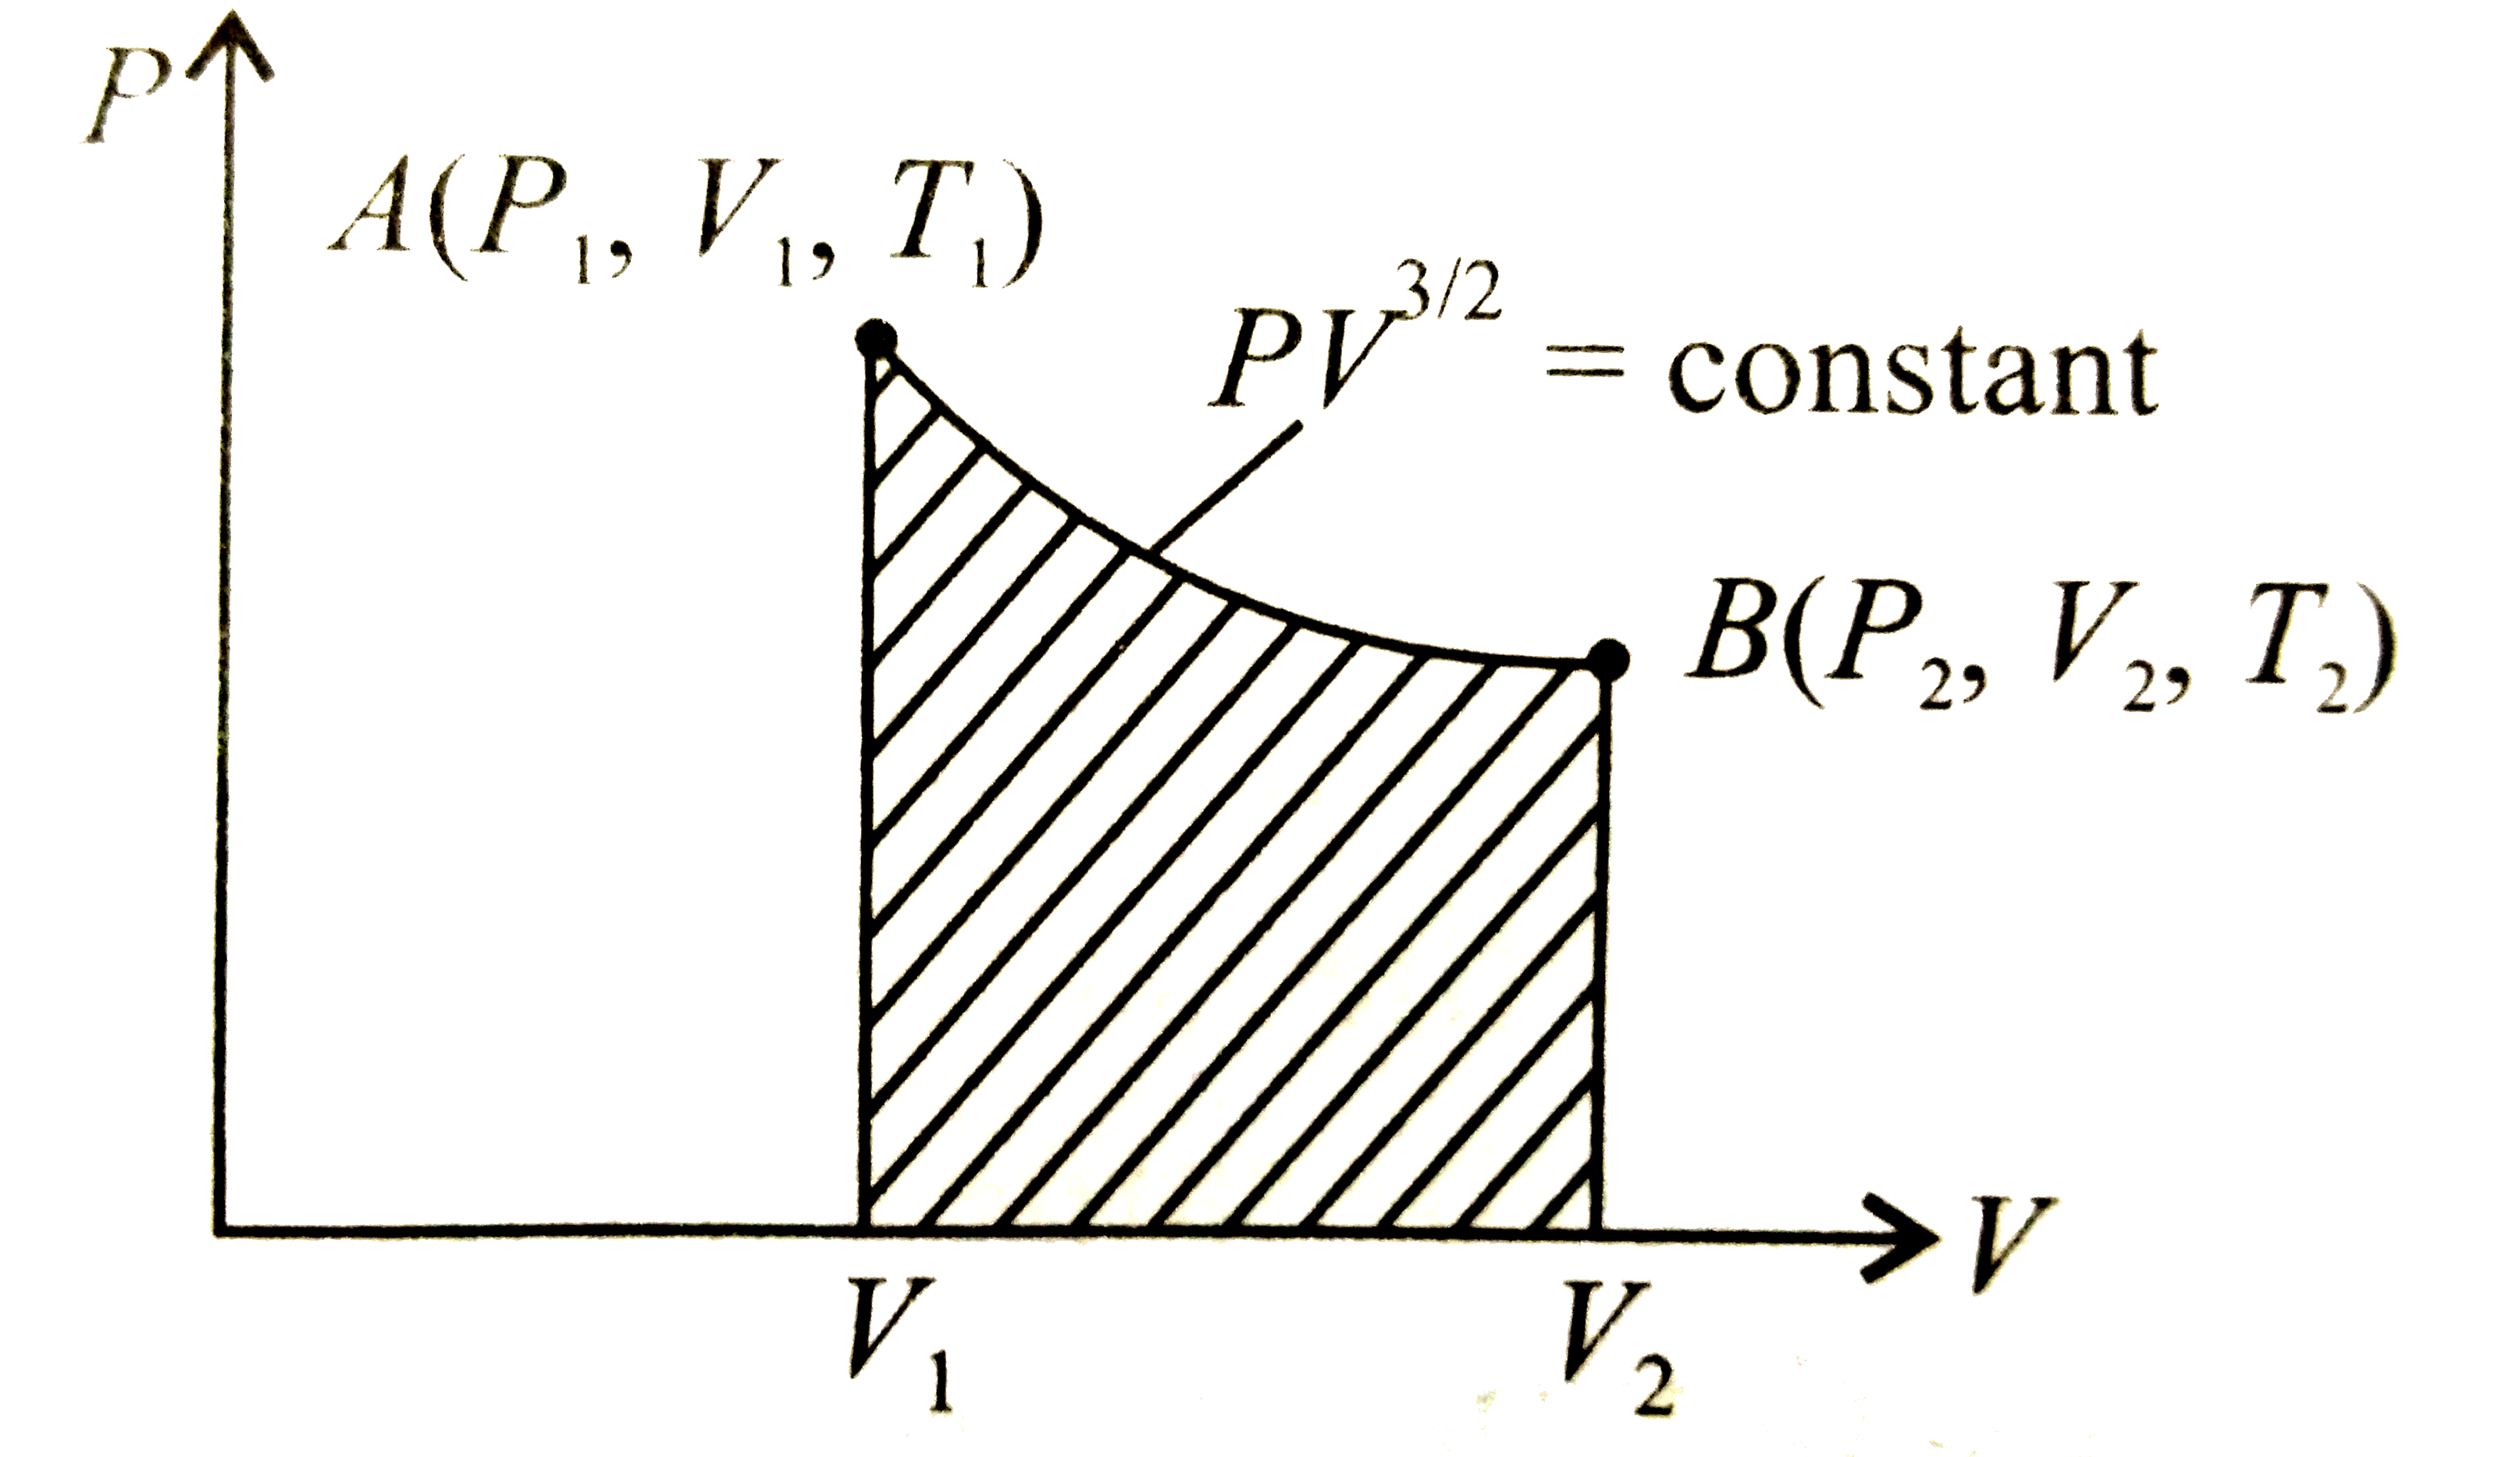 AnRTInV2V1BnRTInV1V2C2nRT((V1)−12−((V2)−12)D2nRTInV1V2
1 mole of an ideal gas in a cylindrical container have the P-V diagram as shown in figure.If V2=4V1 then the ratio of temperatures T1T2 will be
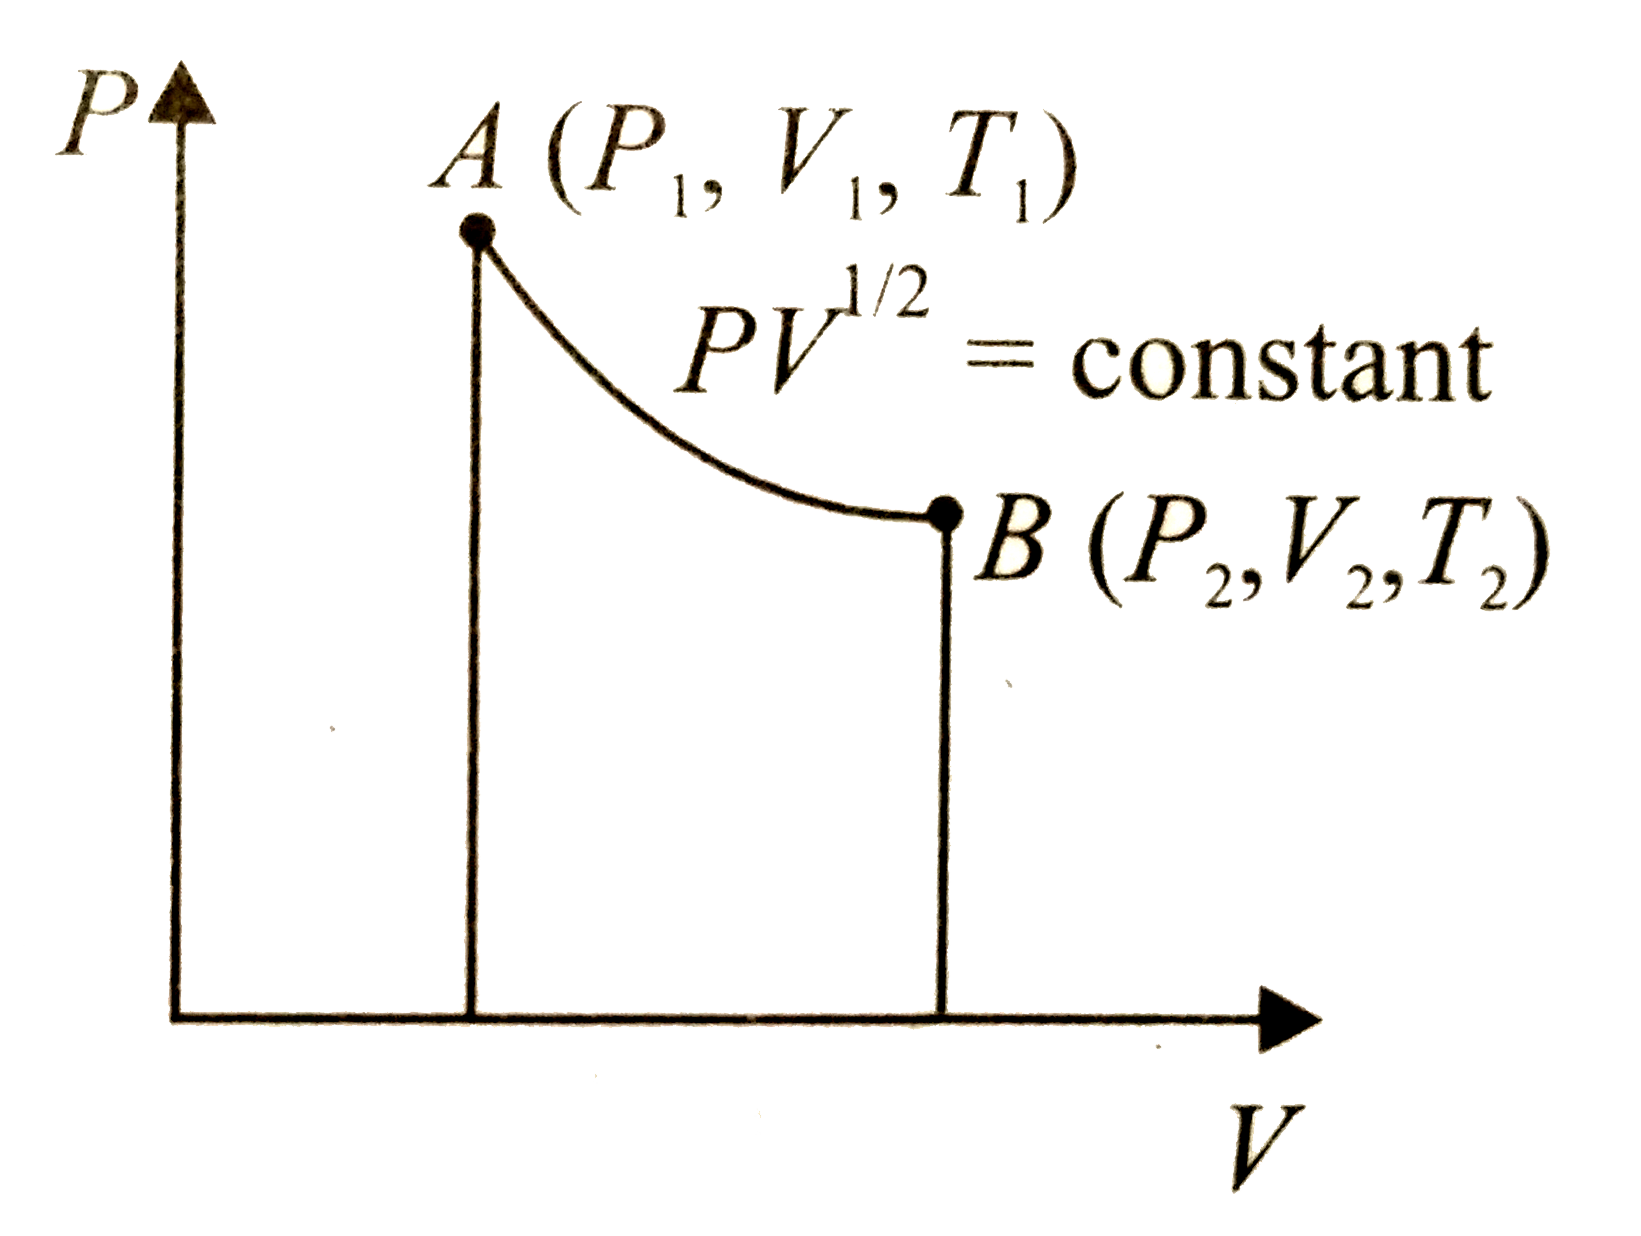 Aa. 12Bb.14Cc. 32Dd. 34
The isothermal diagram of a gas at three different temperatures T1,T2andT3, is show in the given figure .Then
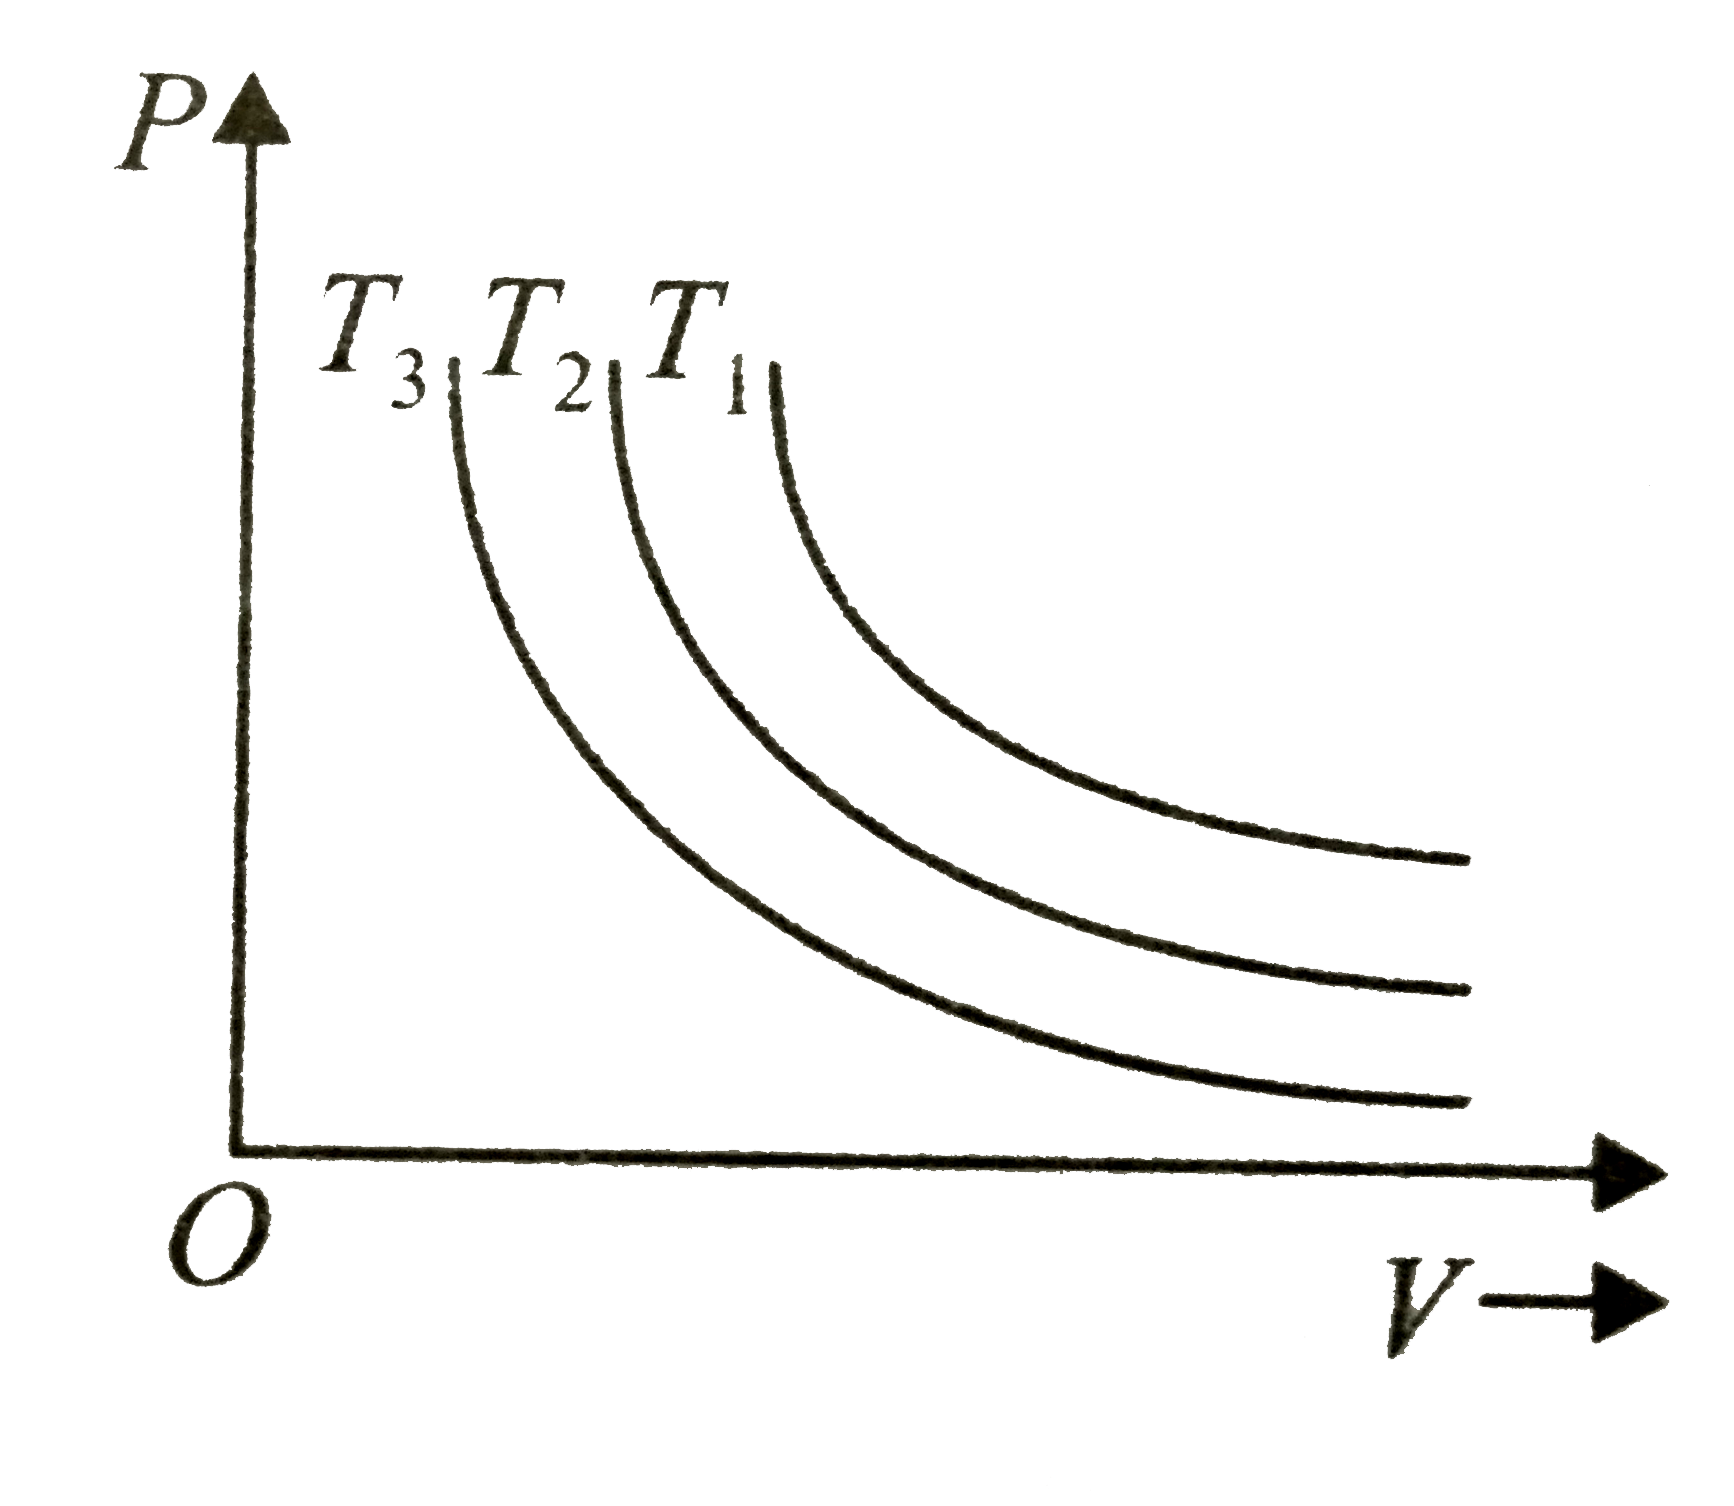 Aa.T1<T2<TBb. T1<T2>T3Cc.T1>T2>T3Dd.T1>T2<T3
One mole of an ideal gas is taken from state A to state B by three different processes (a) ACB, (b) ADB and (c ) AEB as shown in the P−V diagram. The heat absorbed by the gas is
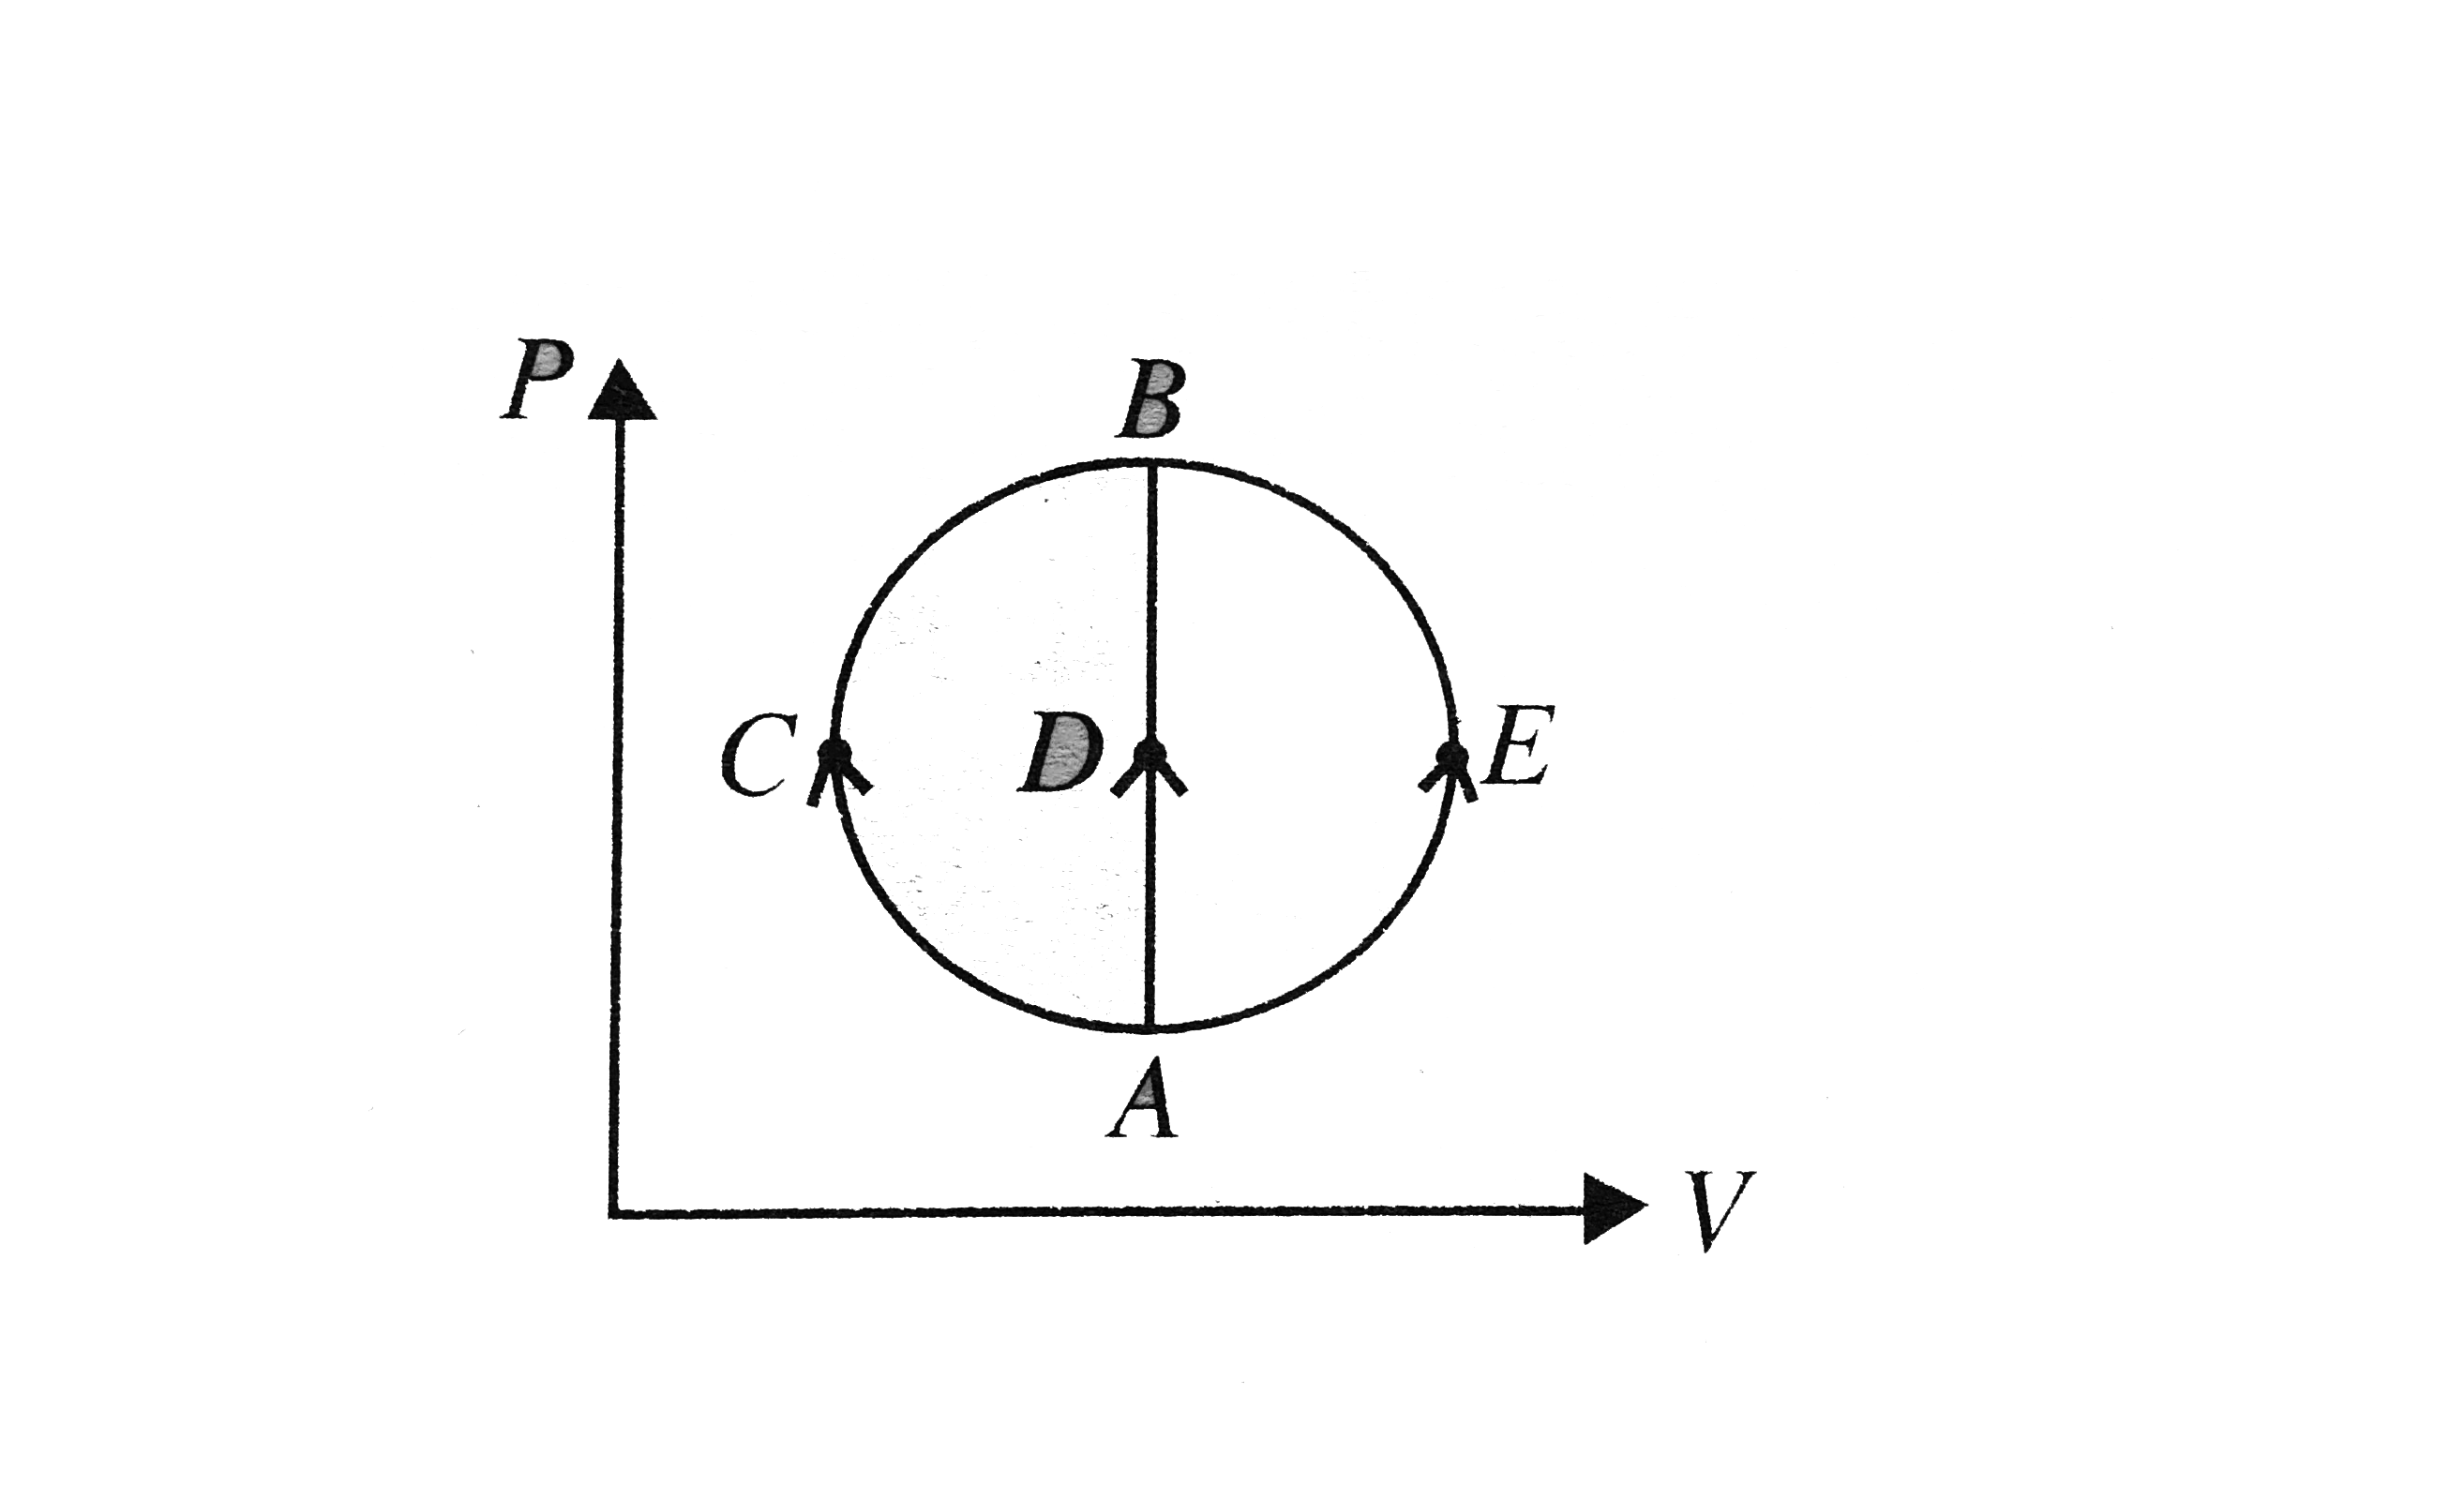
View SolutionOne mole of an ideal gas is taken from state A to state B by three different processes (a) ACB, (b) ADB and (c ) AEB as shown in the P−V diagram. The heat absorbed by the gas is

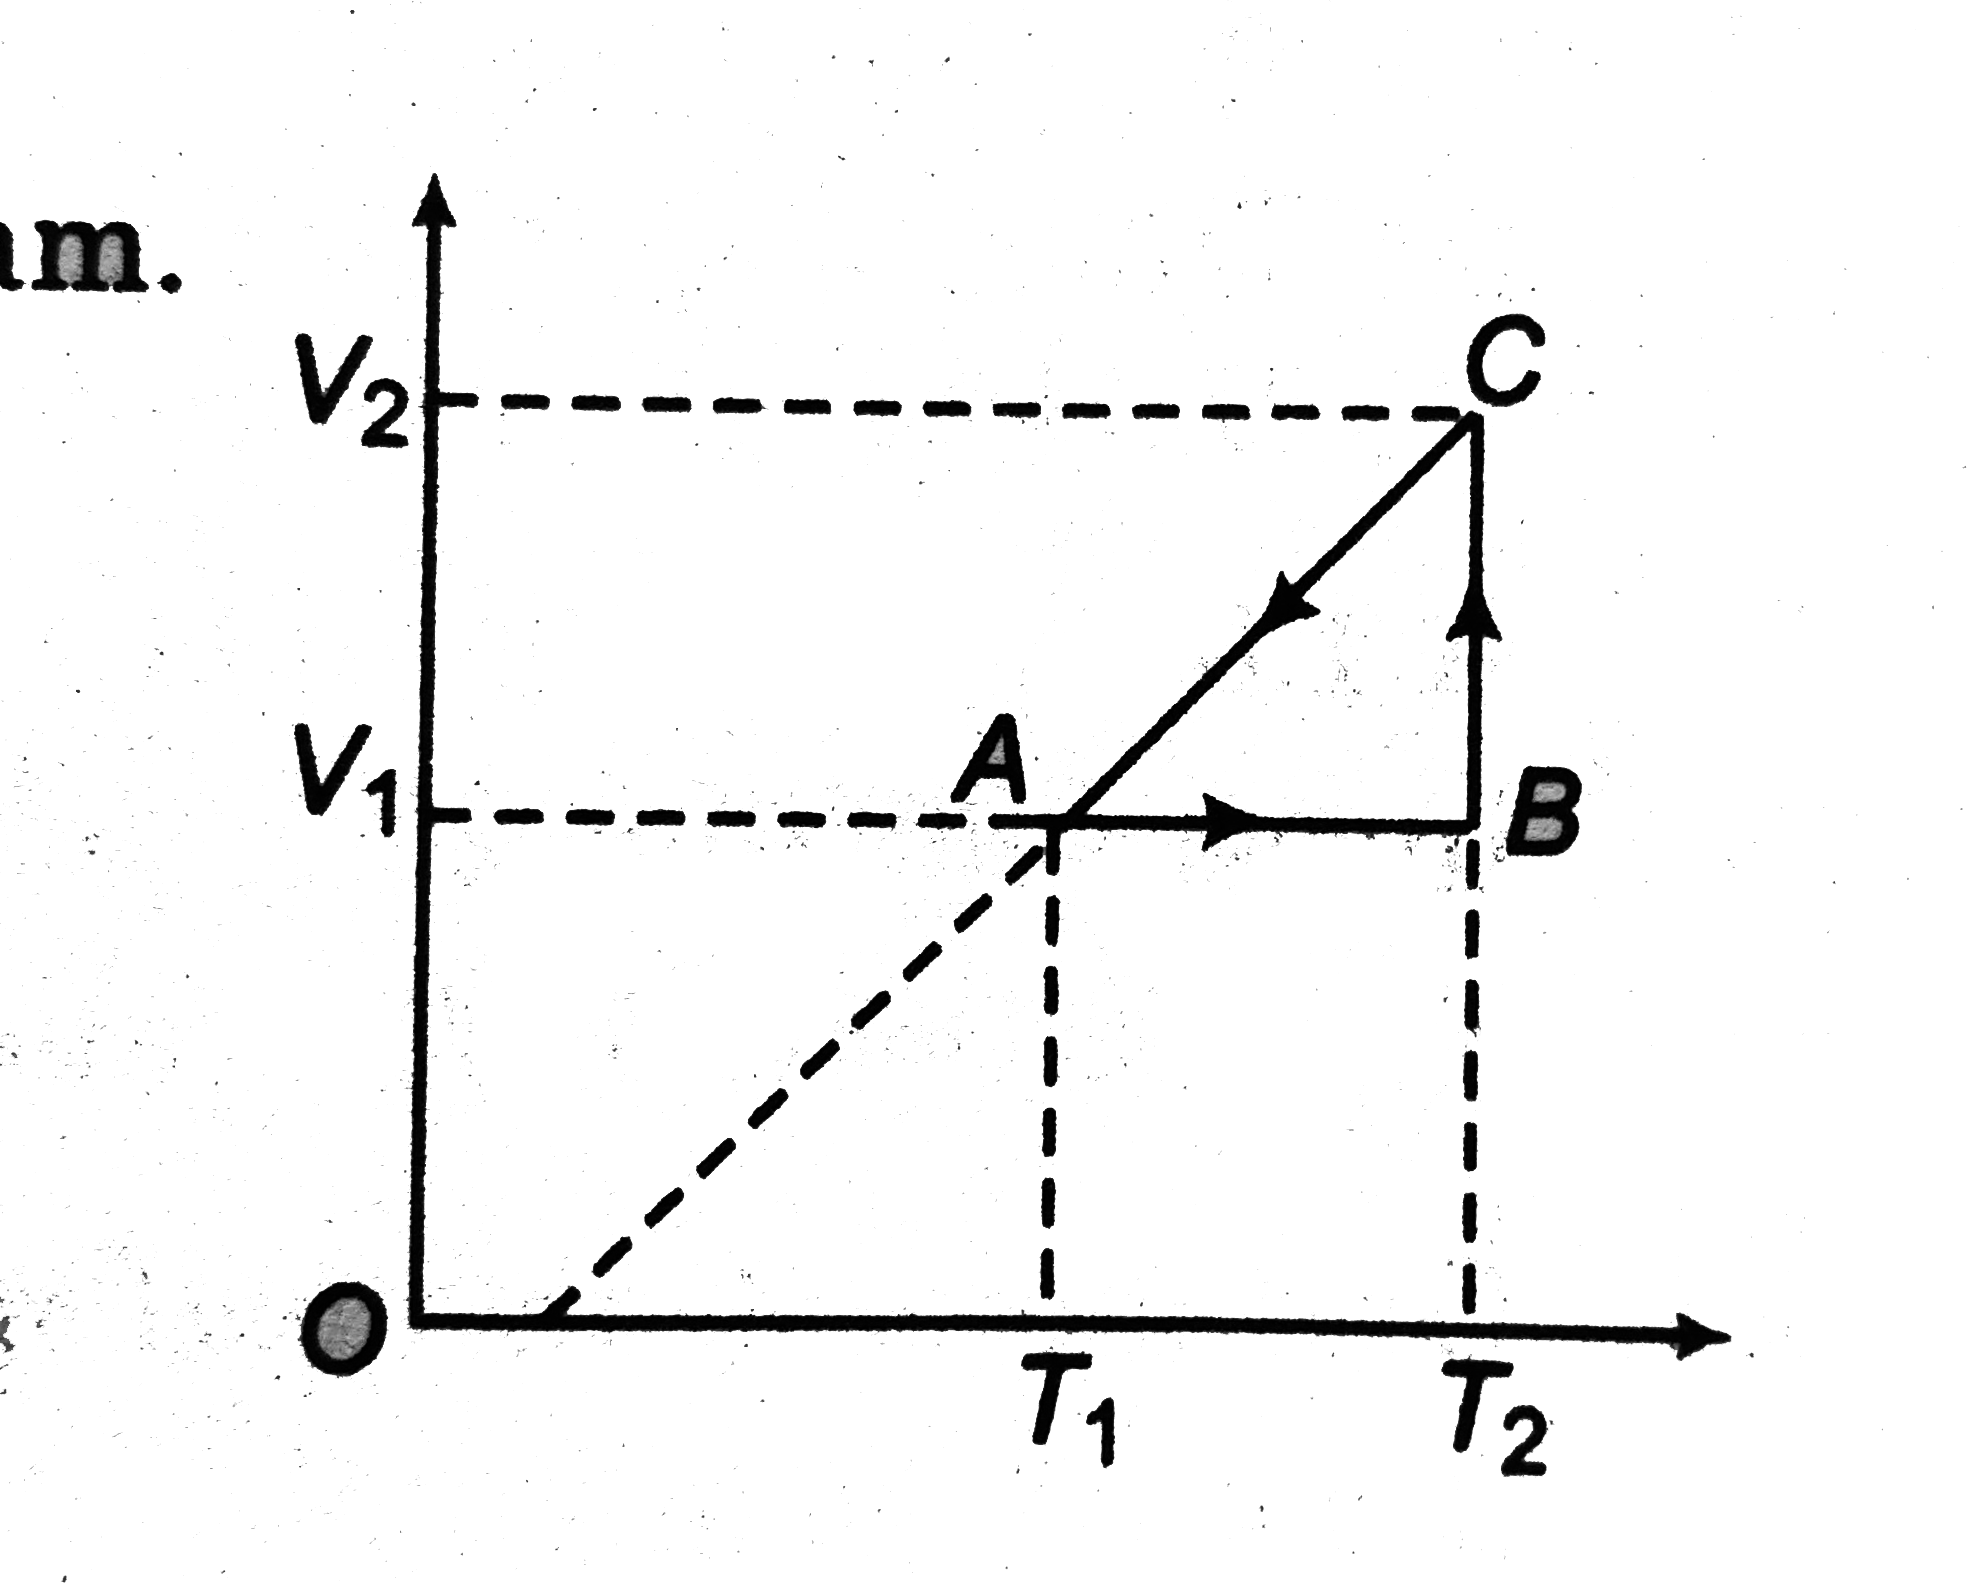
View SolutionThe cyclic process for 1 mole of an ideal gas is shown in the V-T diagram. The work done in AB, BC and CA respectively is
View SolutionTemperature of two moles of an ideal gas is increased by 300K in a process V=aT, where a is positive constant. Find work done by the gas in the given process.
View SolutionThe cyclic process for 1 mole of an ideal gas is shown in the V-T diagram. The work done in AB, BC and CA respectively is

View Solution

