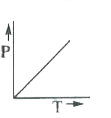
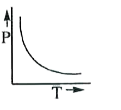
The graph obtained by taking vapour pressure (P) of a liquid on y-axis and temperature (T) on x-axis will beSolution in Telugu


The correct Answer is:C
Step by step video, text & image solution for The graph obtained by taking vapour pressure (P) of a liquid on y-axis and temperature (T) on x-axis will be by Chemistry experts to help you in doubts & scoring excellent marks in Class 12 exams.
Updated on:21/07/2023Topper's Solved these Questions
- SOLUTIONS Book:AAKASH SERIESChapter:SOLUTIONS Exercise:Objective Exercise -2
Explore 110 Videos
- SOLUTIONS Book:AAKASH SERIESChapter:SOLUTIONS Exercise:Objective Exercise -3 (PREVIOUS NEEET/AIPMT )
Explore 24 Videos
- SOLUTIONS Book:AAKASH SERIESChapter:SOLUTIONS Exercise:Subjective Exercise-3 (Problems)
Explore 7 Videos
- SOLIDS STATEBook:AAKASH SERIESChapter:SOLIDS STATEExercise:PRACTICE EXERCISE
Explore 63 Videos
- STATES OF MATTER Book:AAKASH SERIESChapter:STATES OF MATTER Exercise:ADDITIONAL PRACTICE EXERCISE -PRACTICE SHEET (ADVANCED) (LINKED COMPREHENSION TYPE QUESTIONS) (PASSAGE- IV)
Explore 2 Videos
Similar Questions
The number of Glucose molecules present in 10 ml of decimolar solution is
View SolutionA solution has a 1 : 4 mole ratio of pentane to hexane. The vapour pressures of pure hydrocarbons at 20∘C are 440 mm Hg for pentane and 120 mm Hg for hexane. The mole fraction of pentane in vapour phase woule be
View SolutionOne liter aqueous solutions contains 2×10⁻² kg glucose at 25∘C . Calculate the osmotic pressure of the solution.
View SolutionWhich of the following is considered as true amorphous solid
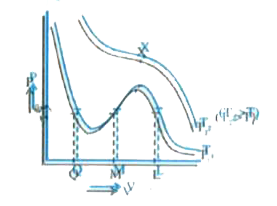
View SolutionAt a particular temperature and pressure for a real gas Van der Waal's equation can be written as:
(P+aV2m)(Vm−b)=RT

where Vm is molar volume of gas. This is cubic equation in the variable Vm and therefore for any single value of P & T there should be 3 values of Vm. Which are shown in graph as Q, M and L.
As temperature is made to increase at a certain higher temperature the three values of Vm becomes identical. The temperature, pressure & molar volume at point X are called Tc, Pc & Vc for real gas. The compressibility factor in terms of Pc, Vc and T is called Zc.
The expression of Van dcr Waal's constant 'a' can be given as
View SolutionIf a cooling curve is drawn taking t(s) along X-"axis" and temperature (theta) along Y-"axis" , it appers as
View SolutionIf a graph is plotted taking the temperature in Fahrenheit along the Y -axis and the corresponding temperature in Celsius along the X -axis, it will be a straight line
View SolutionThe pressure p for a gas is plotted against its absolute temperature T for two different volumes V_(1) and V_(2) . If p is plotted on y- axis and T on x- axis, then
View SolutionThe plots of (1)/(x_(A)) (on y-axis) (1)/(y_(A)) (on x-axis) is linear with slope and intercept respectively. p^(@)A = vapour pressure of pure liquid A p^(@)B = vapour pressure of pure liquid B
View SolutionFor a liquid the vapour pressure is given by log10P=−400T+10. Vapour pressure of the liquid is 10xmm Hg. The value of x will be-----
View SolutionFor a real gas which obeys van der waals equation, a graph is obtained by plotting the values of PV_(m) along the y-axis and the values of P along the x-axis. What is the value of intercept on the y-axis of the graph?
View SolutionWhich one of the following the graph between "log" p (on Y-axis) and 1/T (on X-axis)? (p=vapour pressure of a liquid,T=Absolute temprature)
View SolutionA graph is plotted by taking pressure along y-axis and centigrade temperature along X-axis for an ideal gas at constant volume. x intercept of the graph is
View SolutionWhich one of the following represents the graph between log P on Y - axis and 1/T on X - axis ? (P = vapour pressure of a liquid, T = absolute temperature)
View SolutionThe vapour pressure of a liquid varies with temperature as log P=−AT+I. The plot of
View Solution

