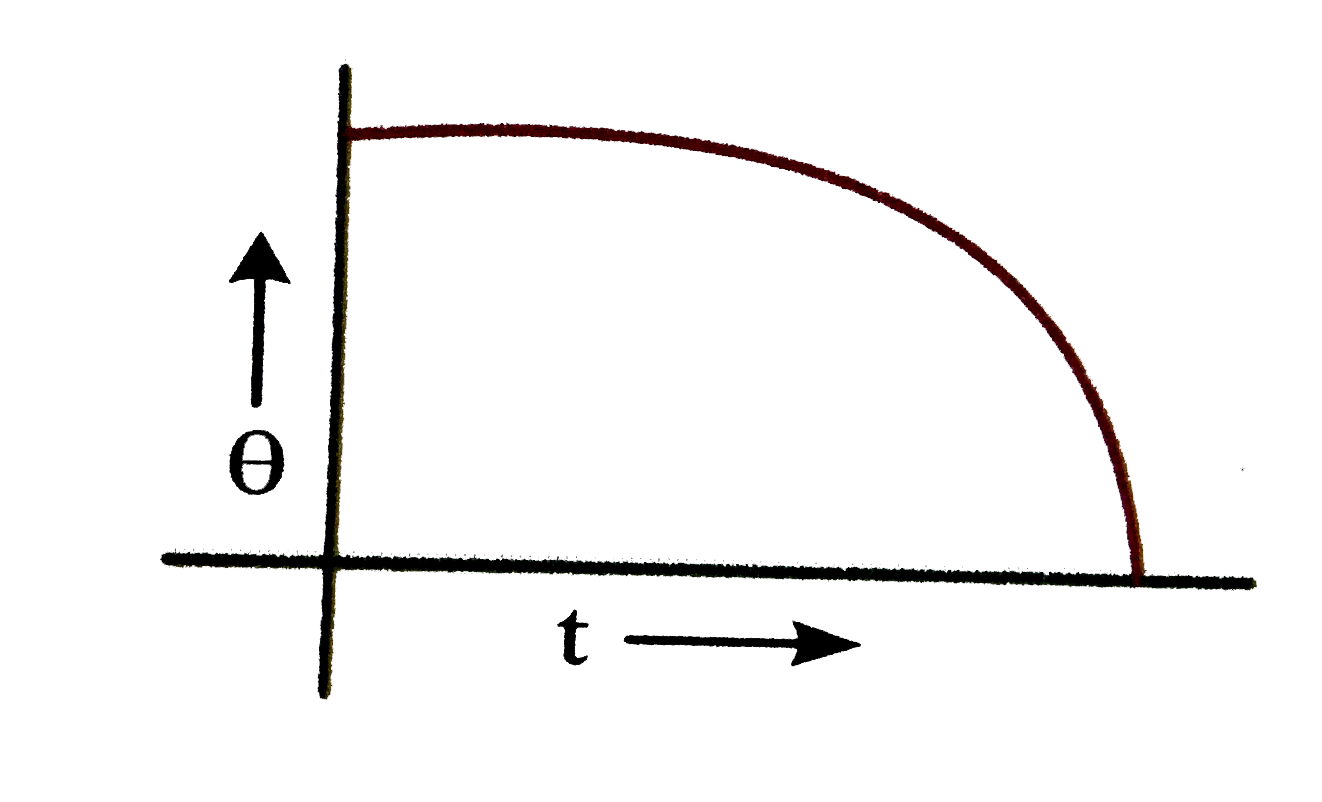
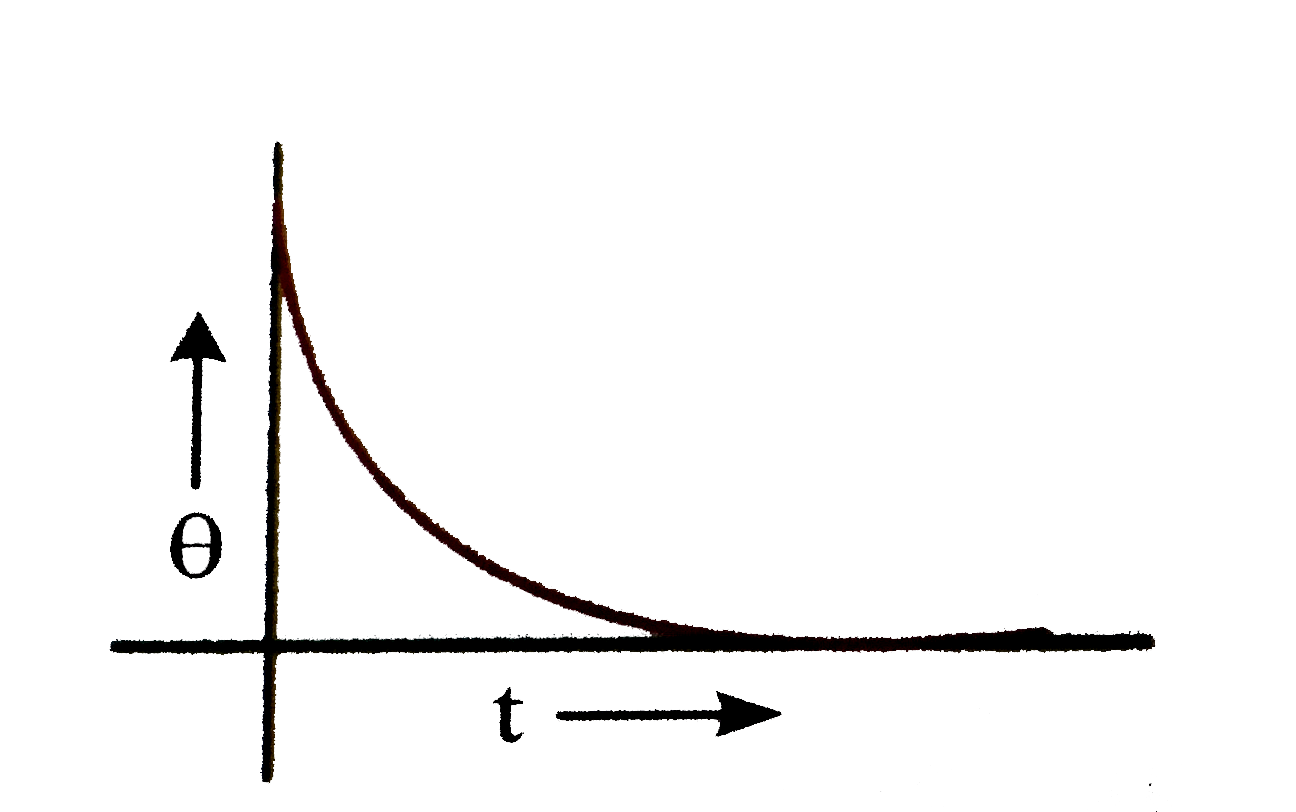
If a cooling curve is drawn taking t(s) along X−axis and temperature (θ) along Y−axis, it appers as


The correct Answer is:D
Step by step video, text & image solution for If a cooling curve is drawn taking t(s) along X-"axis" and temperature (theta) along Y-"axis", it appers as by Physics experts to help you in doubts & scoring excellent marks in Class 12 exams.
Updated on:21/07/2023Topper's Solved these Questions
- EXPERIMENTAL PHYSICSBook:NARAYNAChapter:EXPERIMENTAL PHYSICSExercise:Level-v(Single answer)
Explore 23 Videos
- EXPERIMENTAL PHYSICSBook:NARAYNAChapter:EXPERIMENTAL PHYSICSExercise:Multiple answer
Explore 6 Videos
- ELECTROSTATICS AND GAUSS LAWBook:NARAYNAChapter:ELECTROSTATICS AND GAUSS LAWExercise:Intergers type question
Explore 11 Videos
- MAGNETISMBook:NARAYNAChapter:MAGNETISMExercise:LEVEL-II (H.W)
Explore 24 Videos
Similar Questions
A graph is plotted by taking pressure along y-axis and centigrade temperature along X-axis for an ideal gas at constant volume. x intercept of the graph is
View SolutionA particle starts with uniform acceleration. Draw a graph taking the displacement(s) of the particle along y-axis and time(t) along x-axis. What is the curve known as?
View Solution
Knowledge Check
In the experiment to study relationship between temperture of the body and time if a graph is plotted between log(θ−θ0) taking it along y−axis and time (t) taking along x−along, it is
AexponentialBstraight lineCparabolaDhyperbolaA graph is drawn with a force along y-axis and time along x-axis. The area under the graph represent–
AMomentumBCoupleCMoment of the forceDImpulse of the forceAn electromagnetic wave is propagating along Y-axis. Then
AOscillating electric field is along X-axis and oscillating magnetic field is along Y-axisBOscillating electric field is along Z-axis and oscillating magnetic field is along X-axisCBoth oscillating electric and magnetic fields are along Y-axis, but phase difference between them is 90∘DBoth oscillating electric and magnetic fields are mutually perpendicular in arbitrary directions
If a graph is plotted by taking spectral emissive power along y-axis and wavelength along X-axis then the area below the graph above wavelength axis is
View SolutionIf a graph is plotted taking the temperature in Fahrenheit along the Y-axis and the corresponding temperature in Celsius along the X-axis, it will be a straight line
View SolutionIf force vector is along X-axis and radius vector is along Y-axis then the direction of torque is
View SolutionThe graph between the object distance along the X-axis and image distance along Y-axis for a convex lens is
View SolutionIf a graph is plotted taking the temperature in fahrenheit along the Y- axis and the corresponding temperature in celsins along X - axis it will be straight line
View Solution

