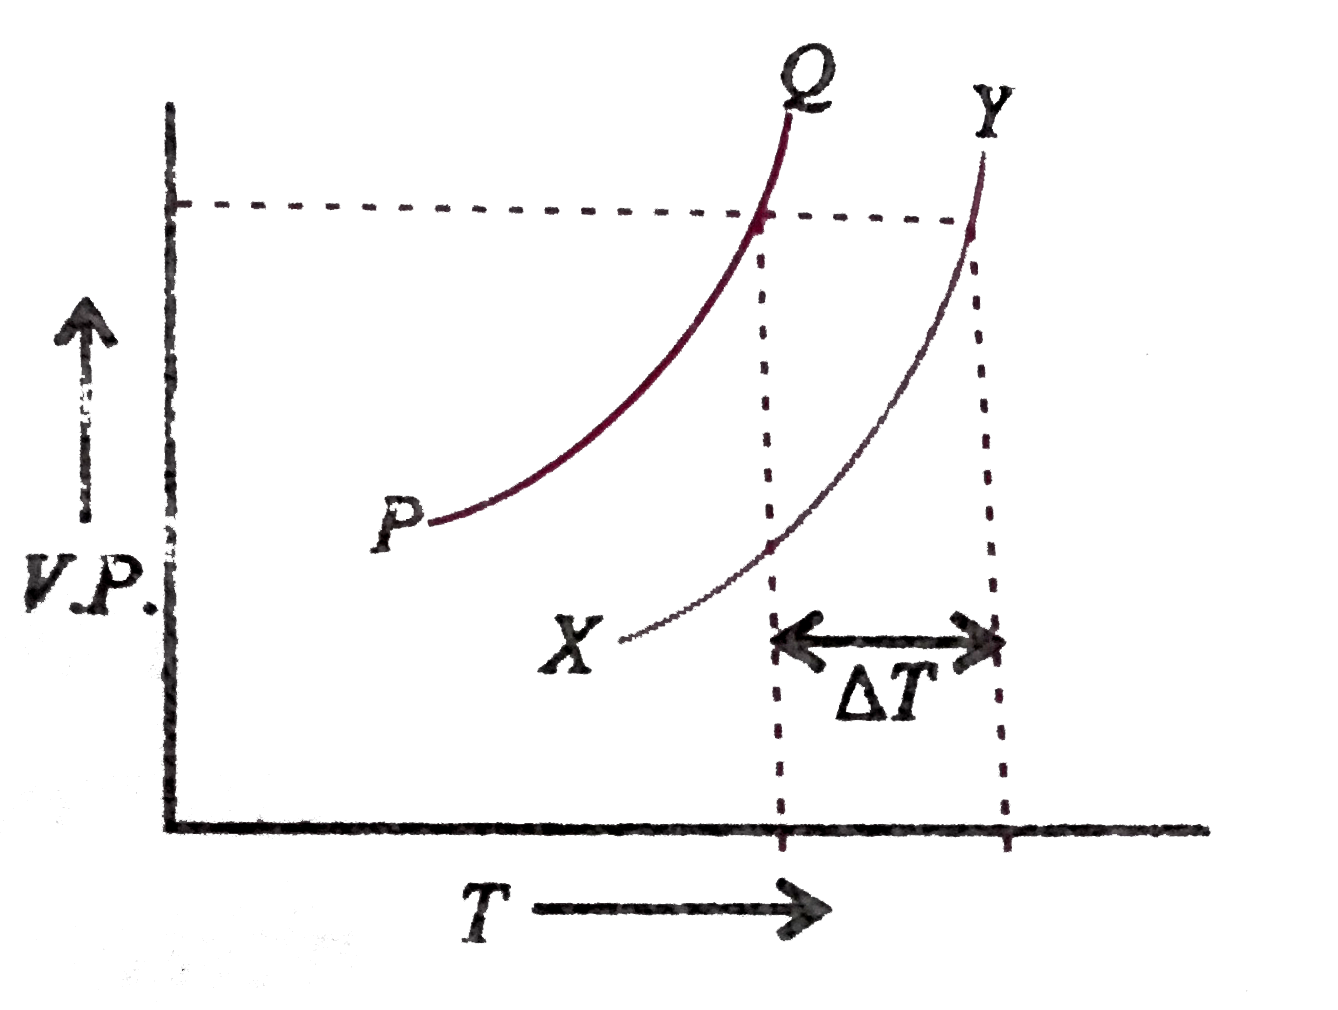
Which one of the following represents the graph between log P on Y - axis and 1/T on X - axis ? (P = vapour pressure of a liquid, T = absolute temperature)
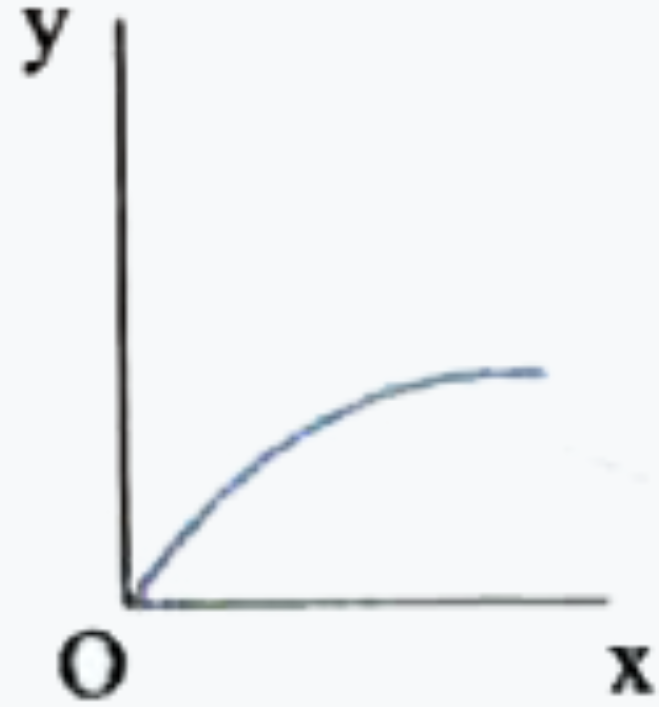
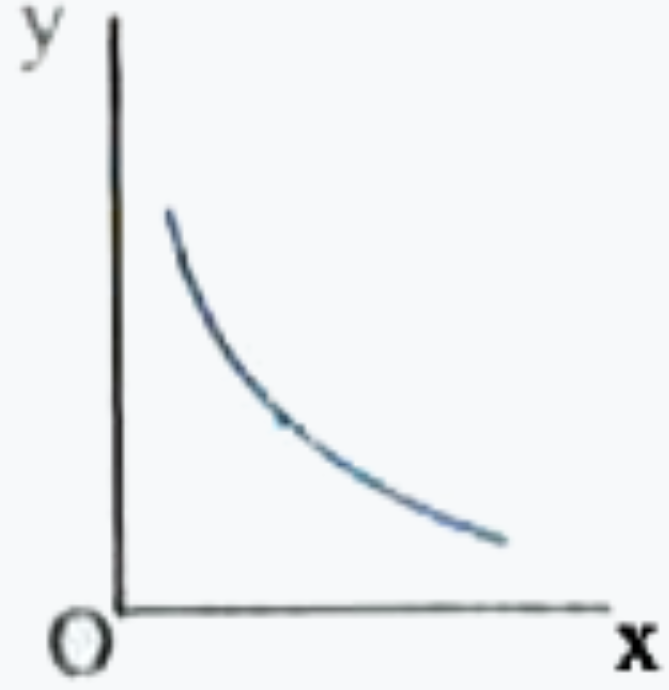
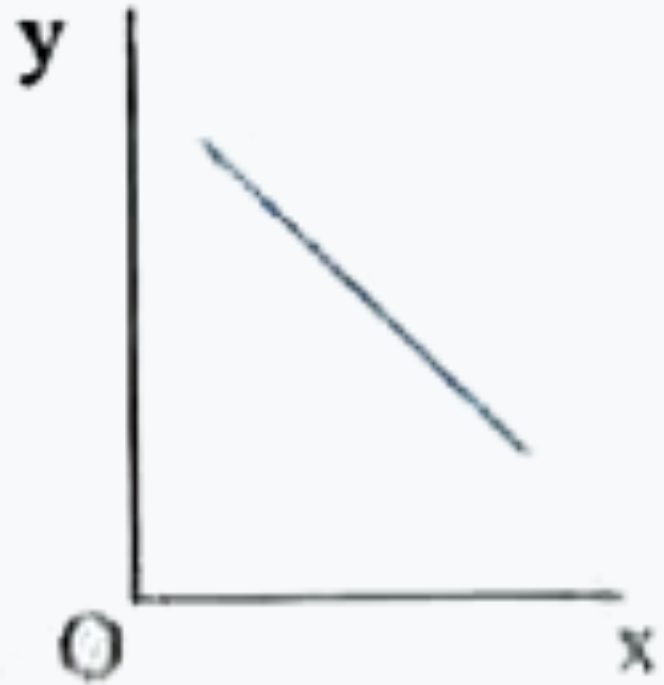
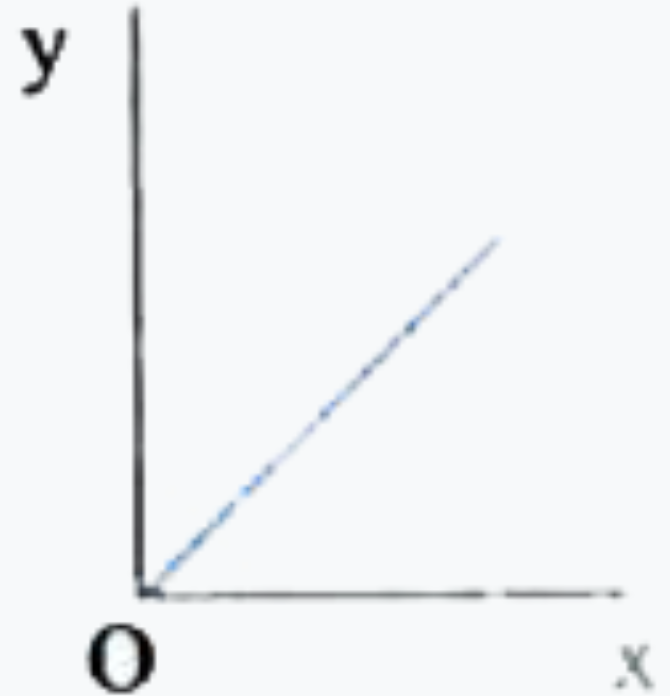
The correct Answer is:C
To solve the question regarding the graph between log P (vapor pressure) on the Y-axis and 1/T (inverse of absolute temperature) on the X-axis, we can follow these steps:
1. Understand the Clausius-Clapeyron Equation:
The Clausius-Clapeyron equation describes the relationship between vapor pressure and temperature. It is given by:
dlnPdT=ΔHvapRT2
where P is the vapor pressure, T is the absolute temperature, R is the universal gas constant, and ΔHvap is the enthalpy of vaporization.
2. Rearranging the Equation:
We can rearrange the equation to express lnP in terms of T:
dlnP=ΔHvapRT2dT
3. Integrating Both Sides:
To find the relationship, we integrate both sides. The left side integrates to lnP, and the right side can be integrated with respect to T:
lnP=∫ΔHvapR⋅1T2dT+C
This gives:
lnP=−ΔHvapRT+C
4. Converting to Logarithm Base 10:
Since we need logP, we convert lnP to logP:
logP=lnP2.303=−ΔHvap2.303R⋅1T+C2.303
5. Identifying the Linear Relationship:
The equation can be rearranged to the form of a straight line:
logP=−ΔHvap2.303R⋅1T+constant
Here, y=logP, x=1T, and the slope m=−ΔHvap2.303R.
6. Graph Interpretation:
The graph of logP versus 1T will be a straight line with a negative slope, indicating that as 1T increases (or temperature decreases), logP decreases.
Conclusion:
The graph between logP on the Y-axis and 1T on the X-axis is a straight line with a negative slope.
The Clausius-Clapeyron equation describes the relationship between vapor pressure and temperature. It is given by:
dlnPdT=ΔHvapRT2
where P is the vapor pressure, T is the absolute temperature, R is the universal gas constant, and ΔHvap is the enthalpy of vaporization.
We can rearrange the equation to express lnP in terms of T:
dlnP=ΔHvapRT2dT
To find the relationship, we integrate both sides. The left side integrates to lnP, and the right side can be integrated with respect to T:
lnP=∫ΔHvapR⋅1T2dT+C
This gives:
lnP=−ΔHvapRT+C
Since we need logP, we convert lnP to logP:
logP=lnP2.303=−ΔHvap2.303R⋅1T+C2.303
The equation can be rearranged to the form of a straight line:
logP=−ΔHvap2.303R⋅1T+constant
Here, y=logP, x=1T, and the slope m=−ΔHvap2.303R.
The graph of logP versus 1T will be a straight line with a negative slope, indicating that as 1T increases (or temperature decreases), logP decreases.
The graph between logP on the Y-axis and 1T on the X-axis is a straight line with a negative slope.
Topper's Solved these Questions
- SOLUTIONS & COLLIGATIVE PROPERTIES Book:NARAYNAChapter:SOLUTIONS & COLLIGATIVE PROPERTIES Exercise:EXERCISE : 1 (H.W)
Explore 29 Videos
- SOLUTIONS & COLLIGATIVE PROPERTIES Book:NARAYNAChapter:SOLUTIONS & COLLIGATIVE PROPERTIES Exercise:EXERCISE : 2 (C.W)
Explore 65 Videos
- SOLUTIONS & COLLIGATIVE PROPERTIES Book:NARAYNAChapter:SOLUTIONS & COLLIGATIVE PROPERTIES Exercise:C.U.Q.
Explore 40 Videos
- SOLID STATESBook:NARAYNAChapter:SOLID STATESExercise:EXERCISE-4
Explore 18 Videos
- SURFACE CHEMISTRY Book:NARAYNAChapter:SURFACE CHEMISTRY Exercise:EXERCISE - 4
Explore 22 Videos
Similar Questions
Knowledge Check
By plotting log x/m on y-axis and log P on x-axis we s hould get
A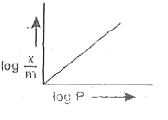 B
B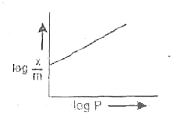 C
C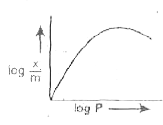 D
D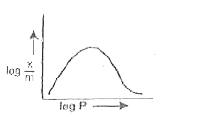
Which of these curves represents Henry's law graph between partial pressure on y - axis mole fraction of gas on x - axis
A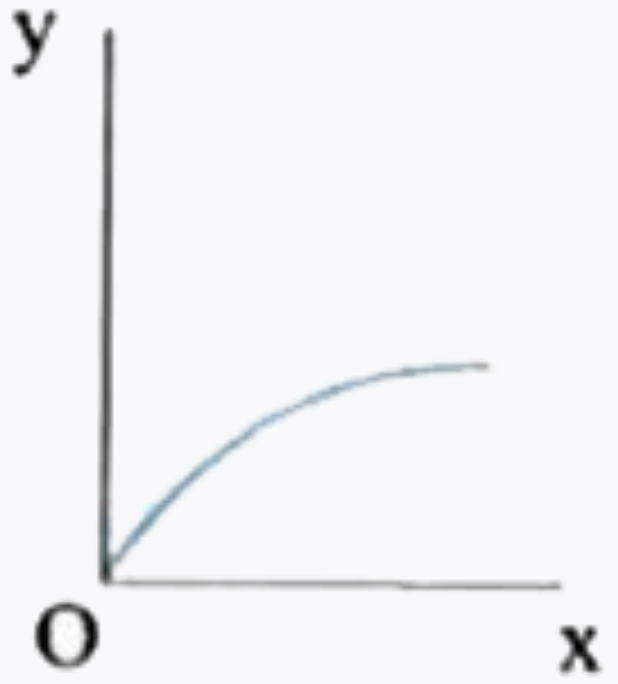 B
B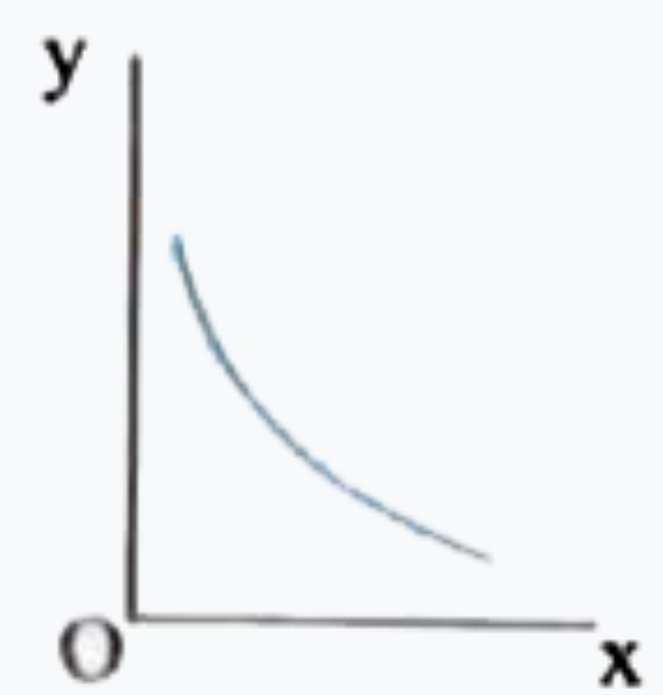 C
C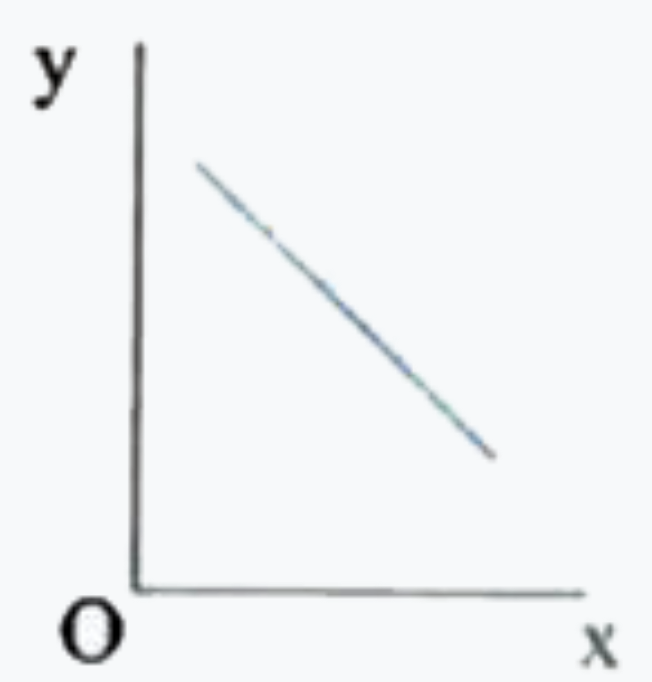 D
D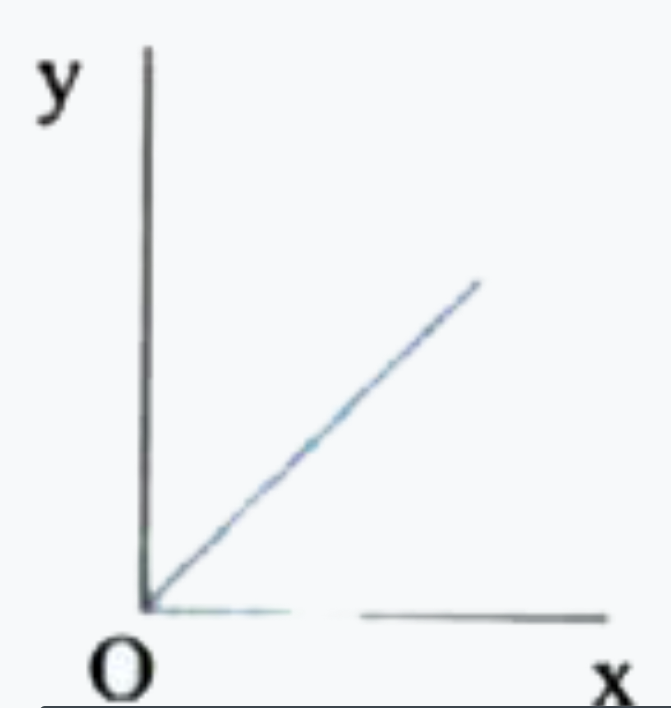
For which one of the following reaction, the graph of ΔG against T is almost horizontal to temperature axis
AC(s)+O2(g)→CO2(g)B2C(s)+O2(g)→2CO(g)C2CO(s)+O2(g)→2CO2(g)D2Mg(s)+O2(g)→2MgO(g)
Which one of the following graphs best represents the ways in which the total power P radiated by a black body depends upon the thermodynamic temperature T of the body?
View SolutionWhich of the following would lead to an increase in the vapour pressure of a liquid ?
(P) Increasing the temperature
(Q) Adding a non-volatile solute
View SolutionWhich of the following graphs correctly represents the relation between In (E) and In (T), where E is the amount of radiation emitted per unit time from a unit area of the body and T is the absolute temperature ?
View SolutionThe vapour pressure of a liquid varies with temperature as log P=−AT+I. The plot of
View Solutionwhich of the following graph represents the variation of resistivity (ρ) with temperature (T) for copper?
View Solution


