In the graph plotted between vapour pressure (V.P.) and temperature (T),
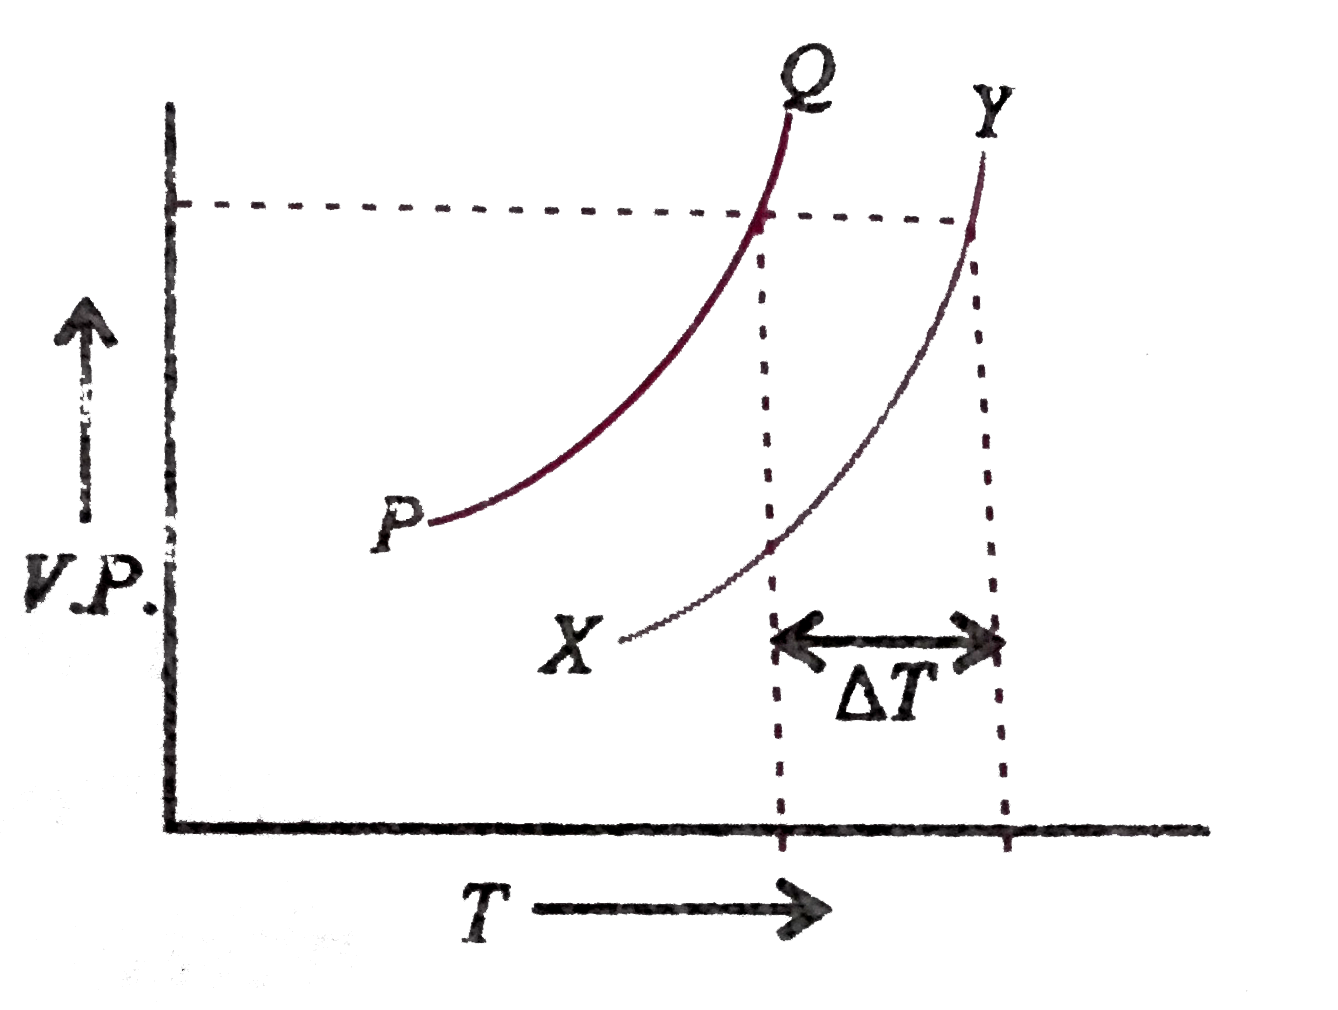
PQ is the curve for solvent , XY is the curve of solution and ΔT is depression in freezing point
PQ is the curve for solution. XY is the curve for solvent and ΔT is elevation is boiling point
PQ is the curve for solvent, XY is the curve for solution and ΔT is molal elevation in boiling point
PQ is the curve for solvent, XY is the curve for solution and ΔT is elevation in boiling point
The correct Answer is:D
PQ corresponds to increase in vapour pressure of solvent with temperature and XY corresponds to increase in vapour pressure of solution with temperature . ΔT is the elevation in boiling point of a solution.
Topper's Solved these Questions
- SOLUTIONS Book:NCERT FINGERTIPSChapter:SOLUTIONS Exercise:Abnormal Molar Masses
Explore 16 Videos
- SOLUTIONS Book:NCERT FINGERTIPSChapter:SOLUTIONS Exercise:Higher Order Thinking Skills
Explore 10 Videos
- SOLUTIONS Book:NCERT FINGERTIPSChapter:SOLUTIONS Exercise:Ideal And Non-Ideal Solutions
Explore 13 Videos
- PRACTICE PAPER -3Book:NCERT FINGERTIPSChapter:PRACTICE PAPER -3Exercise:Practice Paper 3
Explore 50 Videos
- SURFACE CHEMISTRYBook:NCERT FINGERTIPSChapter:SURFACE CHEMISTRYExercise:Assertion And Reason
Explore 15 Videos
Similar Questions
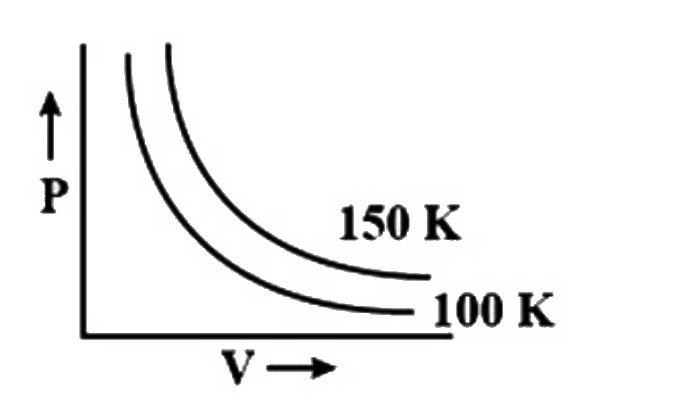
A graph is plotted between pressure and volume at different temperature. On the basis of the graph what changes will you observe in the volume if
(i) the pressure is increased at constant temperature
(ii) the temperature is decreased at constant pressure
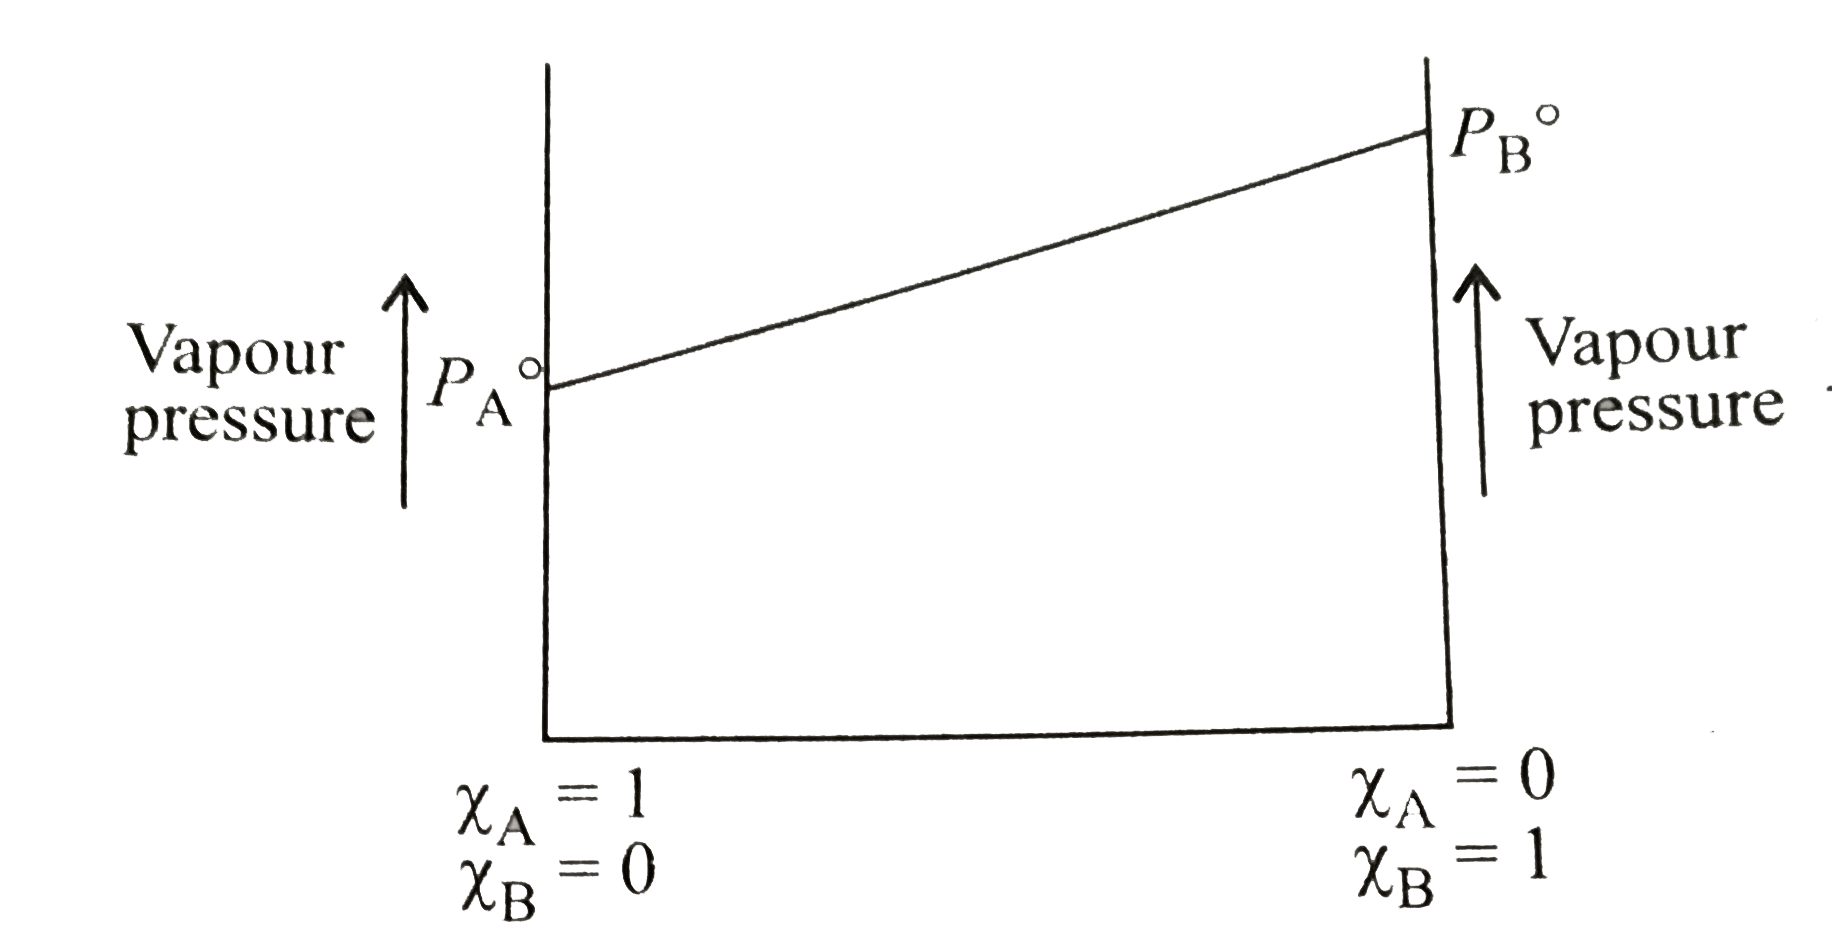
View SolutionThe following is a graph plotted between the vapour pressure of two volatile liquids against their respective mole fractions. Which of the following statements is/are correct?
View Solution
Knowledge Check
A graph is plotted between the vapour pressure and mole fraction of a solutionn containing benzene and toluene. Select the correct statements.
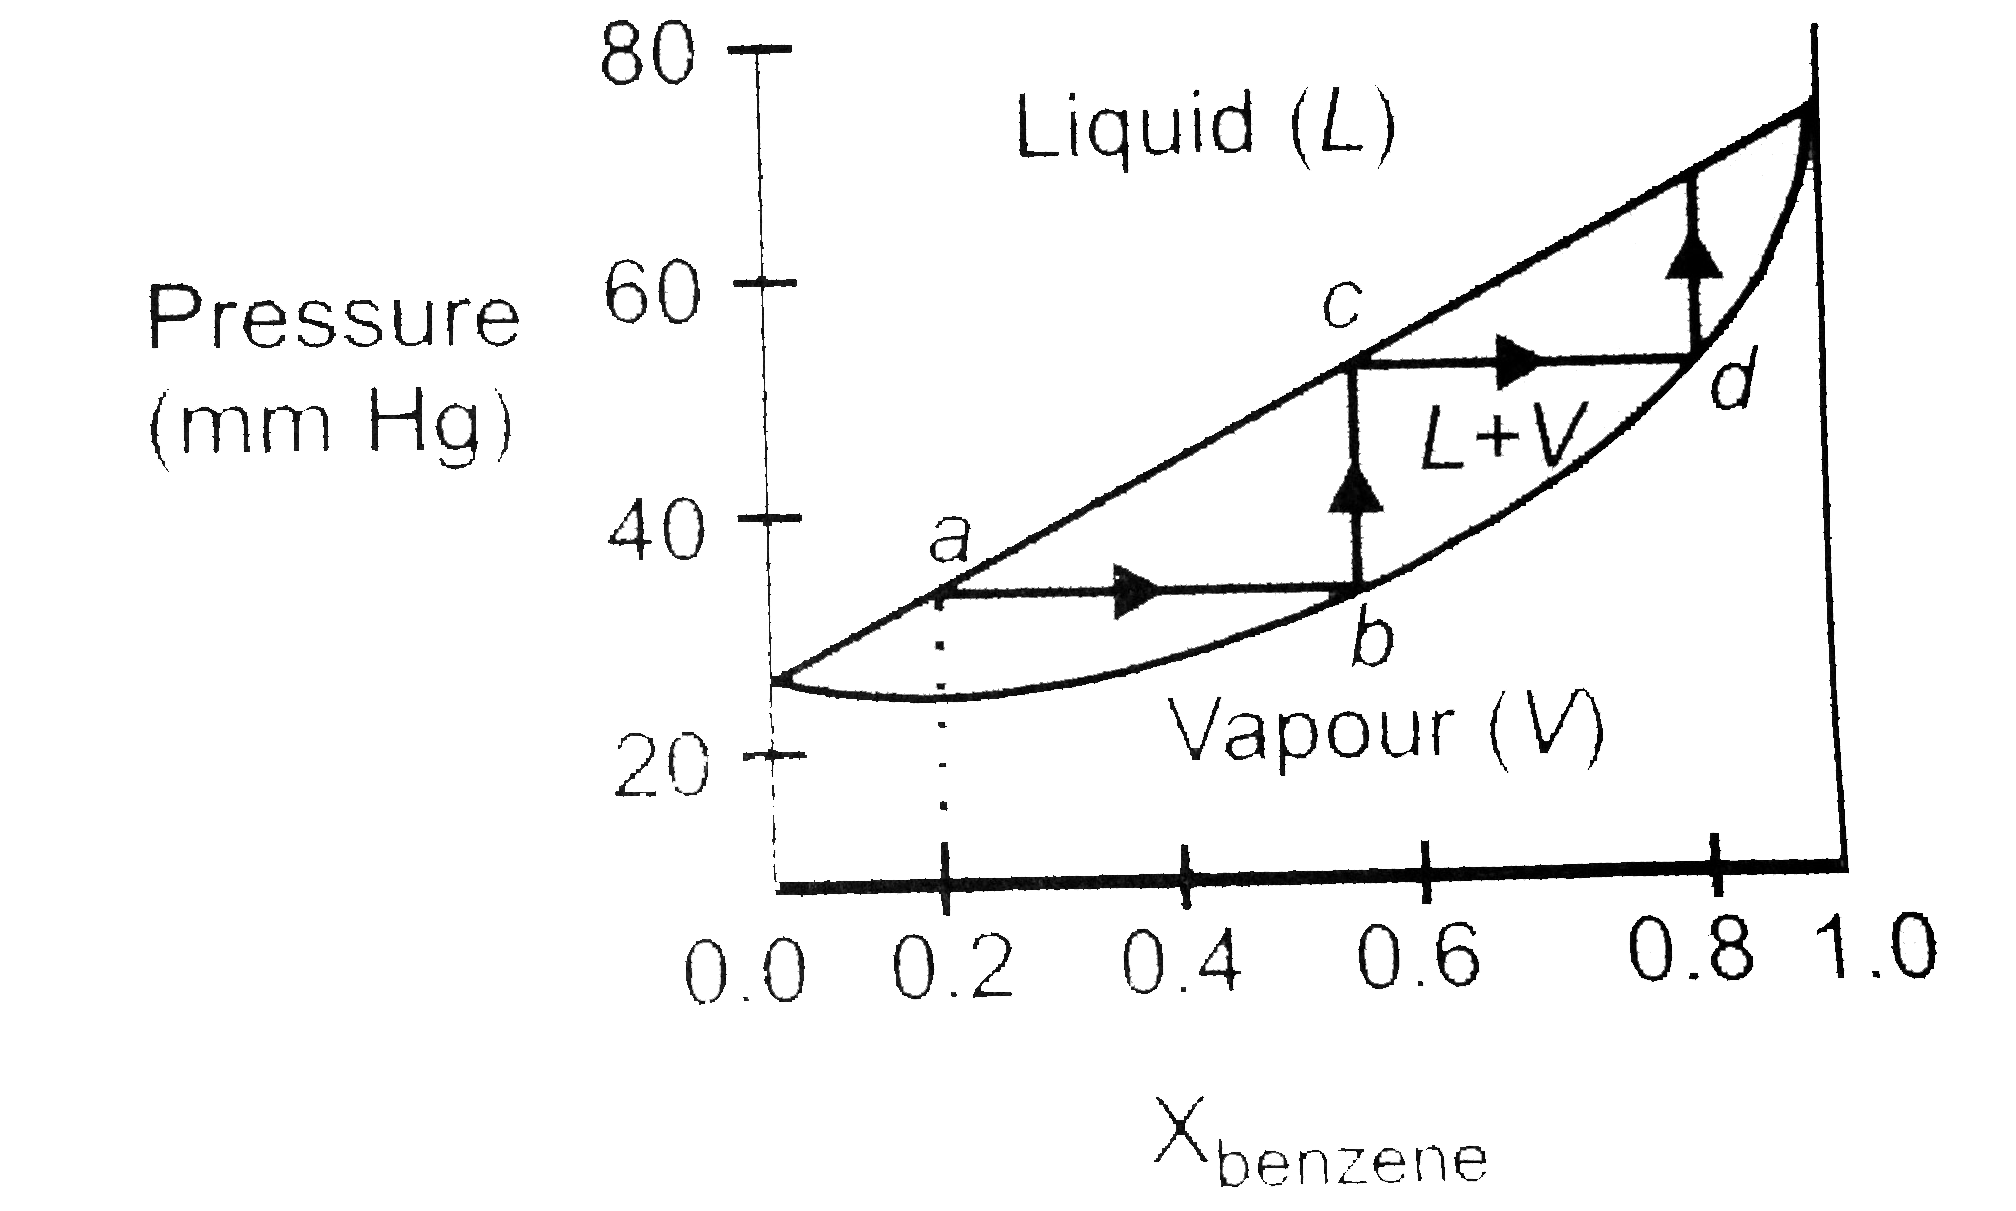 AAt the point a, the mole fraction of toluene is 0.80Bb→c represents condesationCc→d represents vaporizationDc→d represents vaporization as well as condensation
A graph between vapour pressure and temperature of few liquids is given below. Study the graph and answer following question.
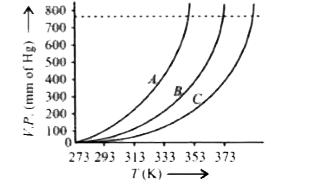
Which of the following statements is not true?ABoiling point of a liquid is the temperature at which its vapour pressure becomes equal to atmospheric pressure.BBoiling point of water can be increased by increased the pressure above the atmospheric pressureCIf liquid B is heated in a closed vessel it will boil at 353 KDLiquid C has higher boilingk point than B due to higher intermolecular forces.Which plot involving vapour pressure (VP) and absolute temperature results in a straight line ?
AVp us TBVP us T−1Cln VP us TDln VP us T−1
The graph plotted against adsorption versus pressure P at constant temperature, the Freundich equation at A, B, C respectively are (if n > 1)
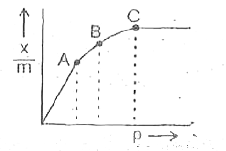
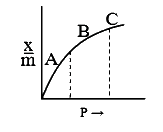
View SolutionA graph is plotted between extent of adsorption vs pressure (P) at constant temperature, the Frendlich equation at points A, B, C respectively are:
View SolutionThe behaviour of ideal gas is goverened by various gas laws which are described by mathematical statements as given below:
(i) PV=k (constant) at constant n and T
(ii) V/T=k2 (constant) at constant n and P
(iii) V/n=k3 (constant) at constant T and P
(iv) PV=nRT
(v) P/T=k4 (constant) at constant n and V
Answer the following
If we plot a graph between volume (L) and temperature (^(∘)C) by studying their variation for 2.0g of certain ideal gas at 1¯ pressure, the graph obtained is a straight line which is
View SolutionThe graph between surface tension and temperature T is
View SolutionSlope of the plot between V and P at constant temperature
View Solution

