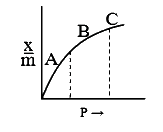
A graph is plotted between extent of adsorption vs pressure (P) at constant temperature, the Frendlich equation at points A, B, C respectively are:
A
xm=kp,xm=kp1/n,xm=kpo
B
xm=kp,xm=kpn,xm=kp1/n
C
(x)/(m)=kp^(1//n),(x)/(m)=kp^(n),(x)/(m)=kp^(1//n)
D
xm=kp∞,xm=kp1/n,xm=kpn
Video Solution
Text Solution
The correct Answer is:A
|
Answer
Step by step video, text & image solution for A graph is plotted between extent of adsorption vs pressure (P) at constant temperature, the Frendlich equation at points A, B, C respectively are: by Chemistry experts to help you in doubts & scoring excellent marks in Class 12 exams.
Updated on:21/07/2023Similar Questions
Knowledge Check
The graph plotted against adsorption versus pressure P at constant temperature, the Freundich equation at A, B, C respectively are (if n > 1)
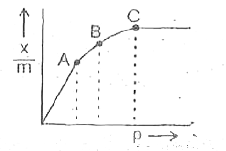 Axm=kp,xm=kpyn,xm=kp0Bxm=kp,xm=kpn,xm=kp1/nCxm=kp1/n,xm=kpn,xm=kp1/nDxm=kp∞,xm=kp1/n,xm=kpn
The curve between adsorption and pressure at constant temperature is called as
Aadsorption isothermBadsorption isobarCAdsorbateDAdsorbentGraph between speed v of sound in air and pressure P at a constant temperature is given by
A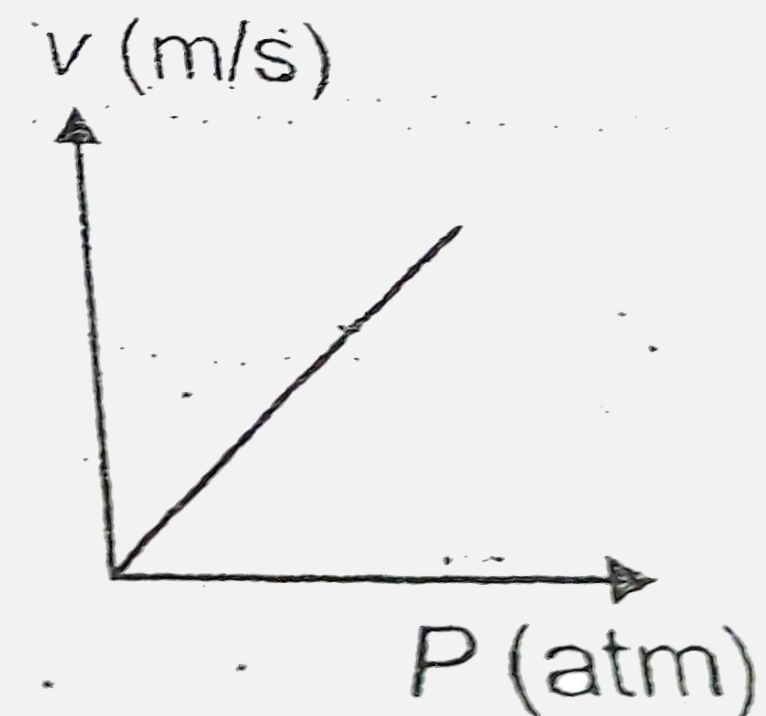 B
B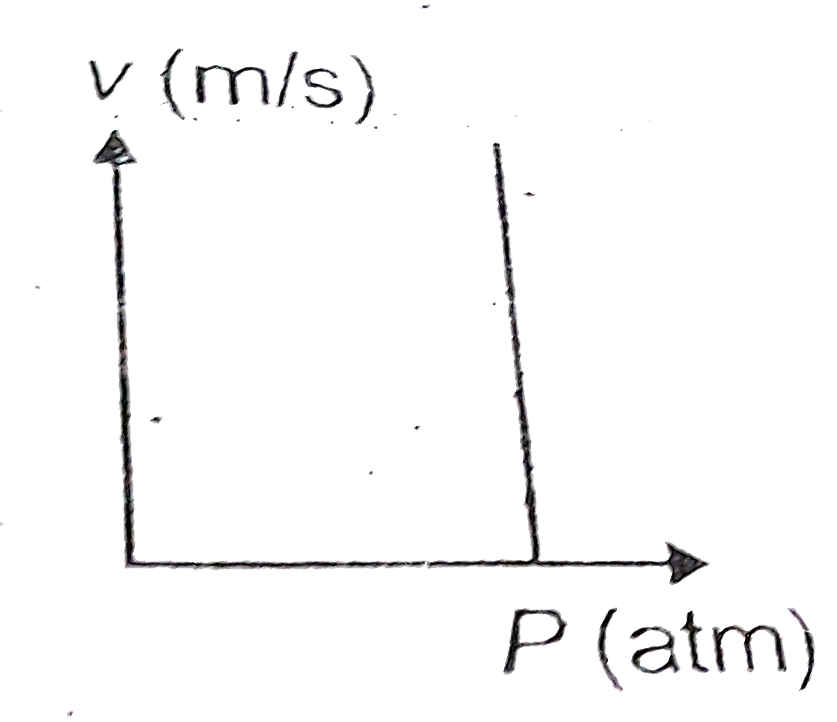 C
C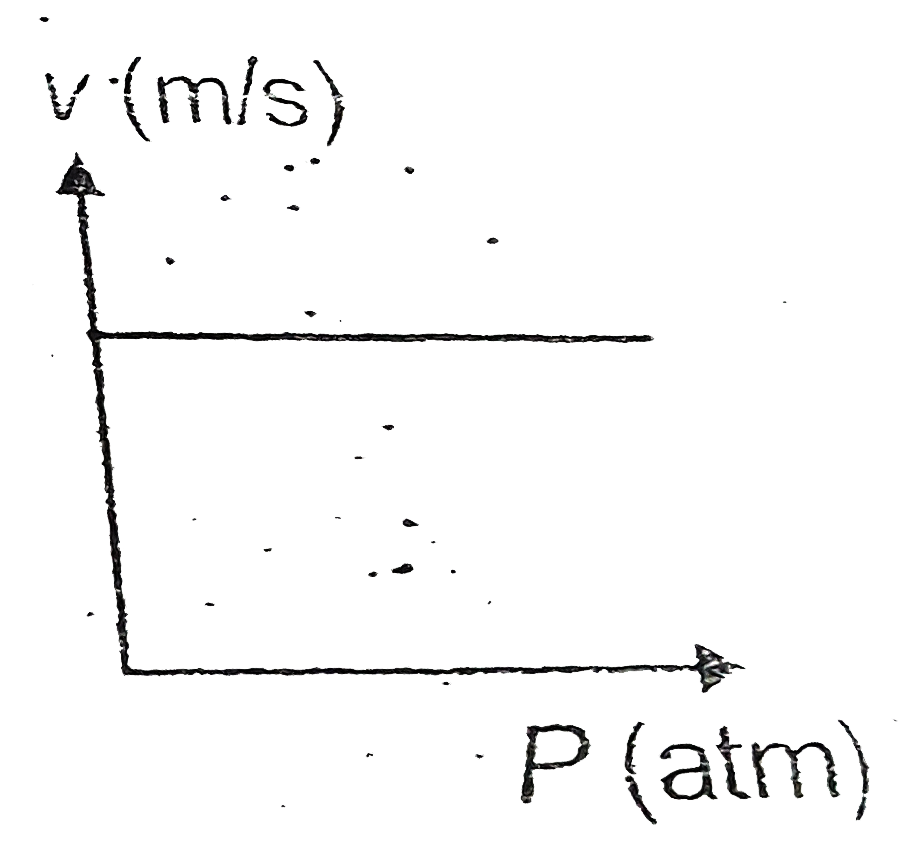 D
D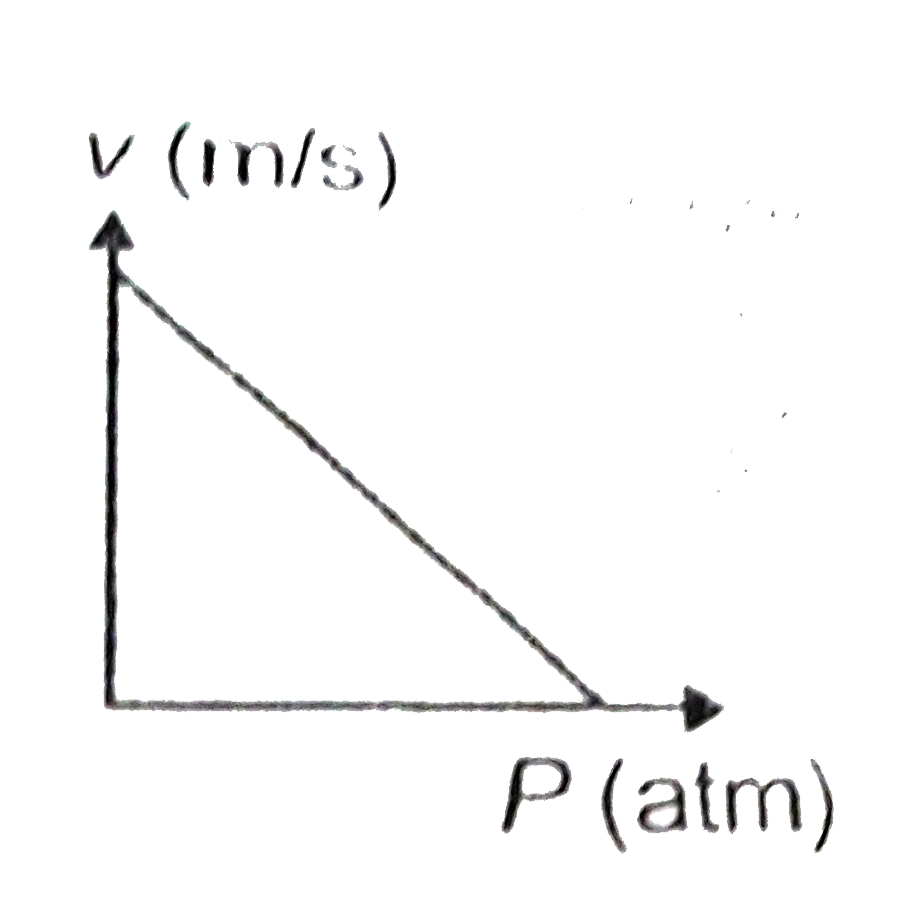
Graph between p and V at constant temperature is
View SolutionGraph between p and V at constant temperature is
View SolutionSlope of the plot between V and P at constant temperature
View SolutionThe slope of the plot between pV and p at constant temperature is
View SolutionThe slope of the plot between pV and p at constant temperature is
View Solution
