The graph between surface tension and temperature T is
A

B

C

D

Video Solution
Text Solution
The correct Answer is:A
|
Answer
Step by step video, text & image solution for The graph between surface tension and temperature T is by Physics experts to help you in doubts & scoring excellent marks in Class 12 exams.
Updated on:21/07/2023Topper's Solved these Questions
- SURFACE TENSION Book:TARGET PUBLICATIONChapter:SURFACE TENSION Exercise:CRITICAL THINKING
Explore 62 Videos
- SURFACE TENSION Book:TARGET PUBLICATIONChapter:SURFACE TENSION Exercise:COMPETITIVE THINKING
Explore 72 Videos
- STATIONARY WAVESBook:TARGET PUBLICATIONChapter:STATIONARY WAVESExercise:EVALUATION TEST
Explore 16 Videos
- WAVE MOTION Book:TARGET PUBLICATIONChapter:WAVE MOTION Exercise:MCQ 7.1
Explore 61 Videos
Similar Questions
Knowledge Check
The graph between the (velocity)2 and temperature T of a gas is
A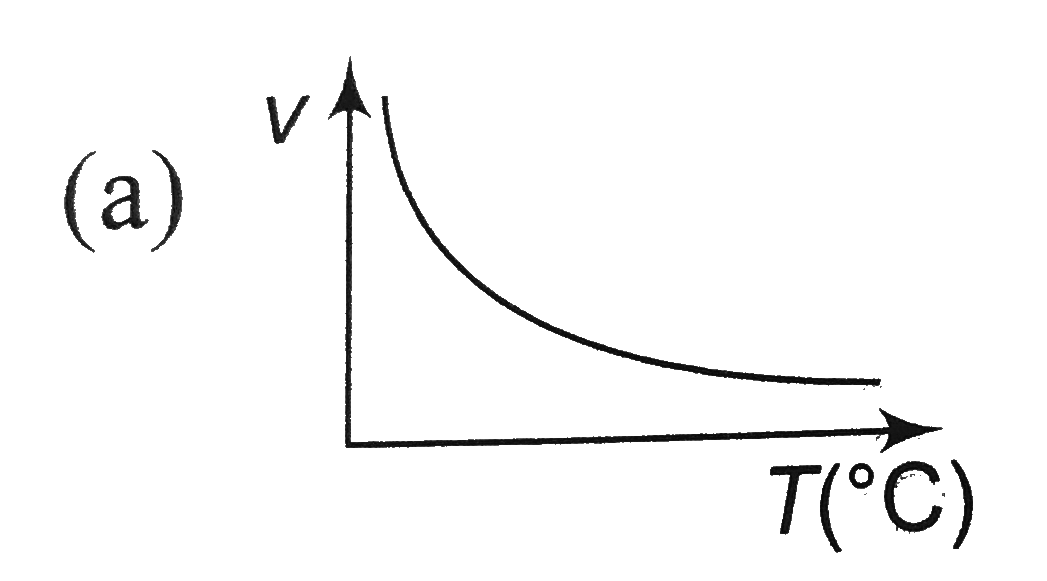 B
B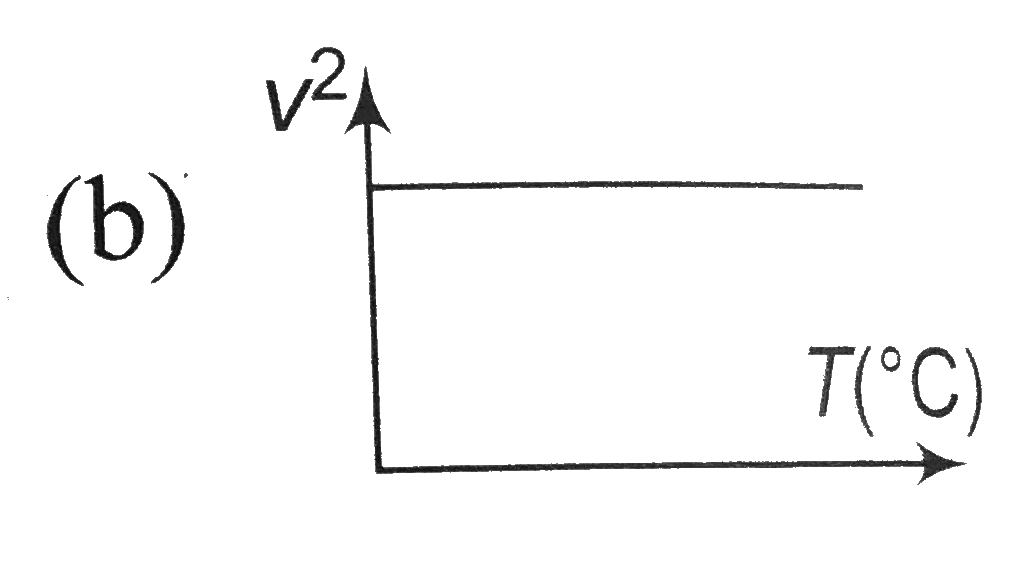 C
C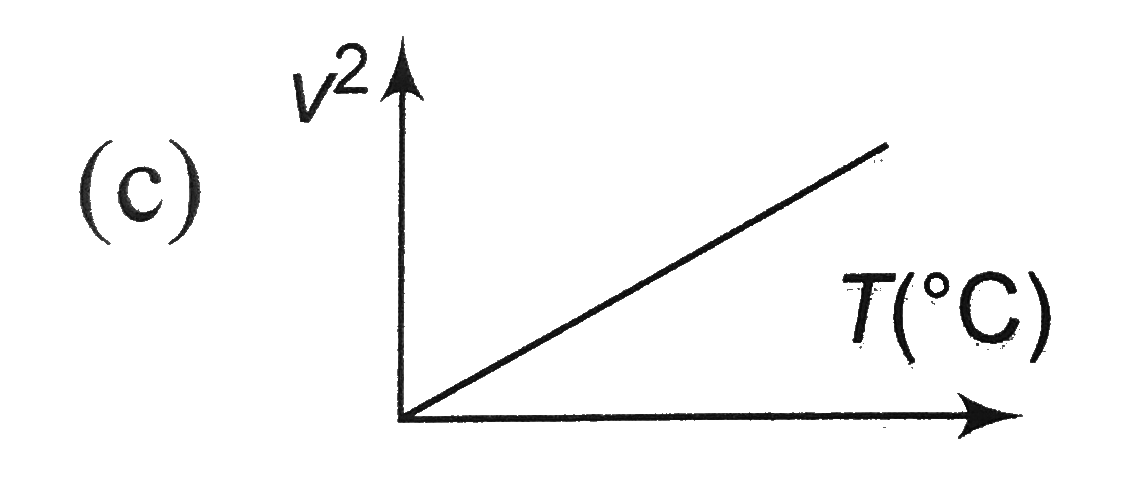 D
D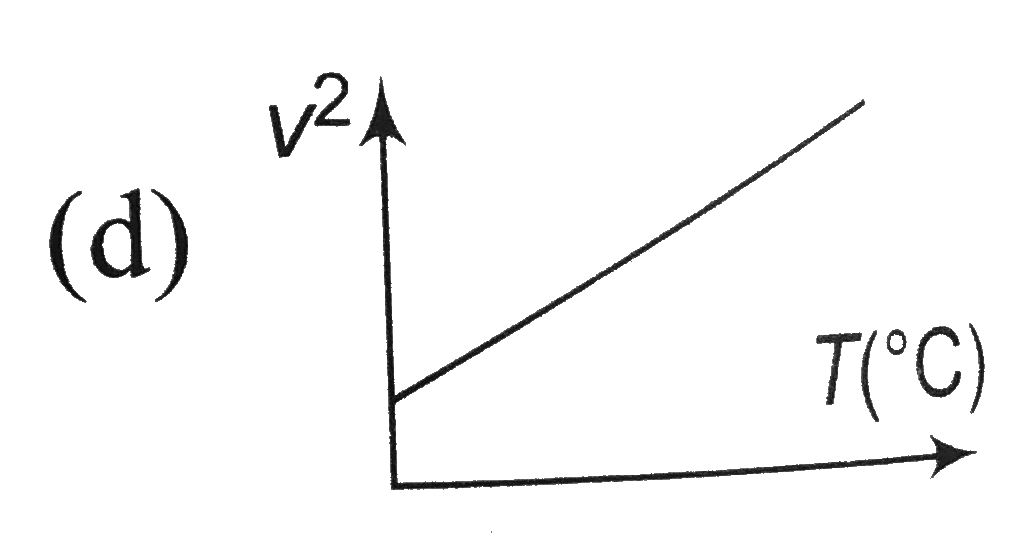
The relation between surface tension and surface energy is
AW=A/TBW=T/ACT=W/ADT=W.AIf for a given substance, melting point is TB and freezing point is TA then correct variation of entropy is by graph between entropy change and temperature is
A B
B C
C D
D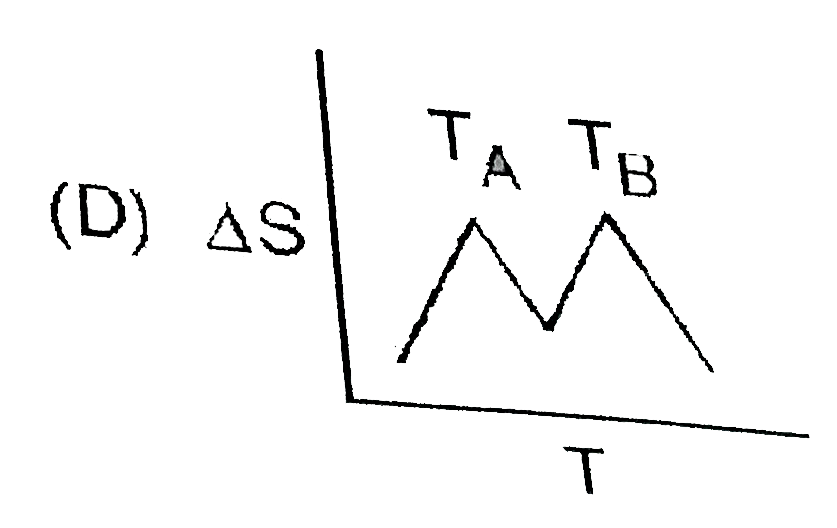
Surface Tension And Effect Of Temperature
View Solutionif for a given substance , melting point is TB and freezing point is TA then correct variation of entropy by graph between entropy change and temperature is
View SolutionIf for a given substance, melting point is TB and freezing point is TA then correct variation of entropy is by graph between entropy change and temperature is
View SolutionGraph between p and V at constant temperature is
View SolutionGraph between p and V at constant temperature is
View Solution

