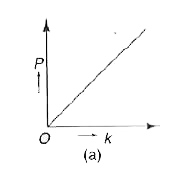
Which of the following graphs represents the graphical relation between momentum (p) and kinetic energy (K) for a body in motion?
A
B
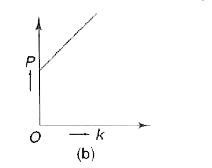
C
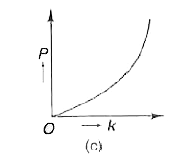
D
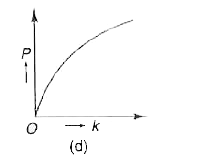
Video Solution
Text Solution
The correct Answer is:D
P2=1110p1
∴v2=1110v1
Also, E∝v2
∴E2=121100E1
ΔE%=E2−E1E1×100
= (121100−1)×100=21%
|
Topper's Solved these Questions
Similar Questions
Knowledge Check
Which one of the following graphs represents motion?
A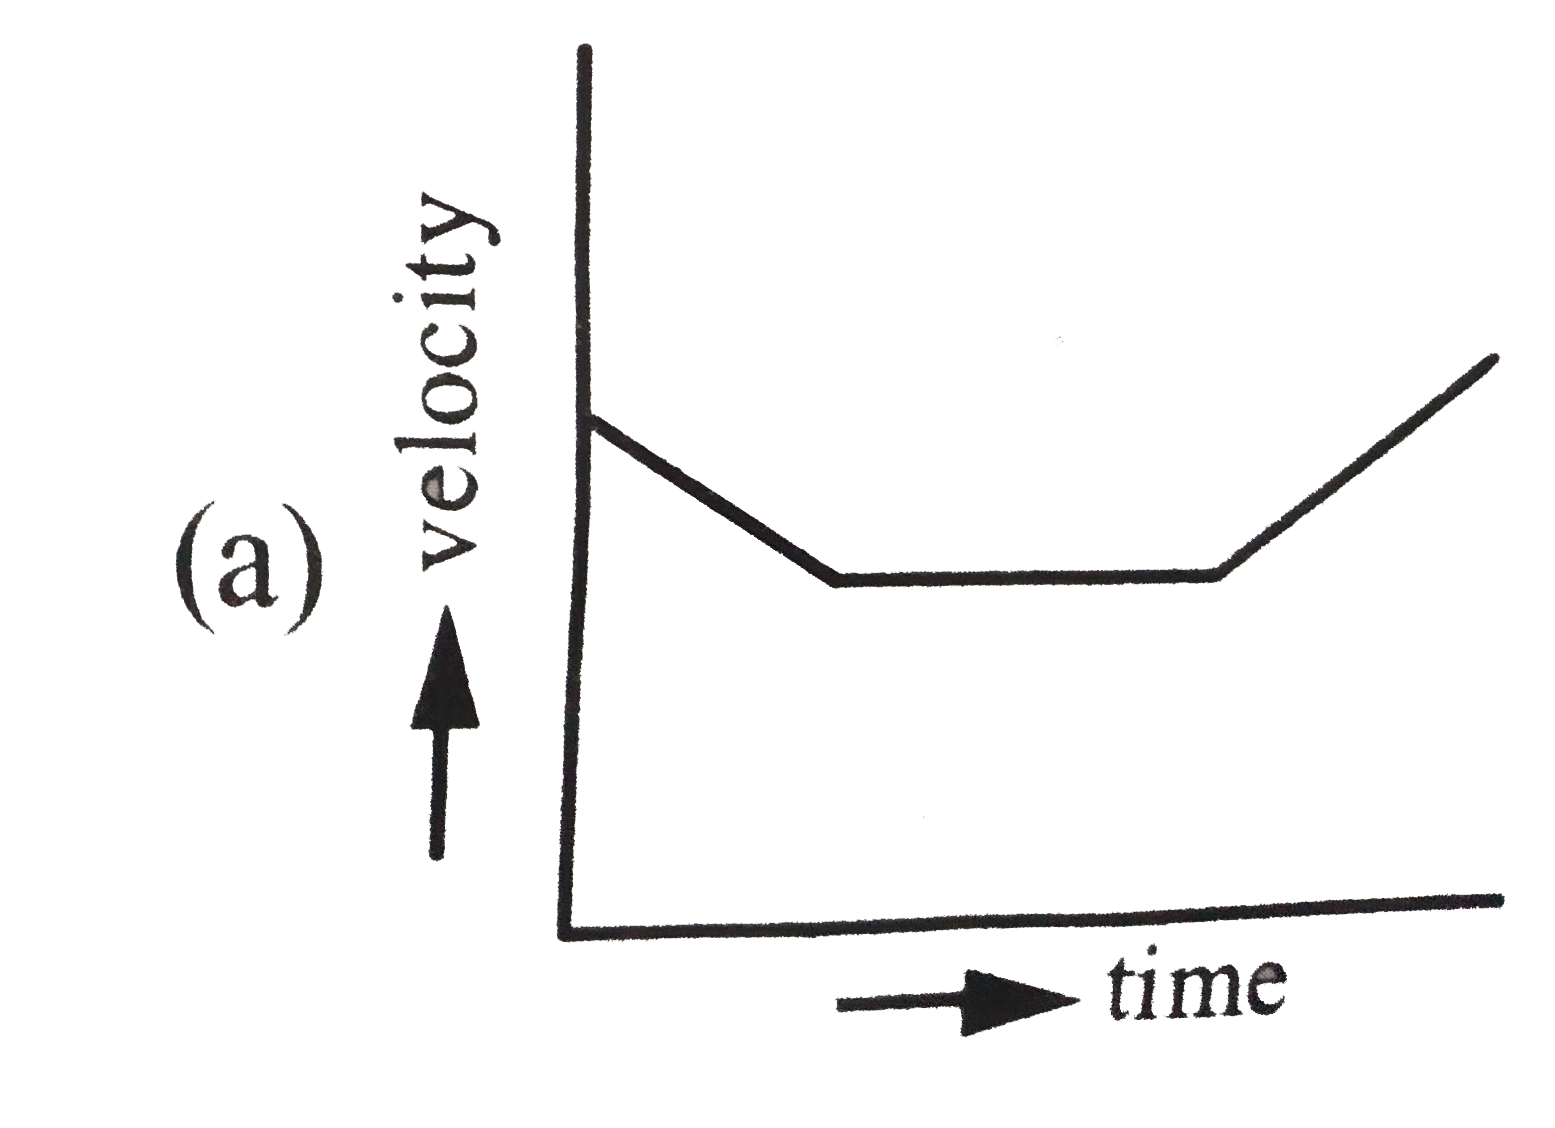 B
B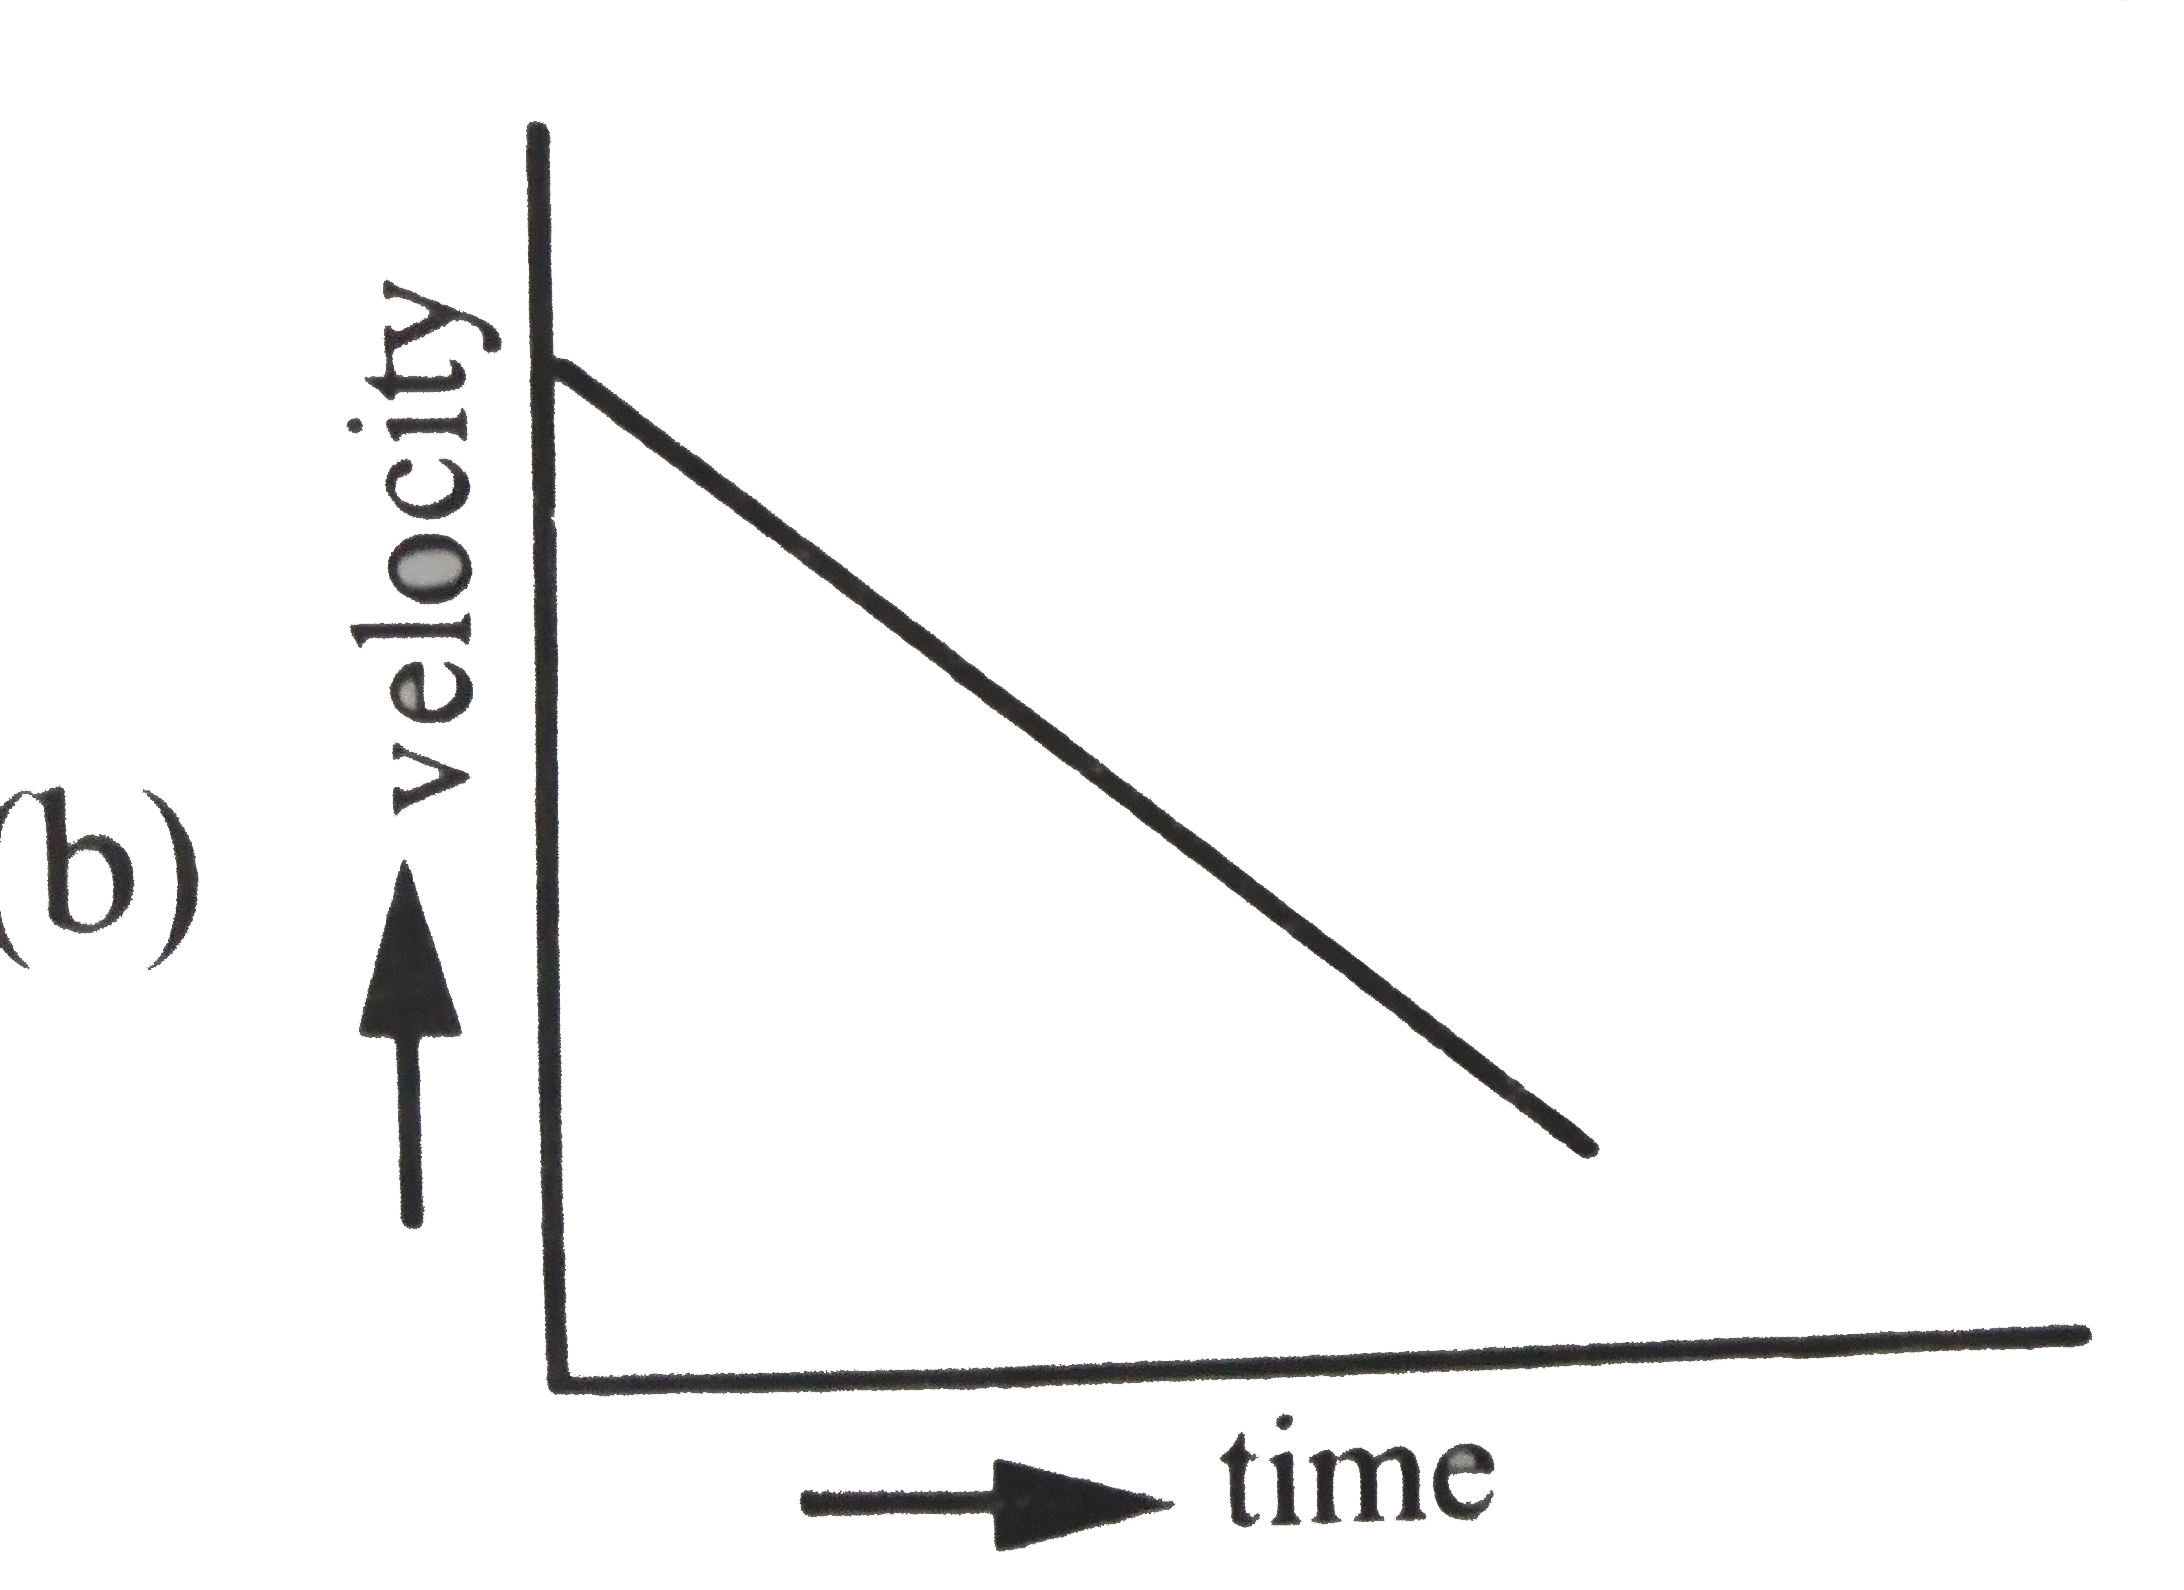 C
C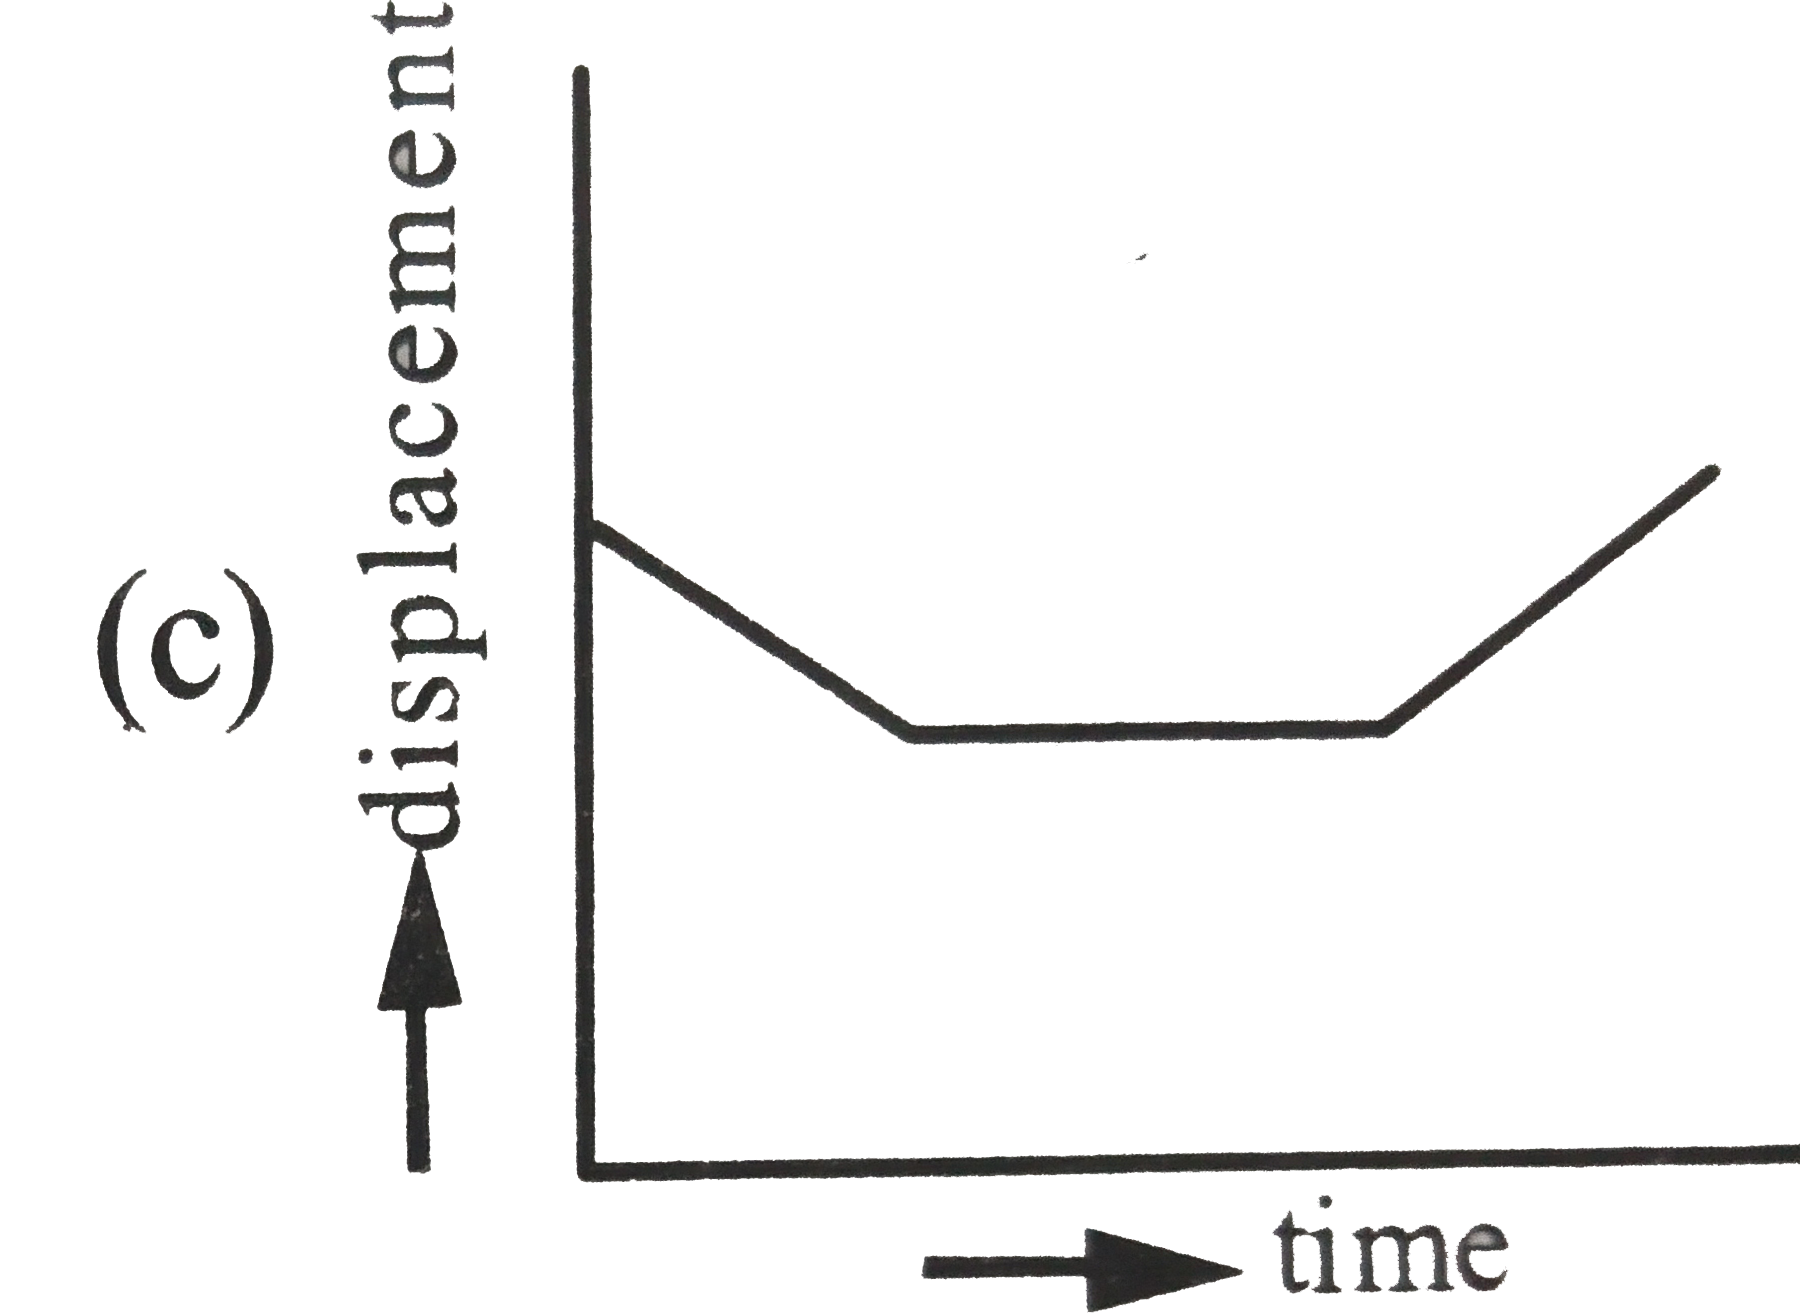 D
D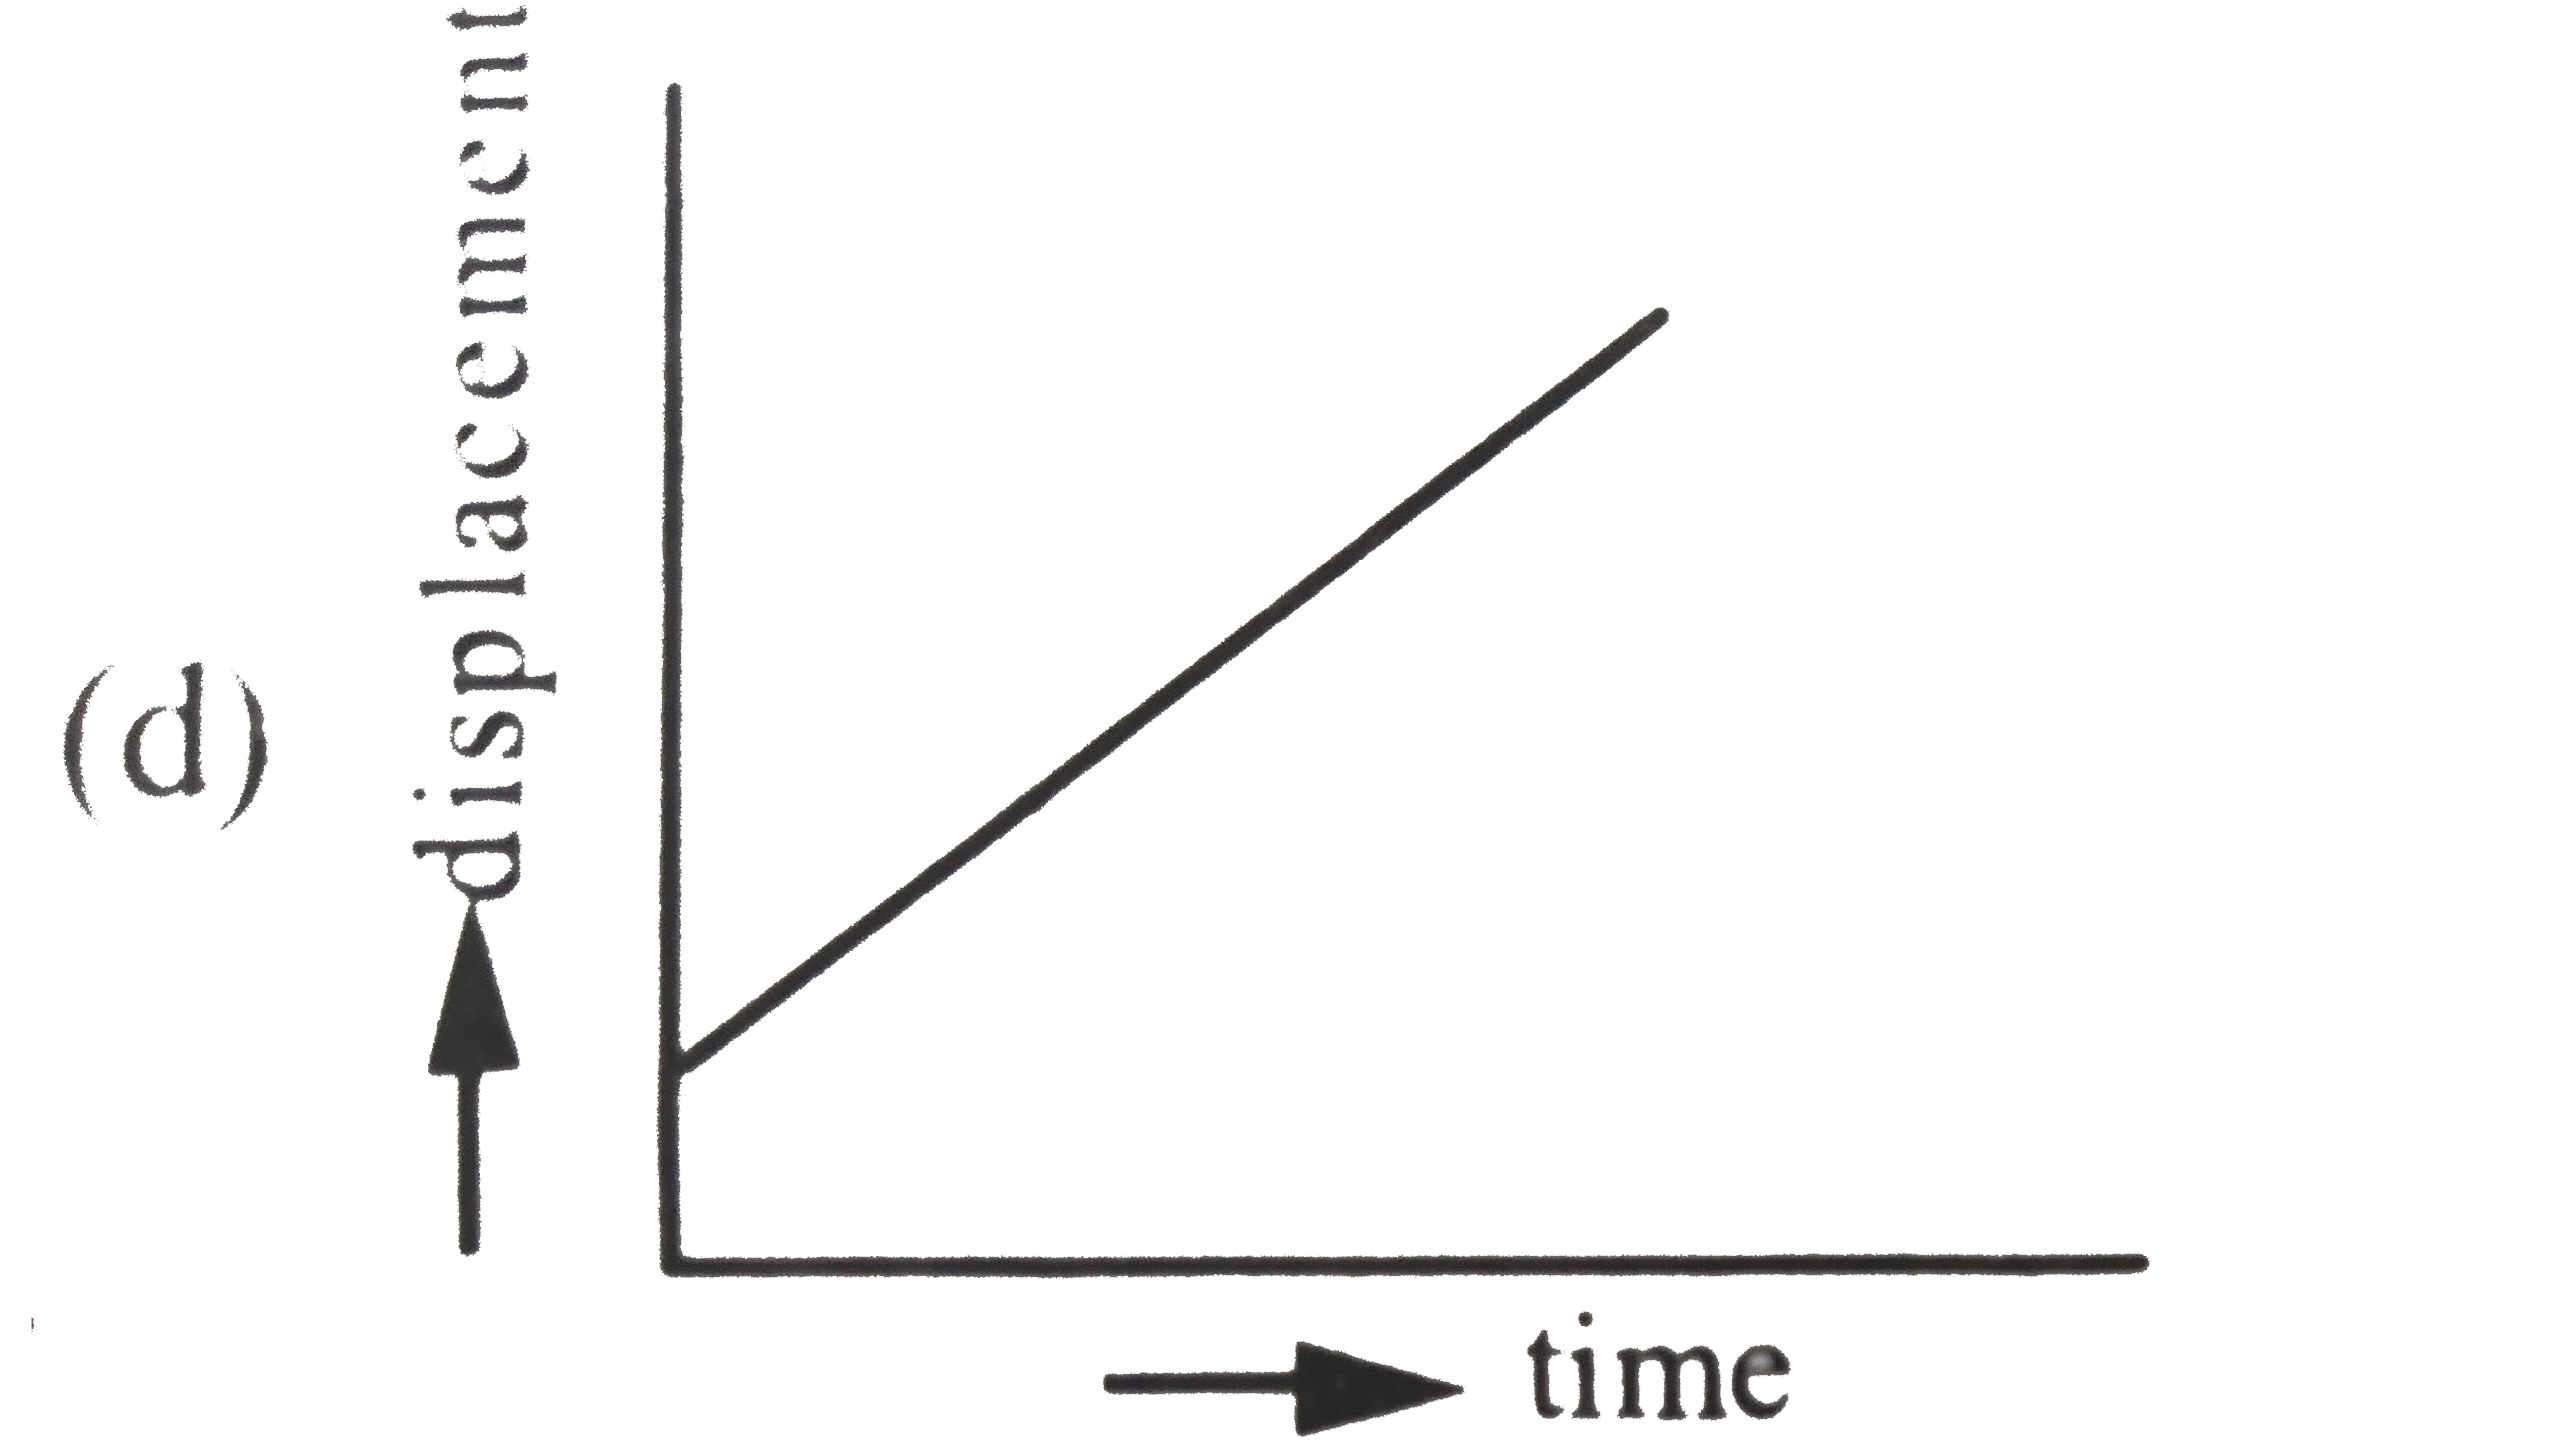
Which one of the following correctly represents the variation between linear momentum (P) and kinetic energy (E) ofa body?
A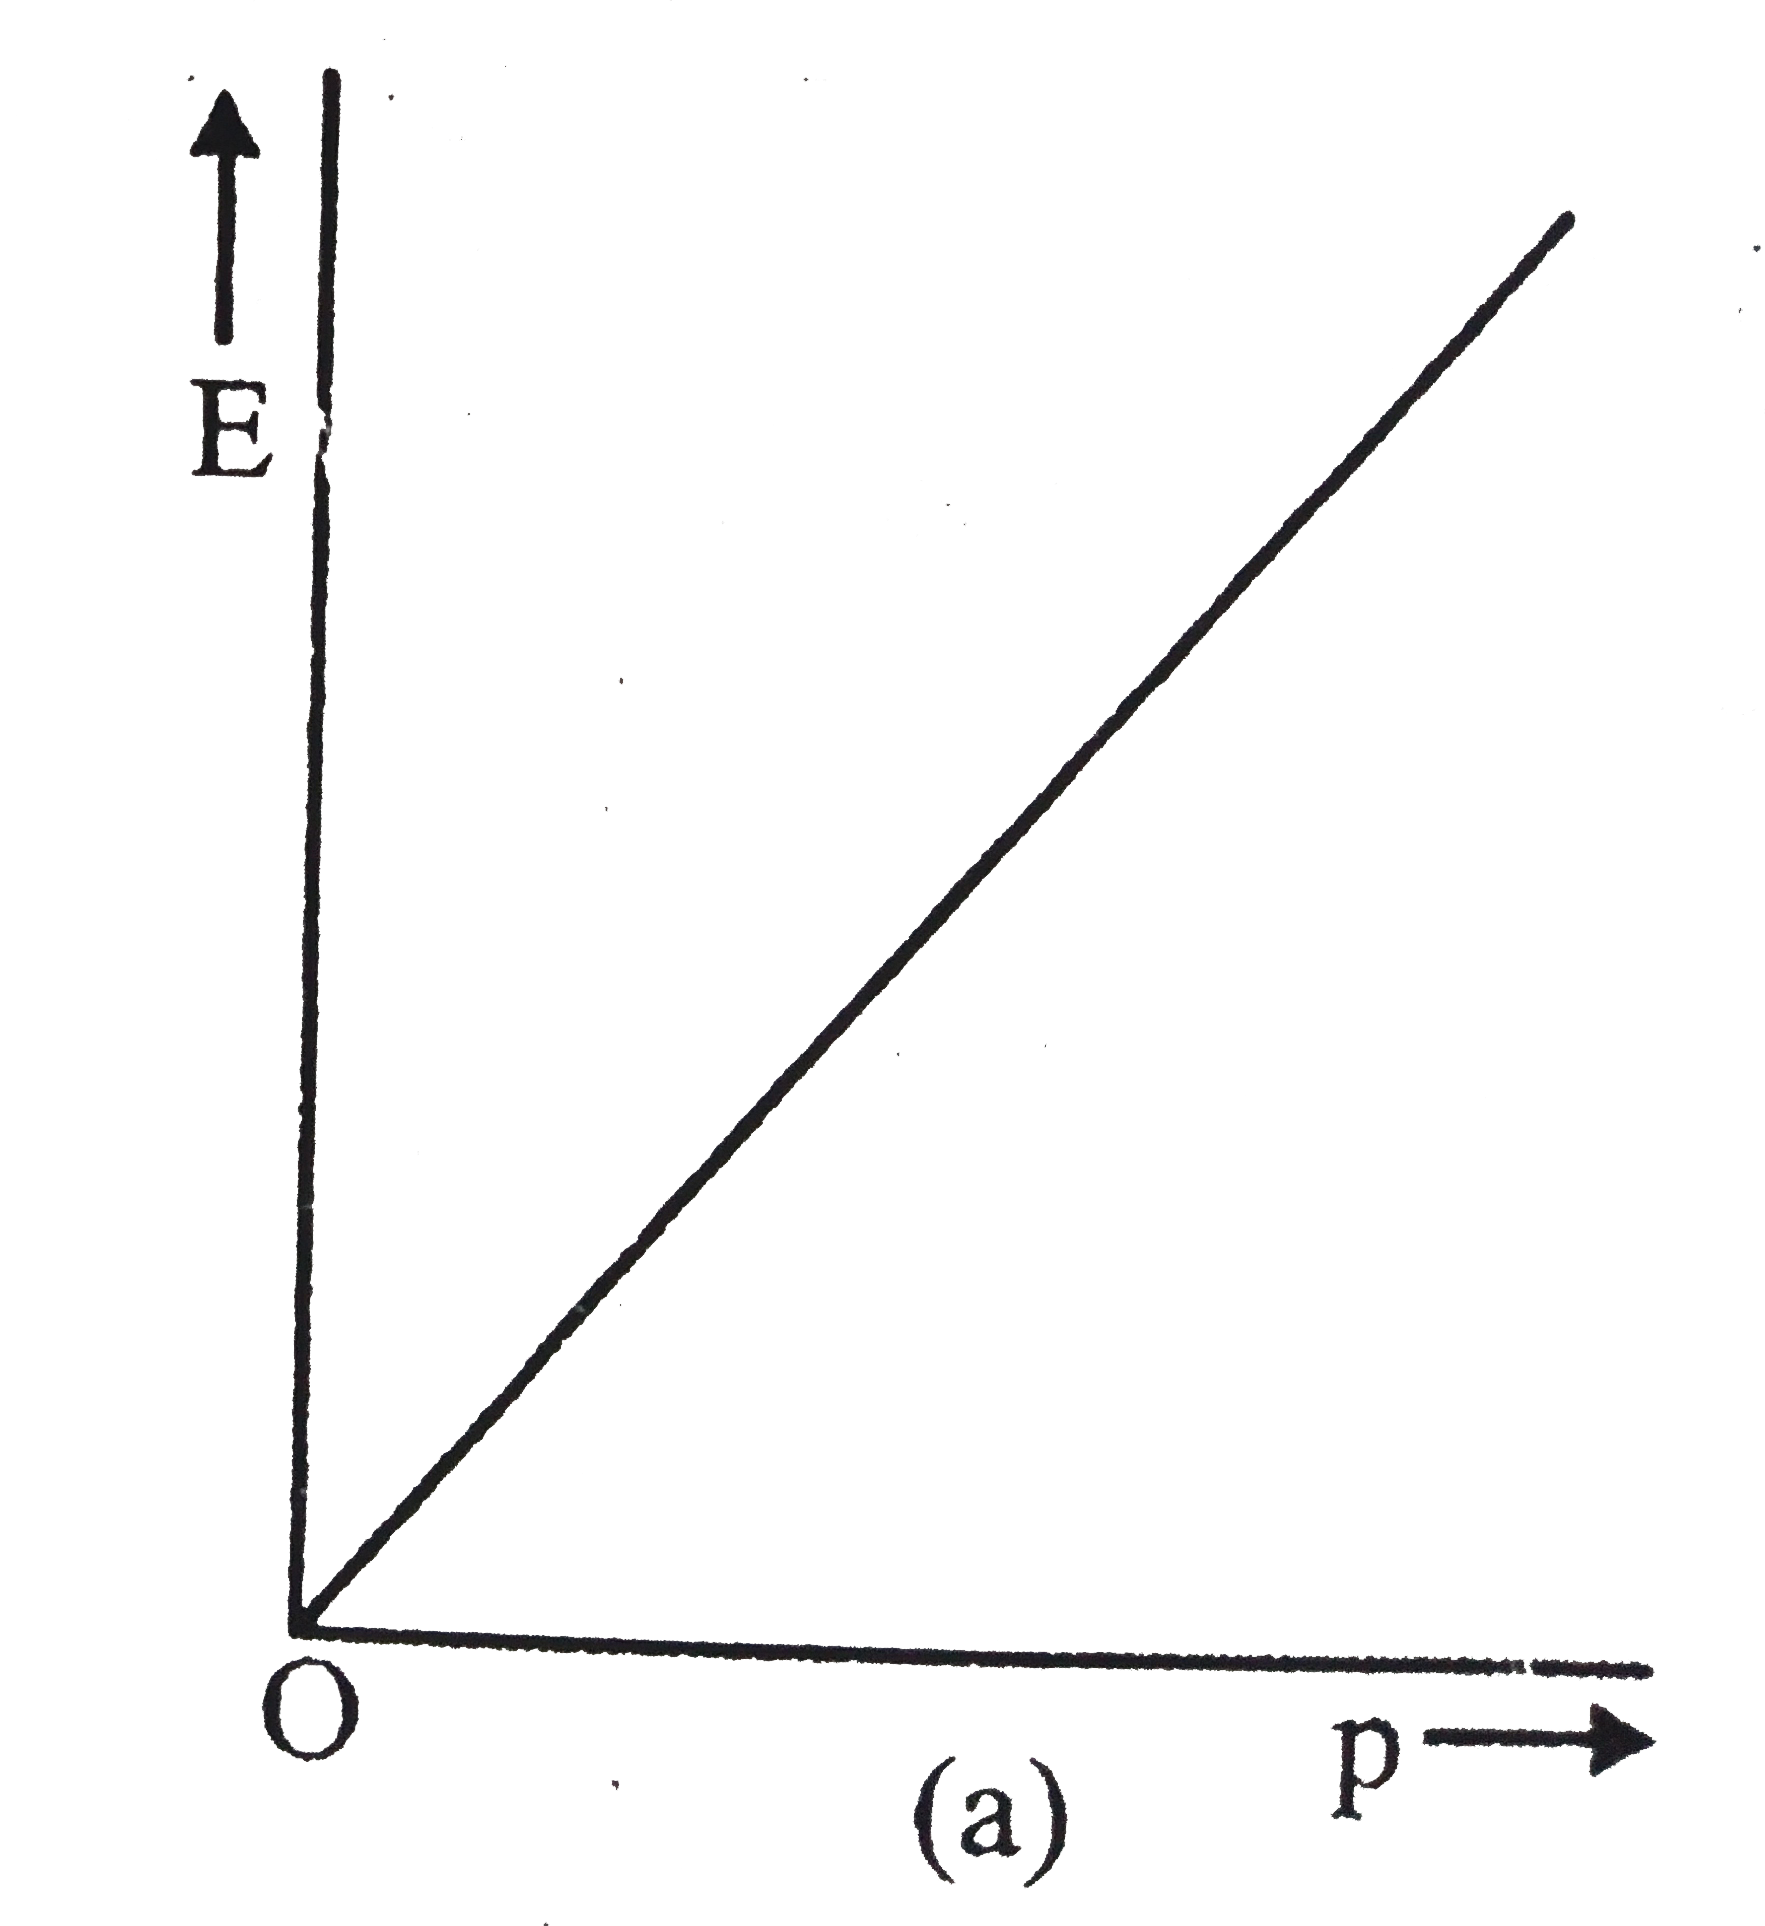 B
B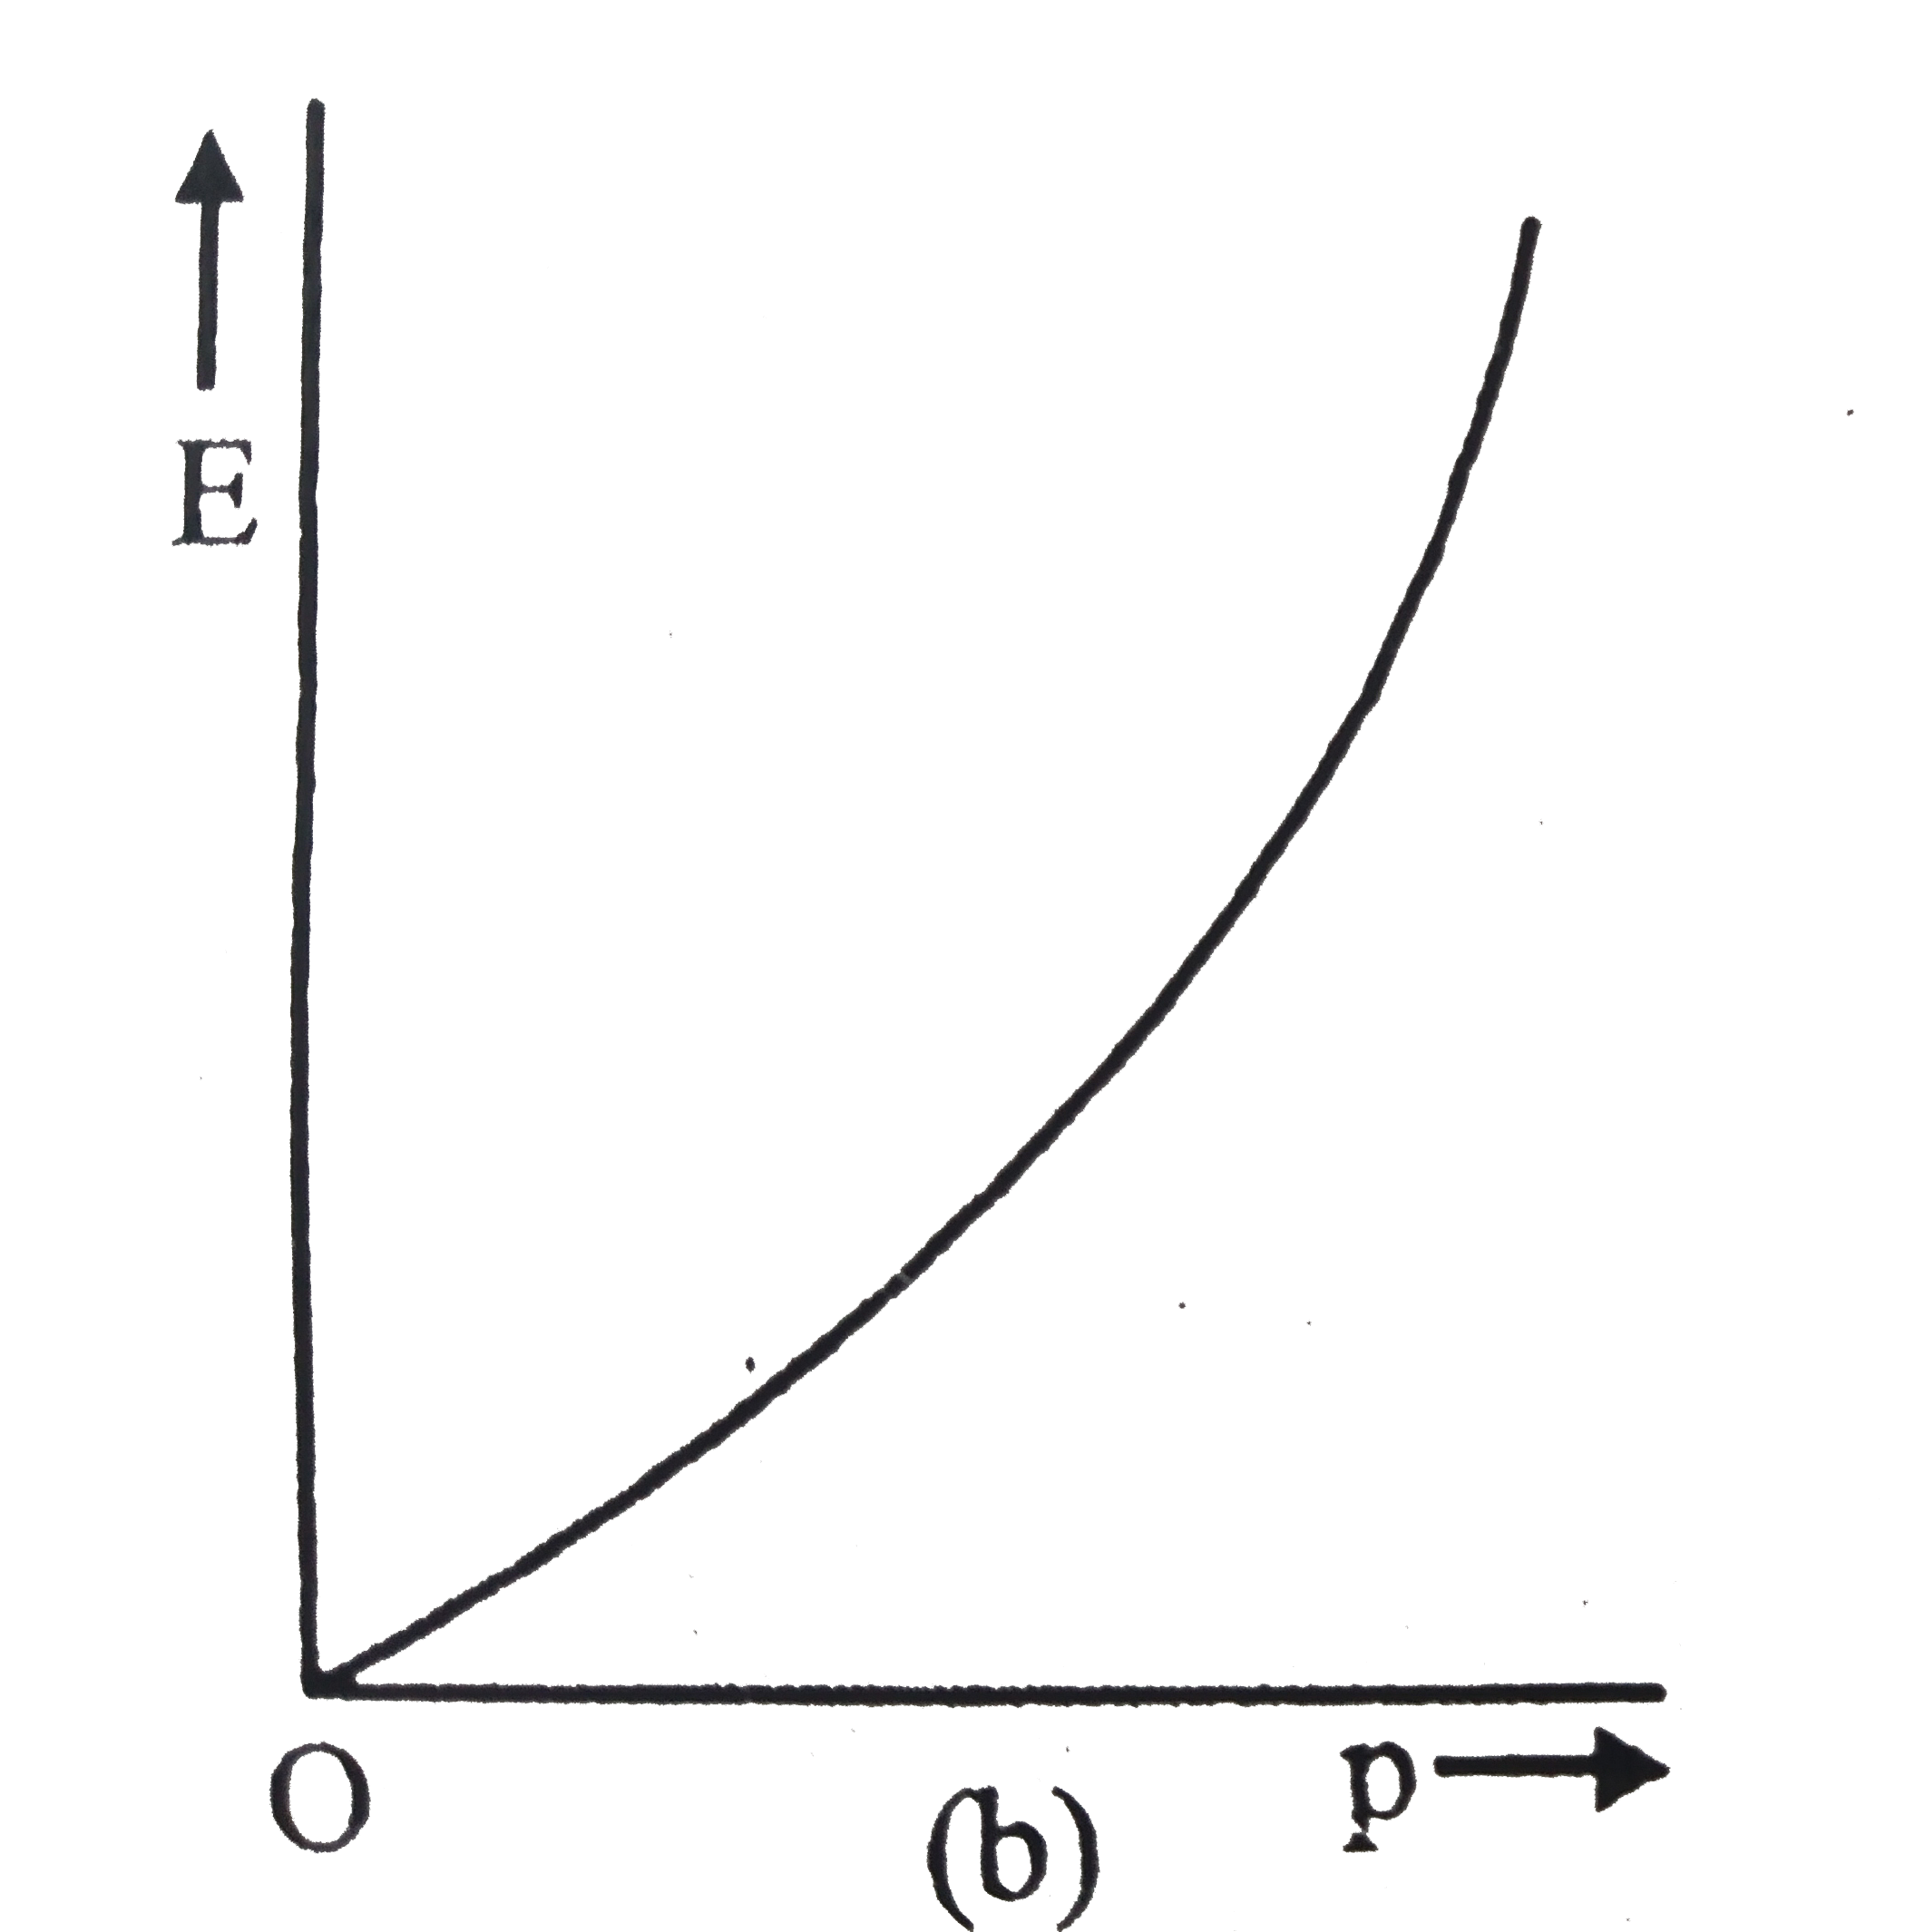 C
C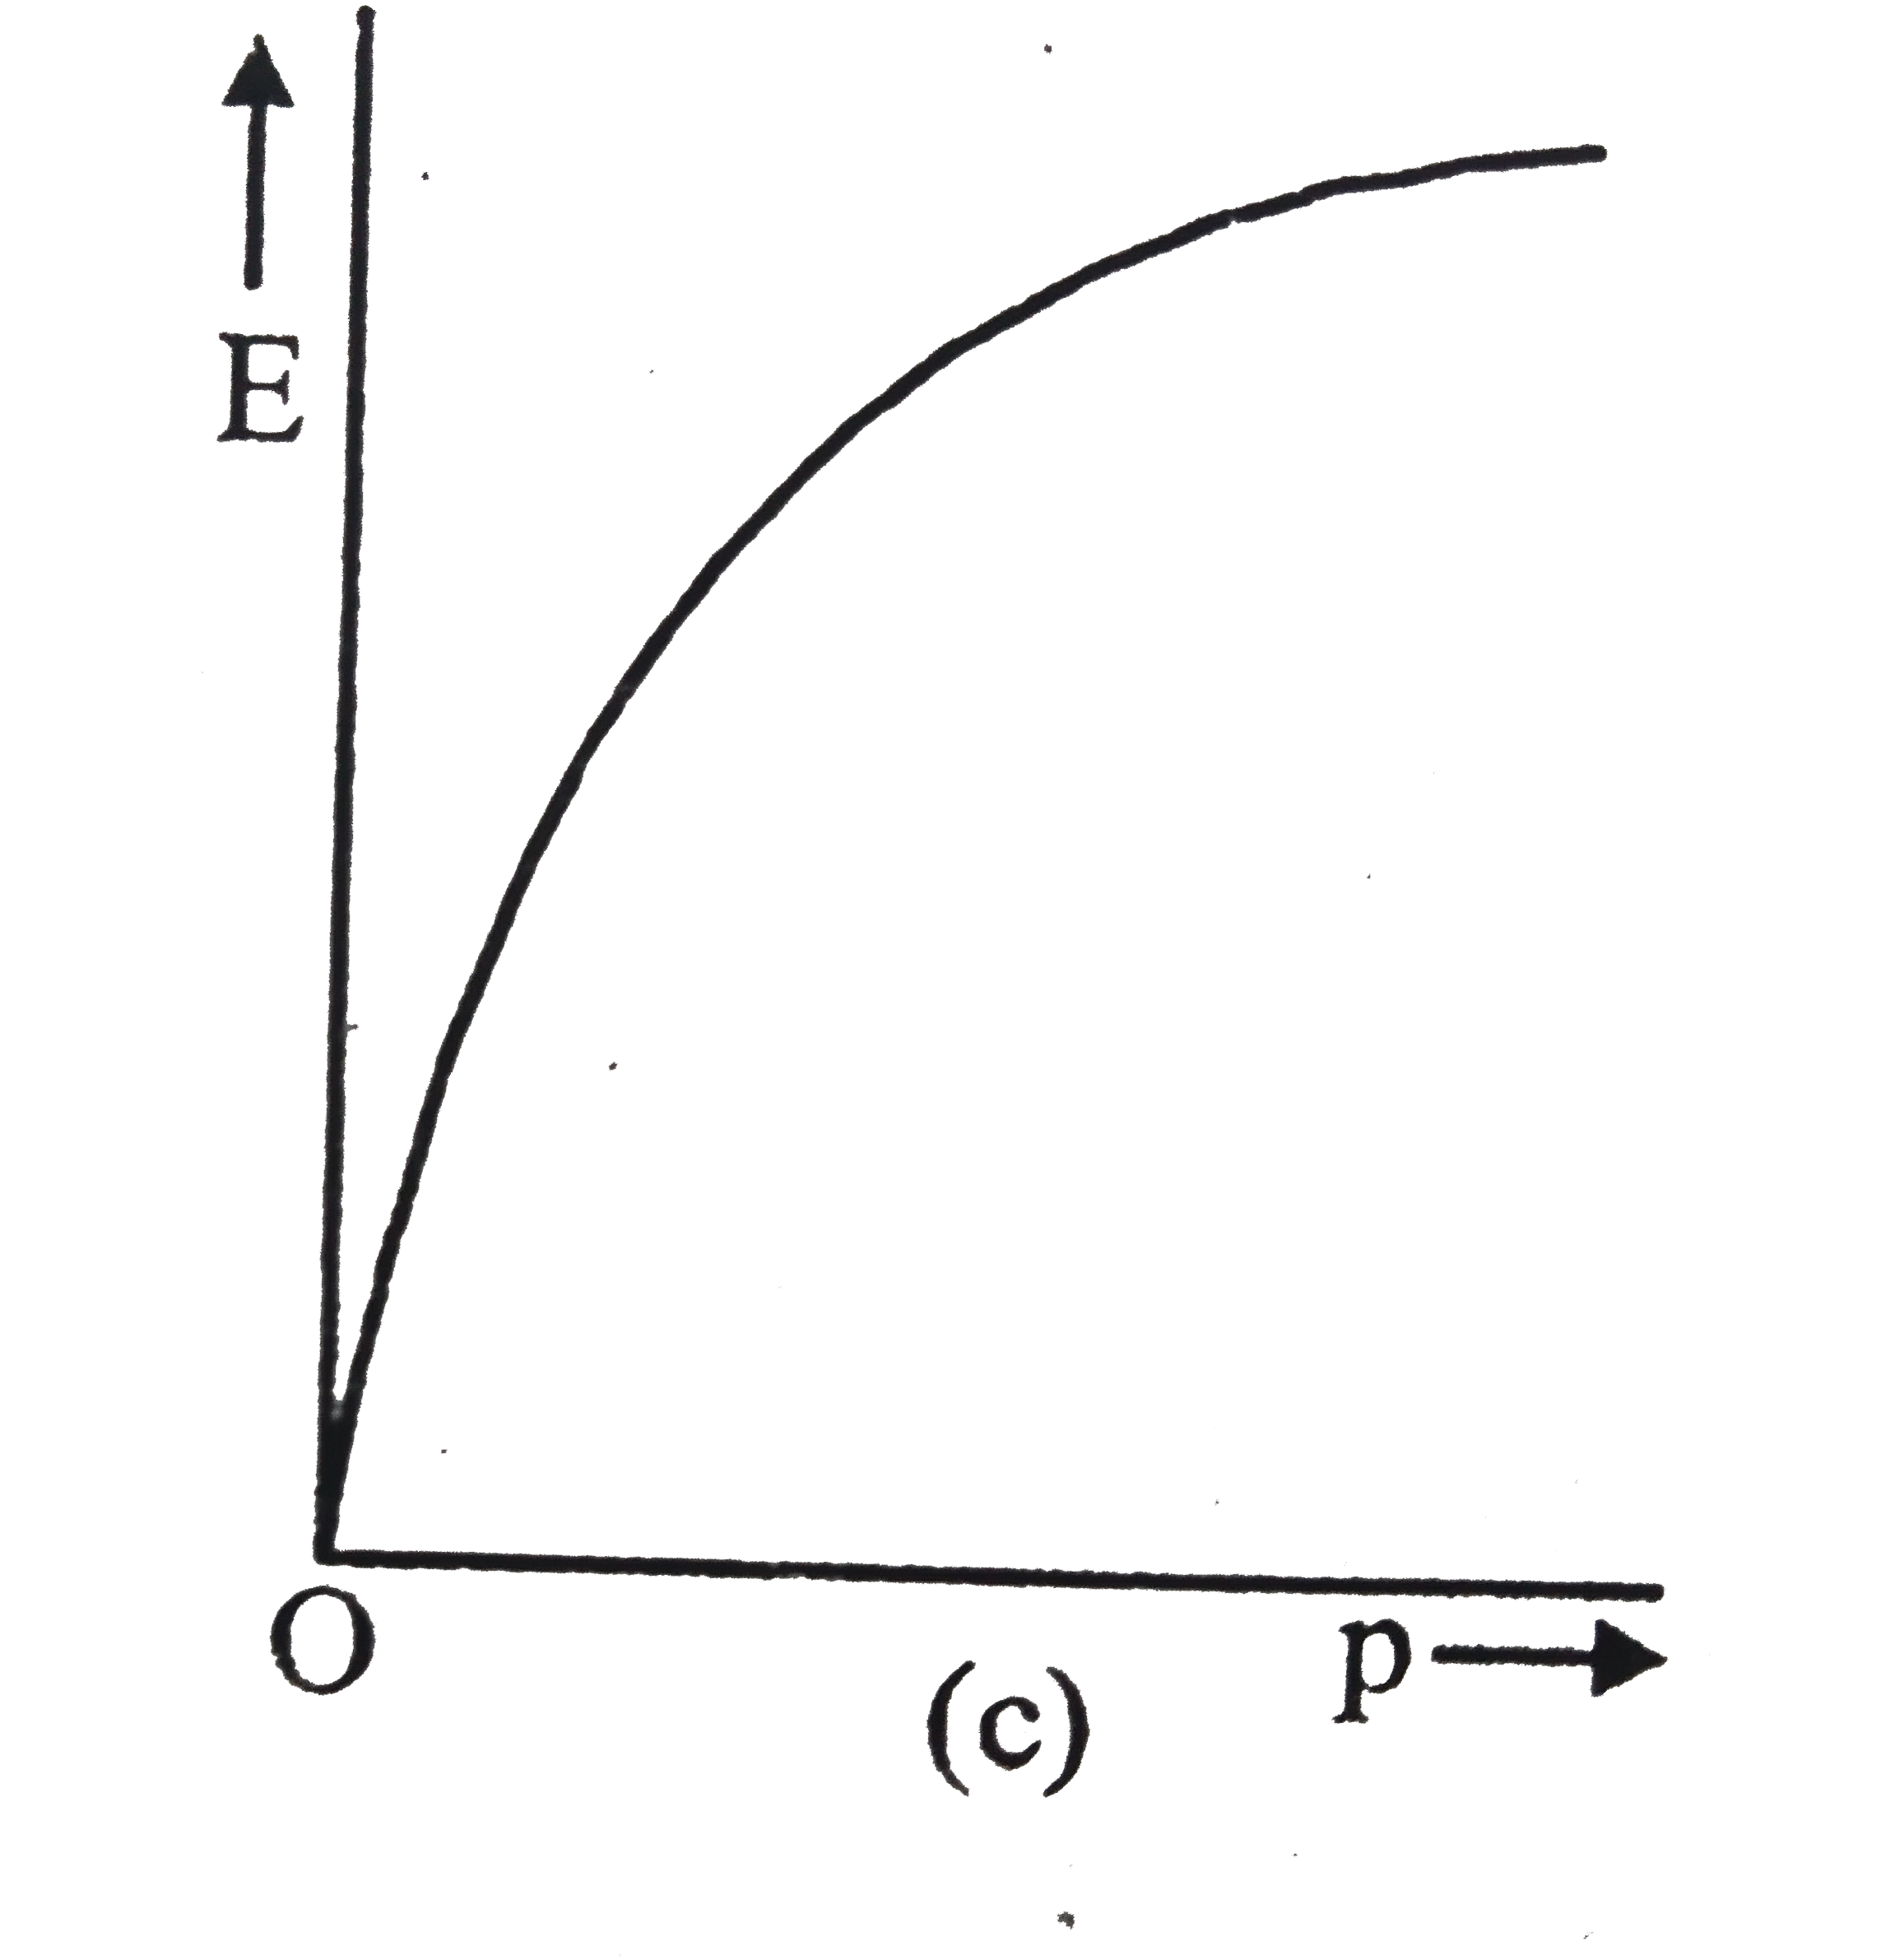 D
D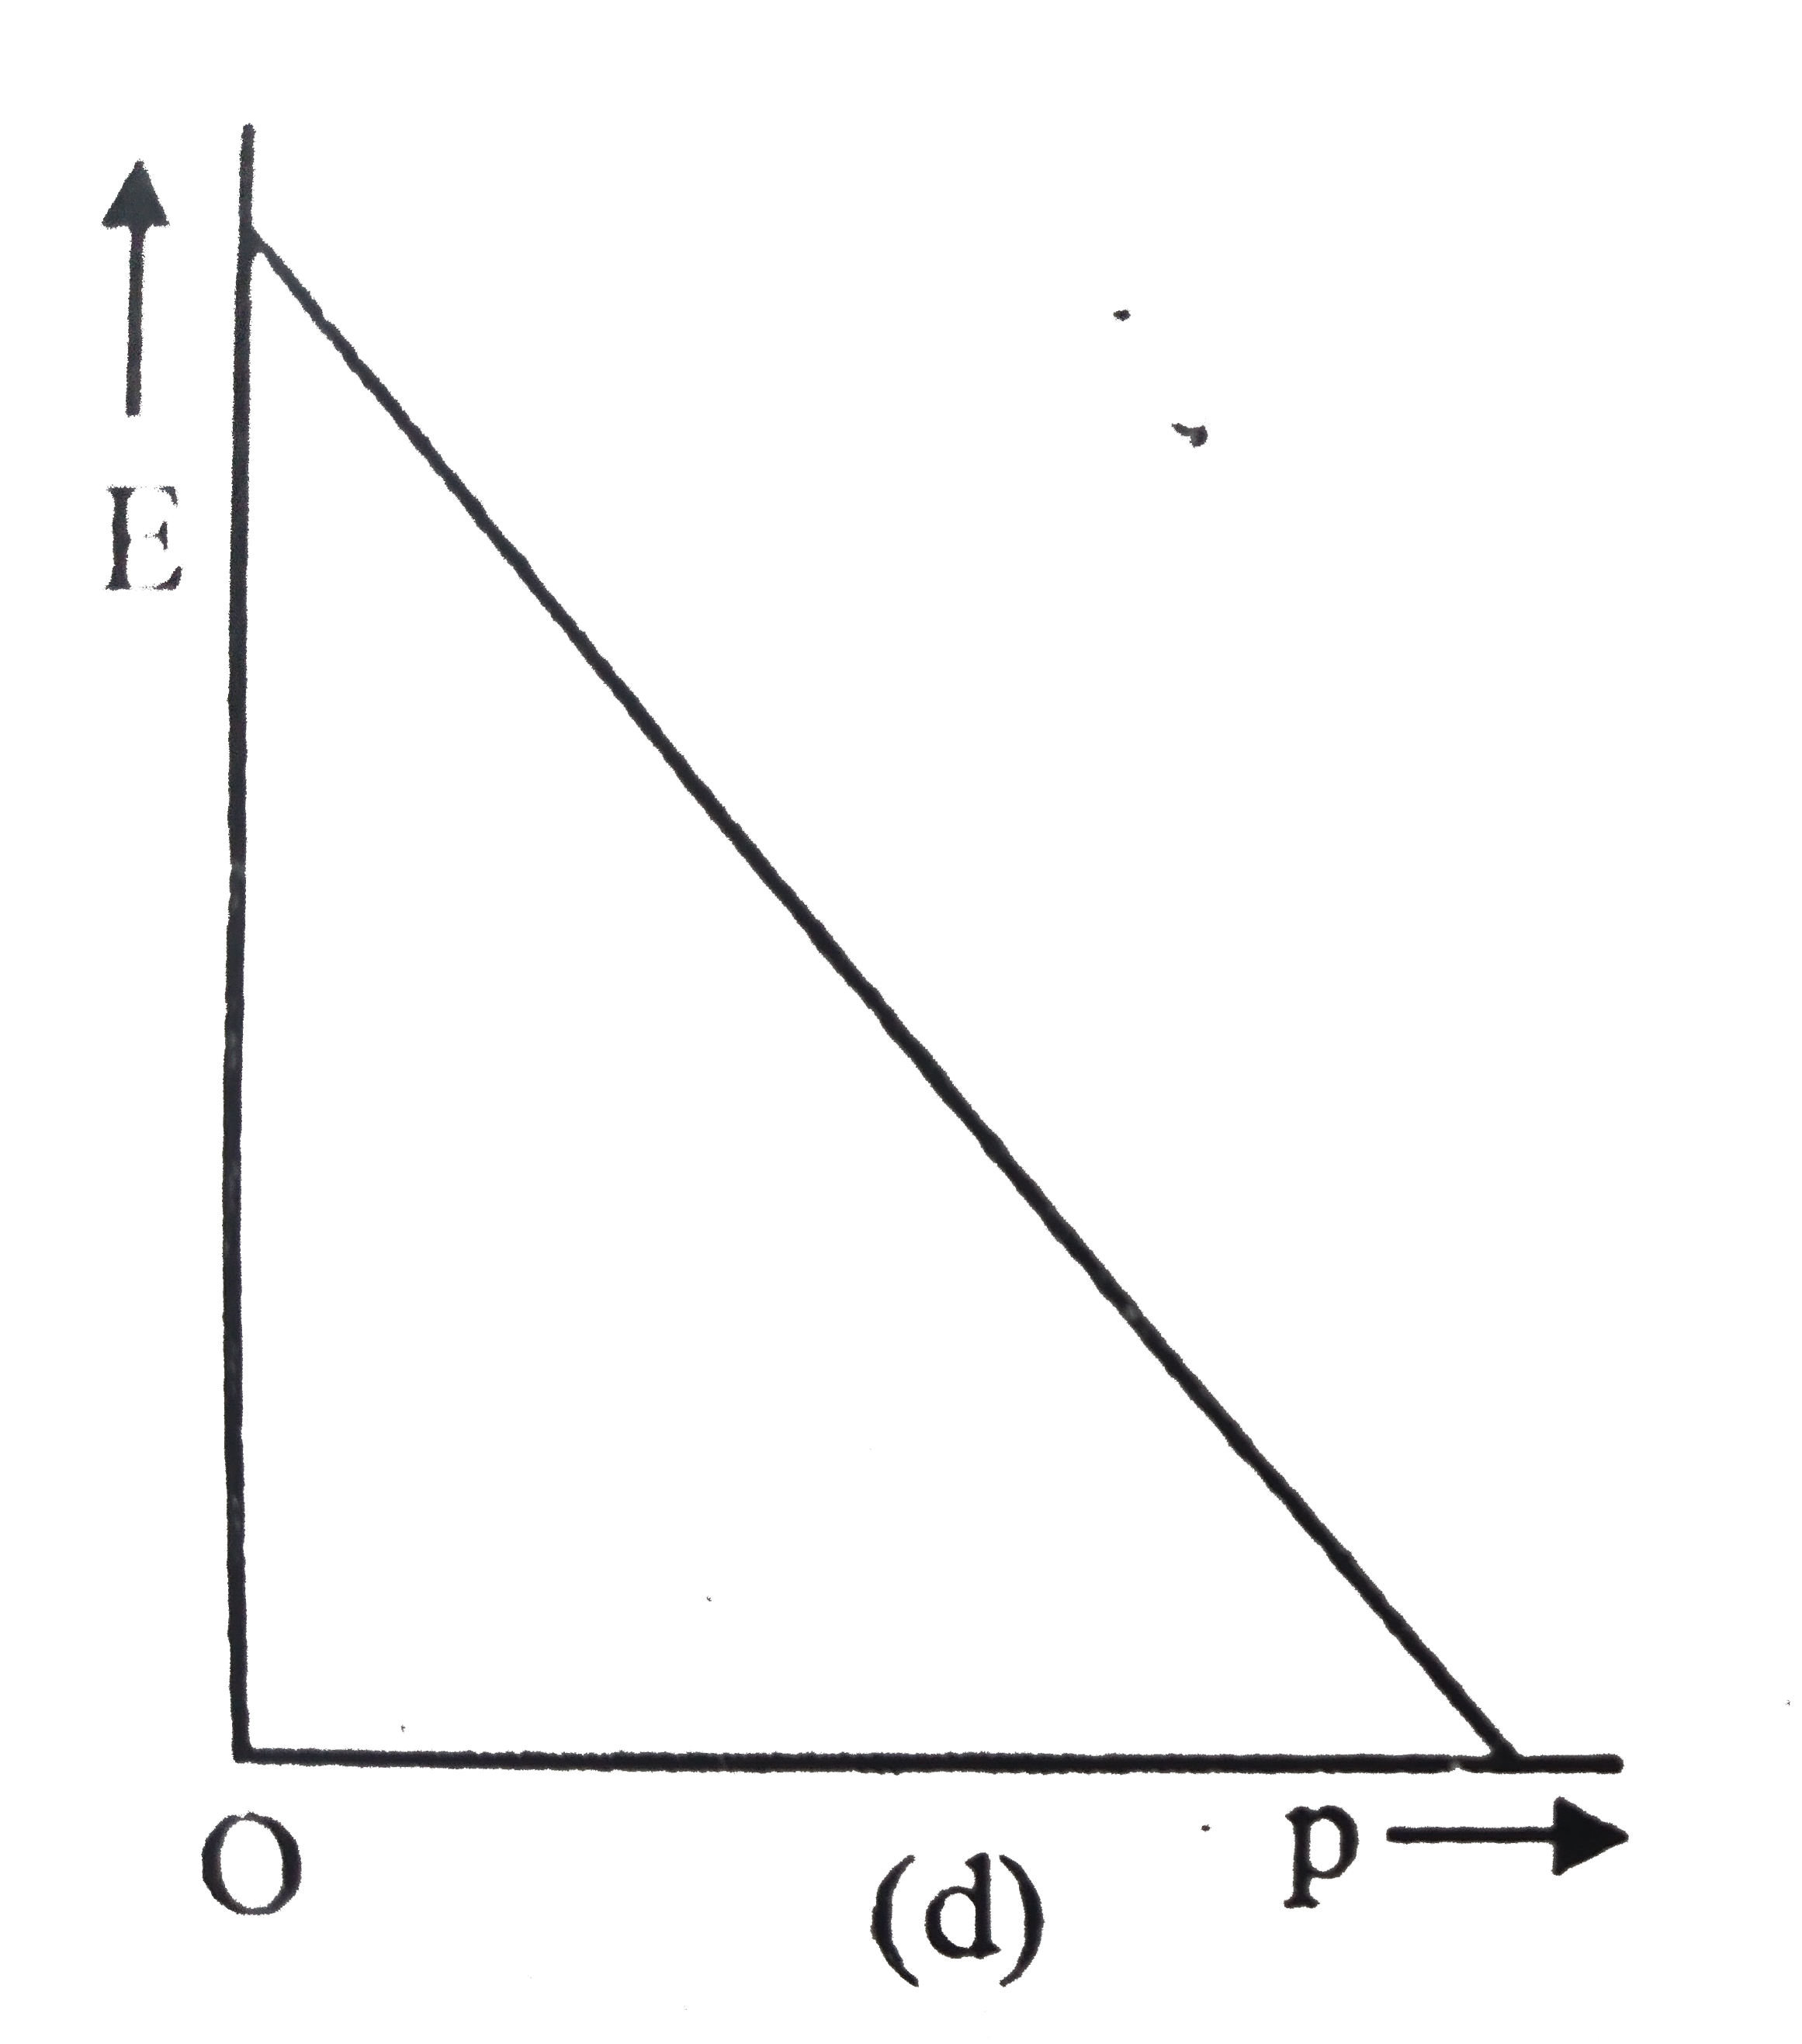
Which of the following graph represents uniform motion
A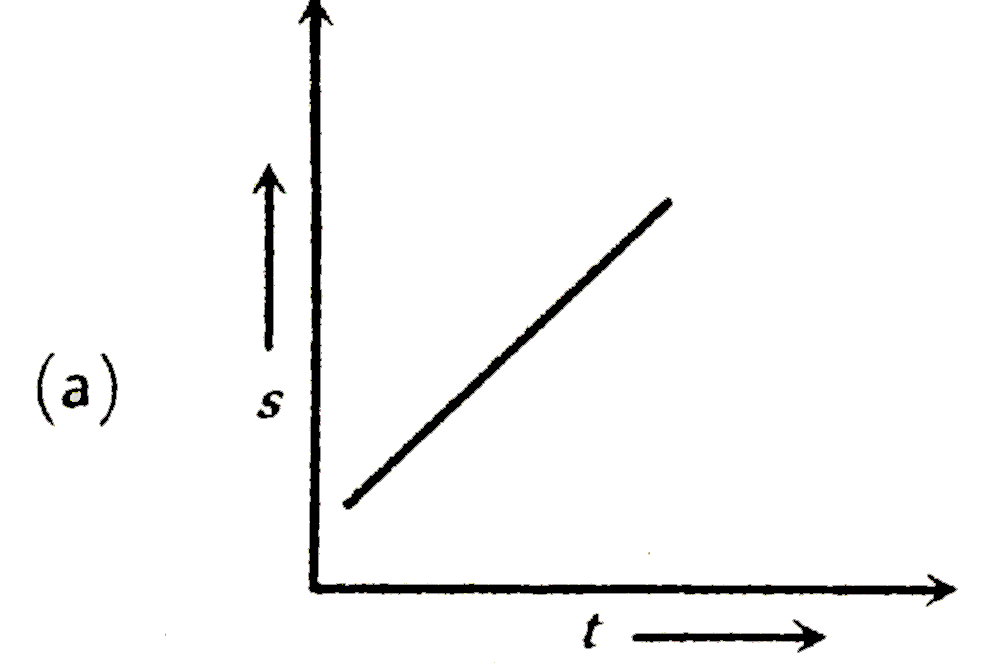 B
B C
C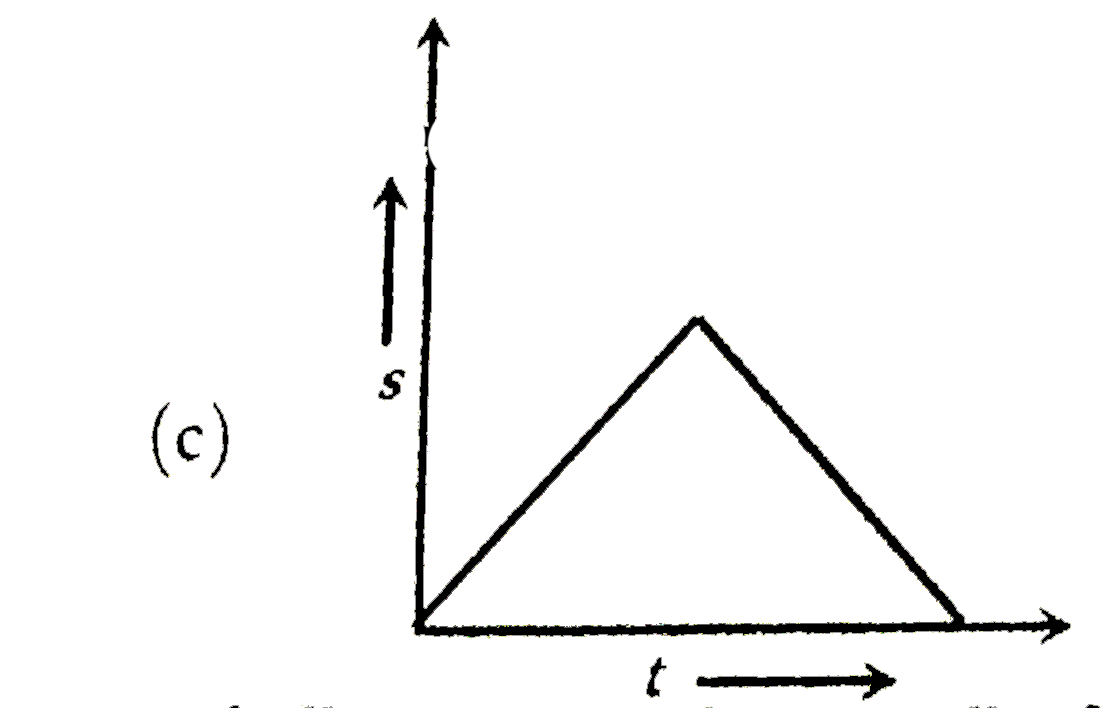 D
D
Which of the following graphs represent a uniformaly accelerated motion ?
View SolutionWhich of following graphs represent accelerated motion ?
View SolutionWhich of the following graphs best represents the motion of a raindrop?
View SolutionRelationship between angular momentum L and kinetic energy E of a rigid body in pure rotation is
View SolutionA body moves from rest with a constant ac- celeration. Which of the following graphs represents the variation of its kinetic energy (E) with distance travelled (x)?
View Solution
