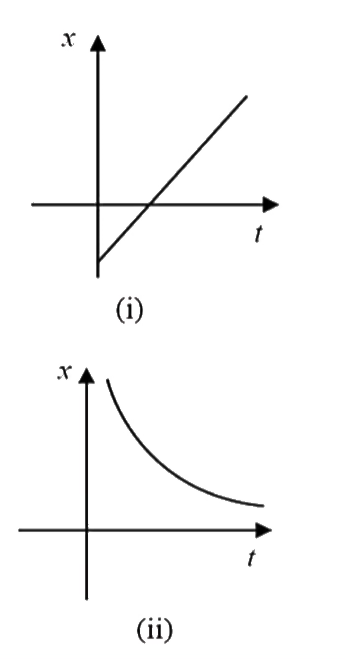
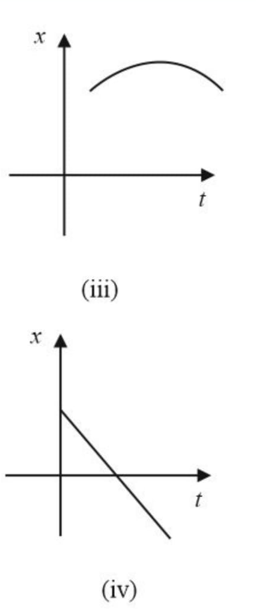
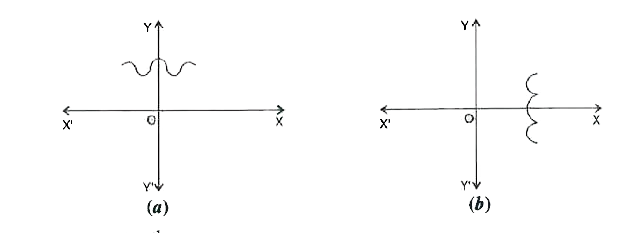
Which of the following graphs best represents the motion of a raindrop?
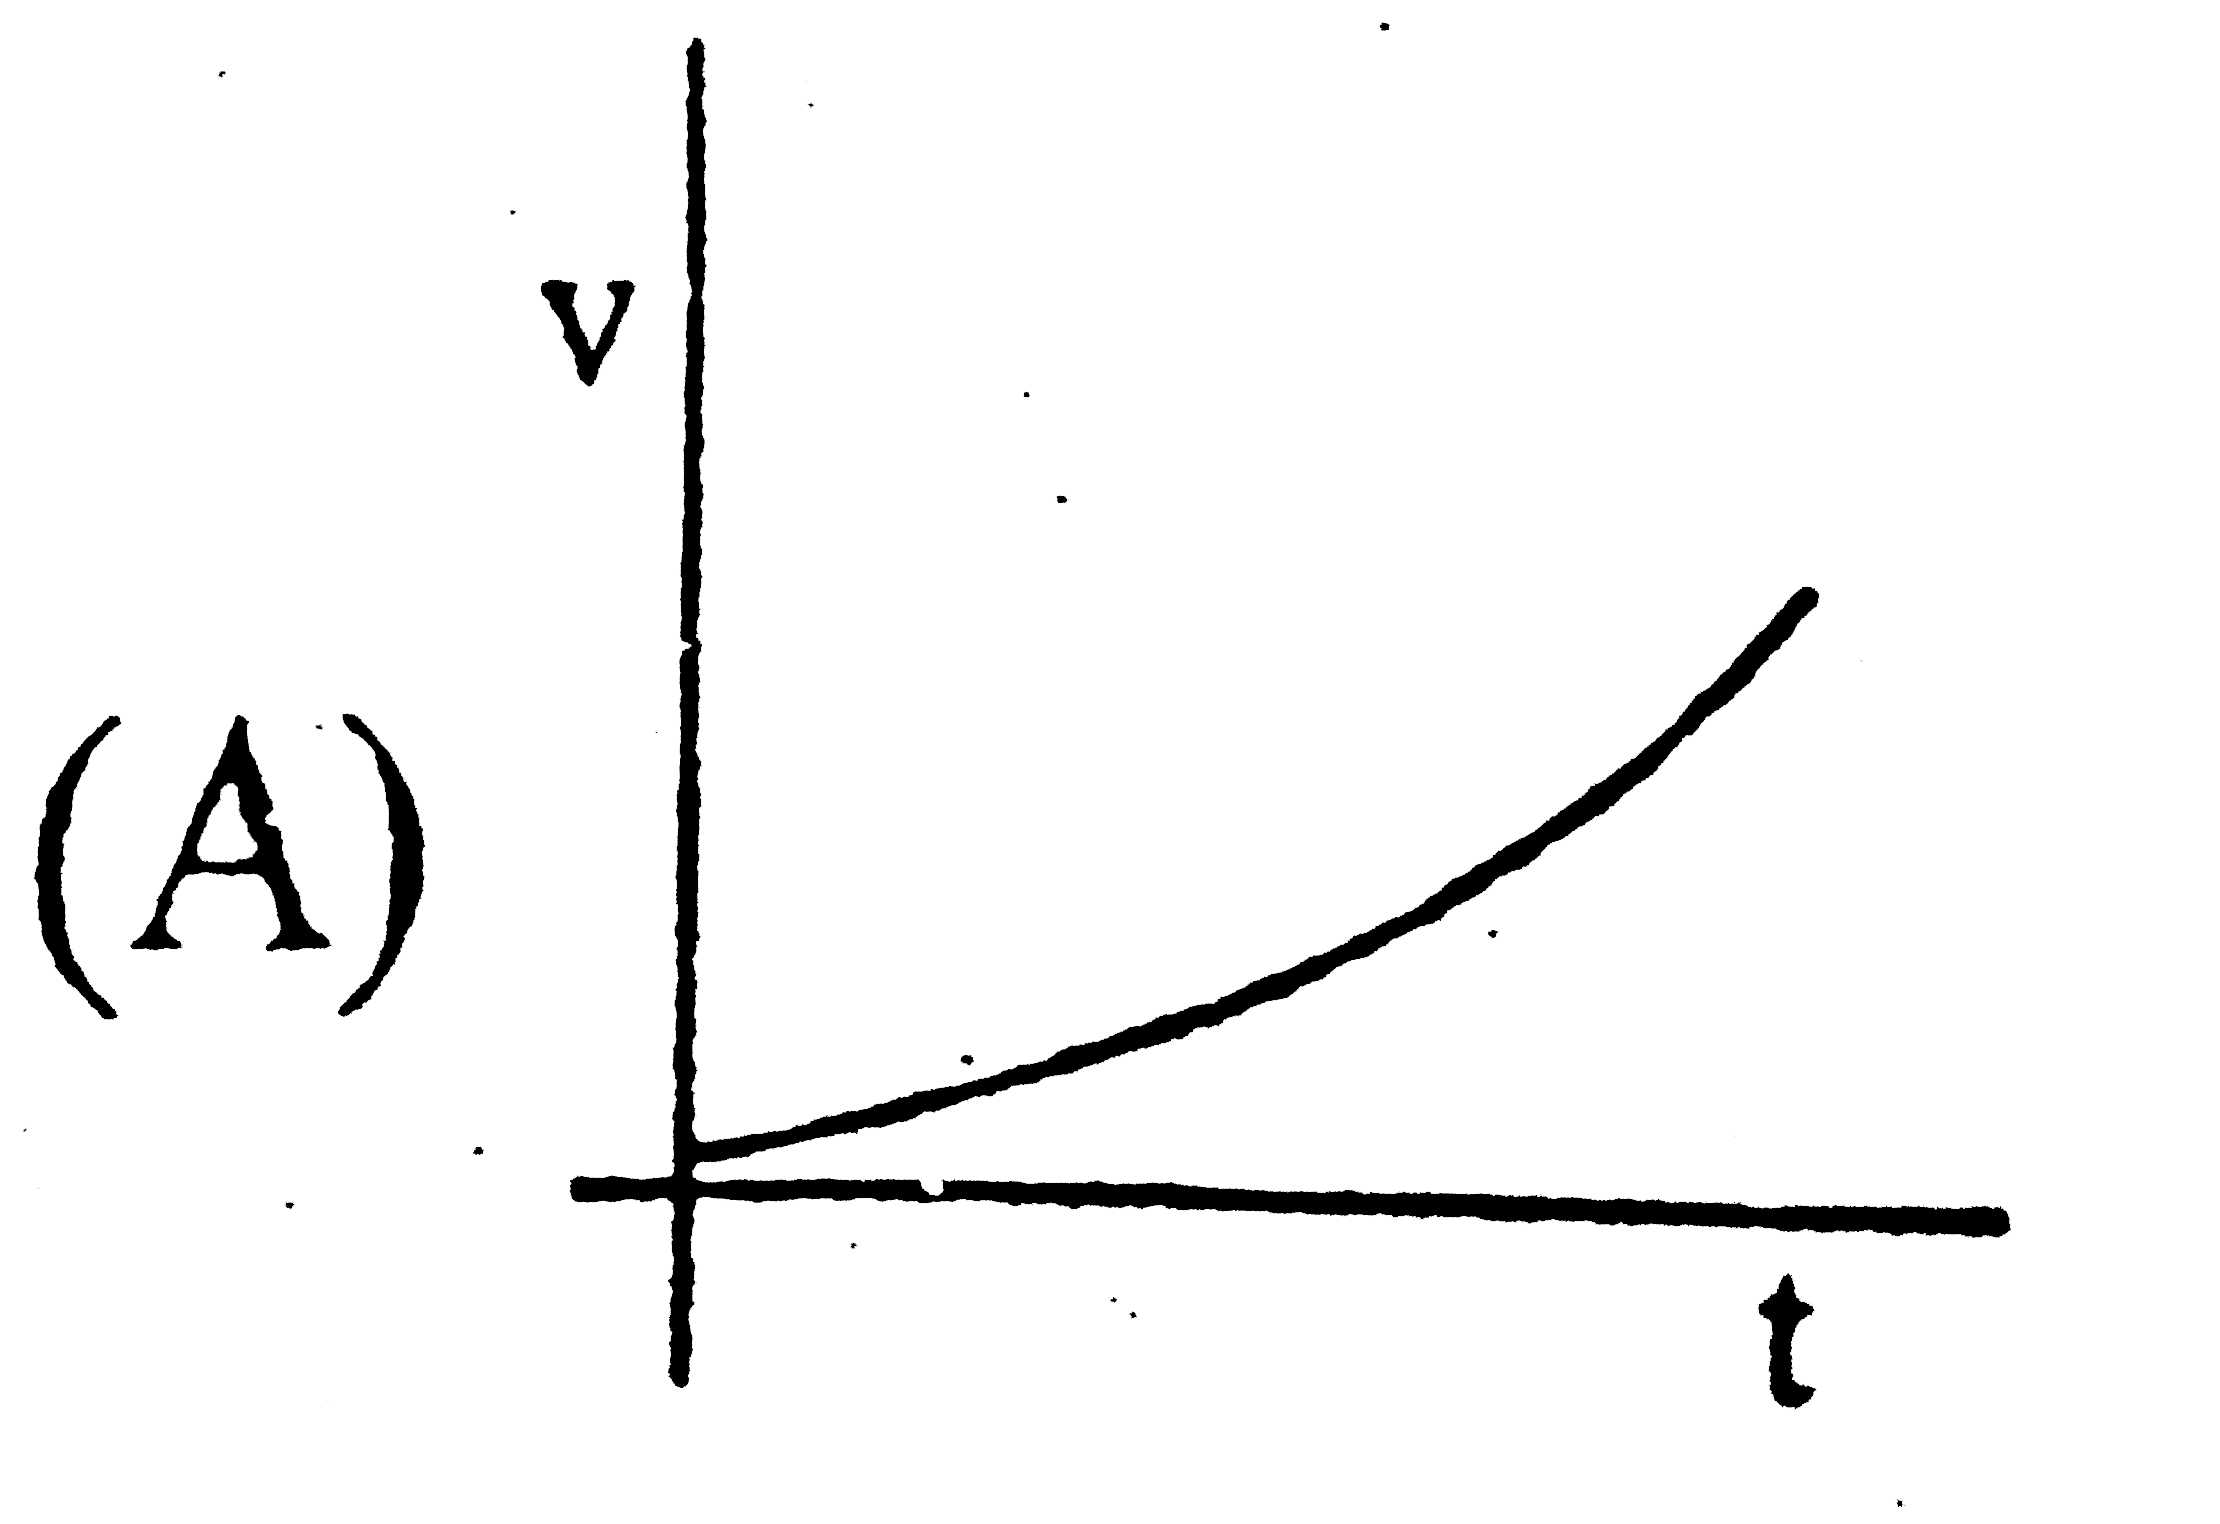
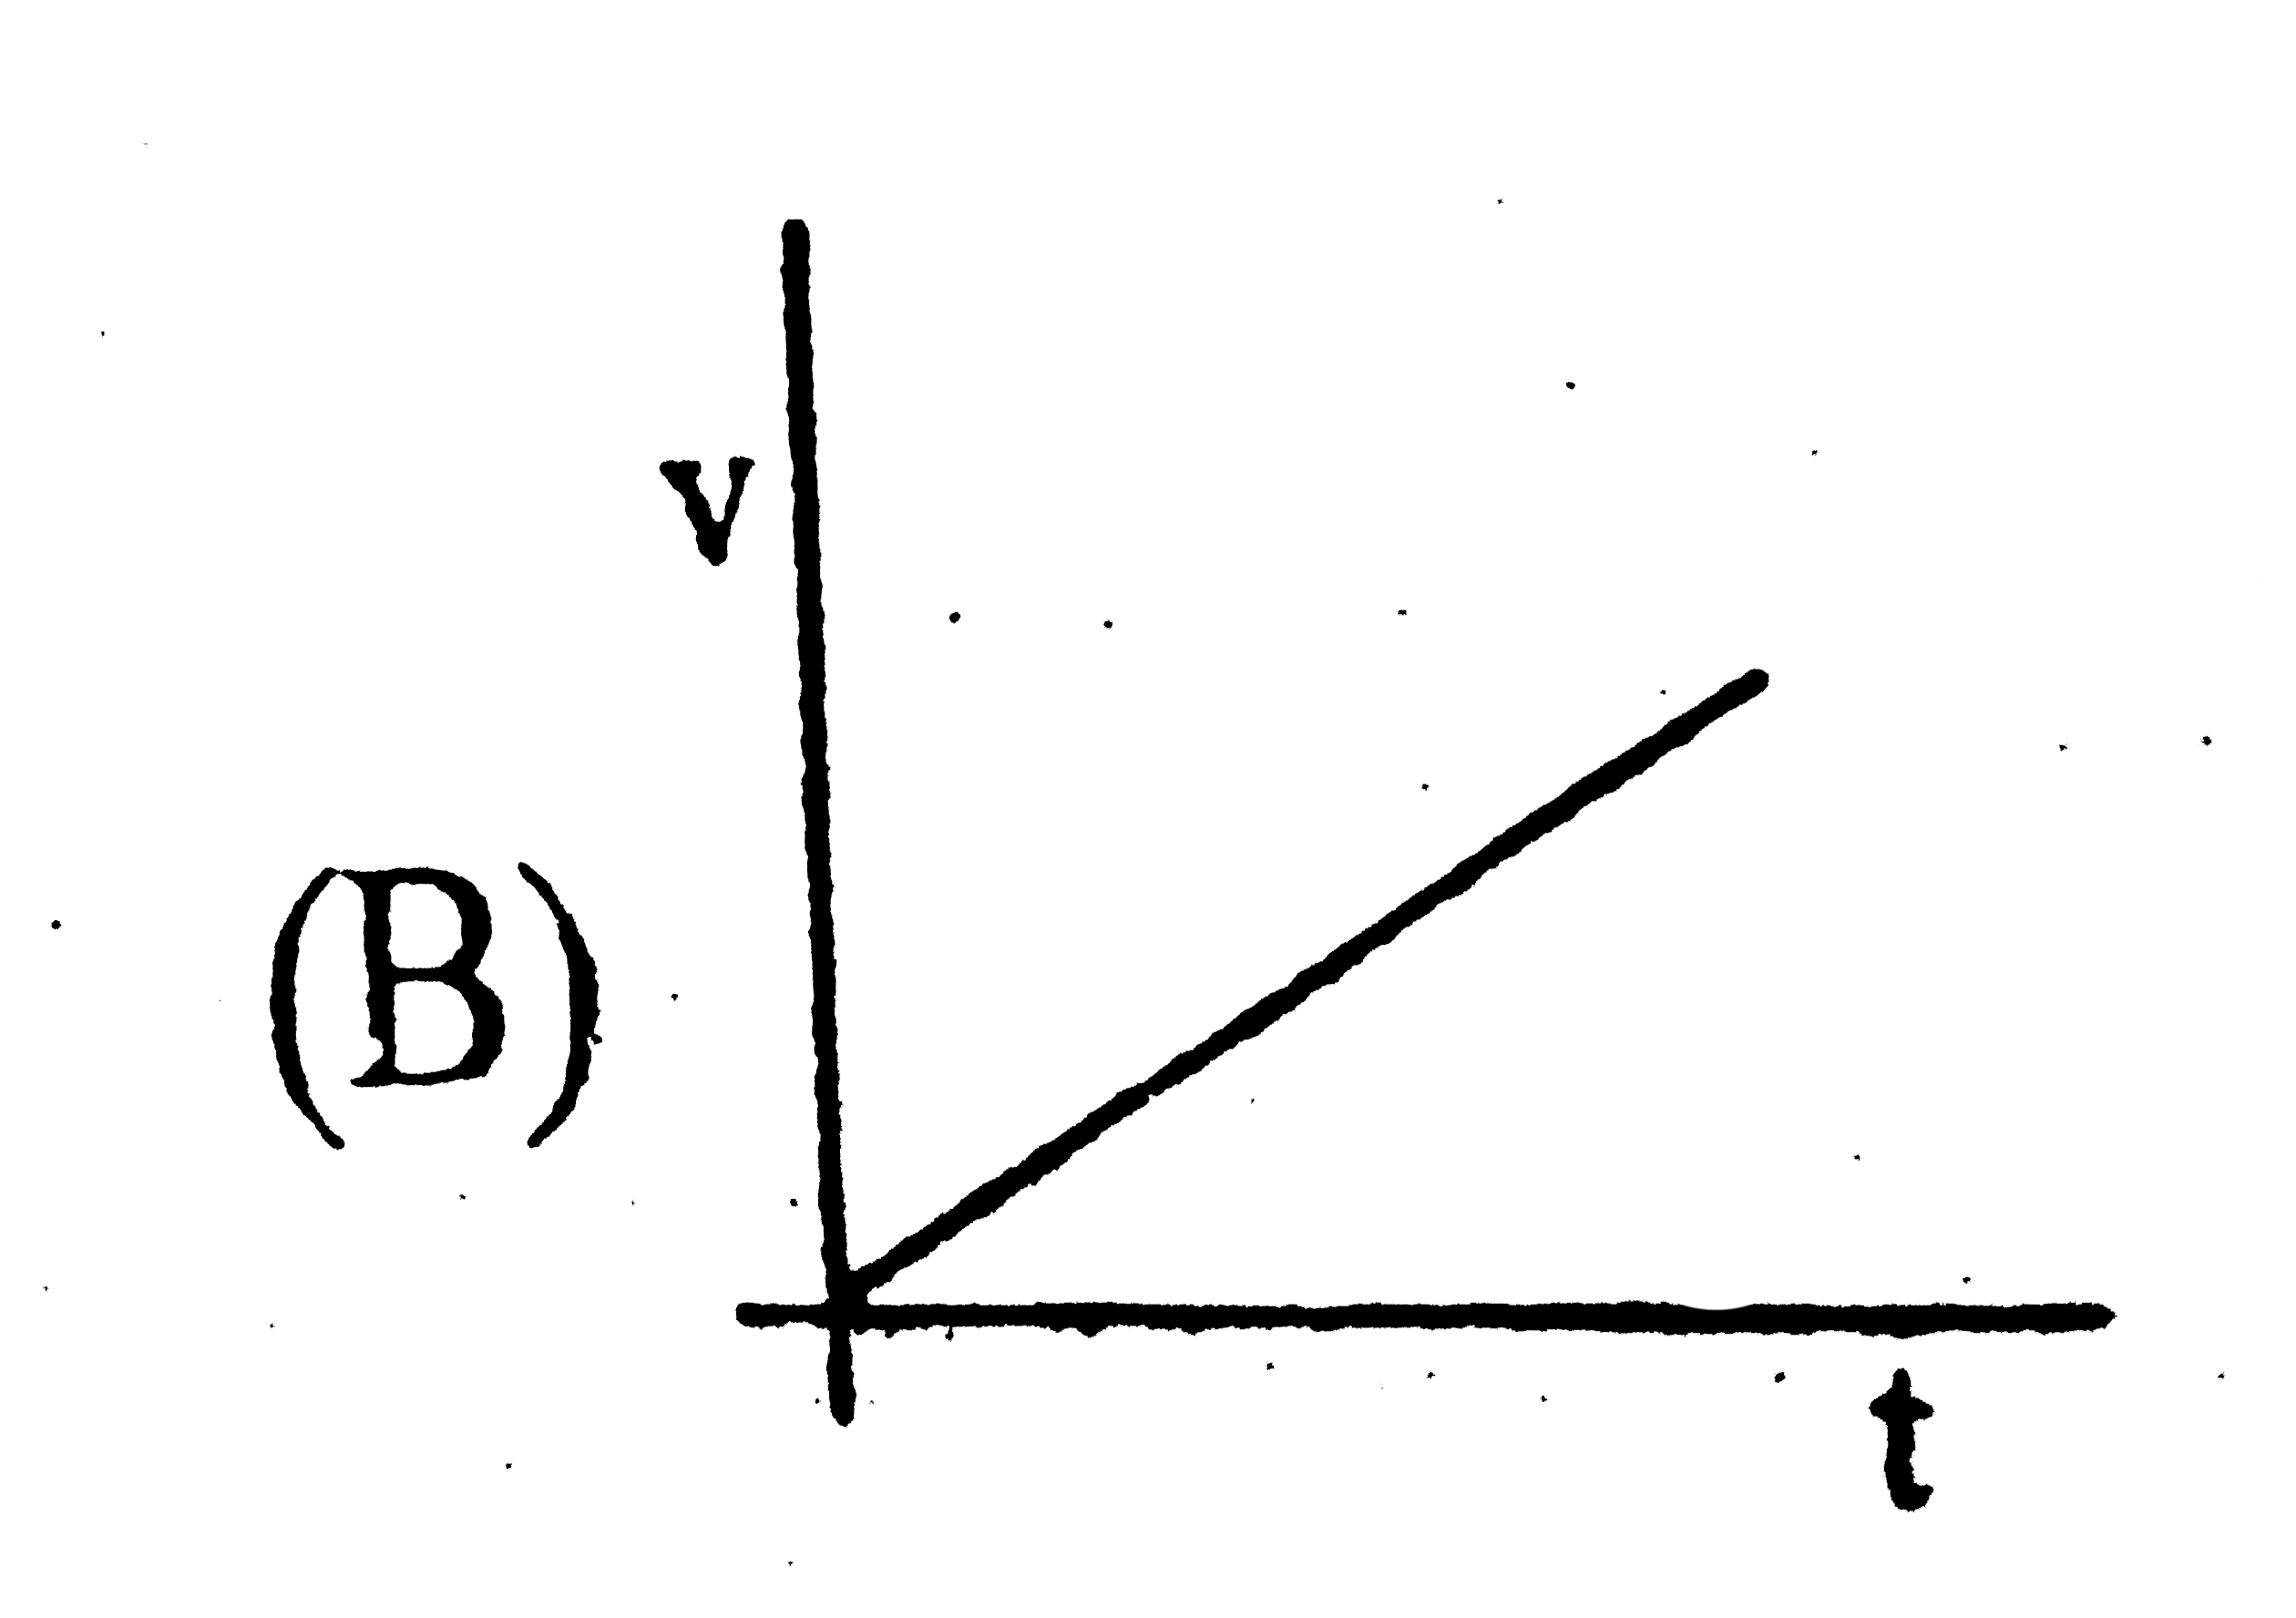
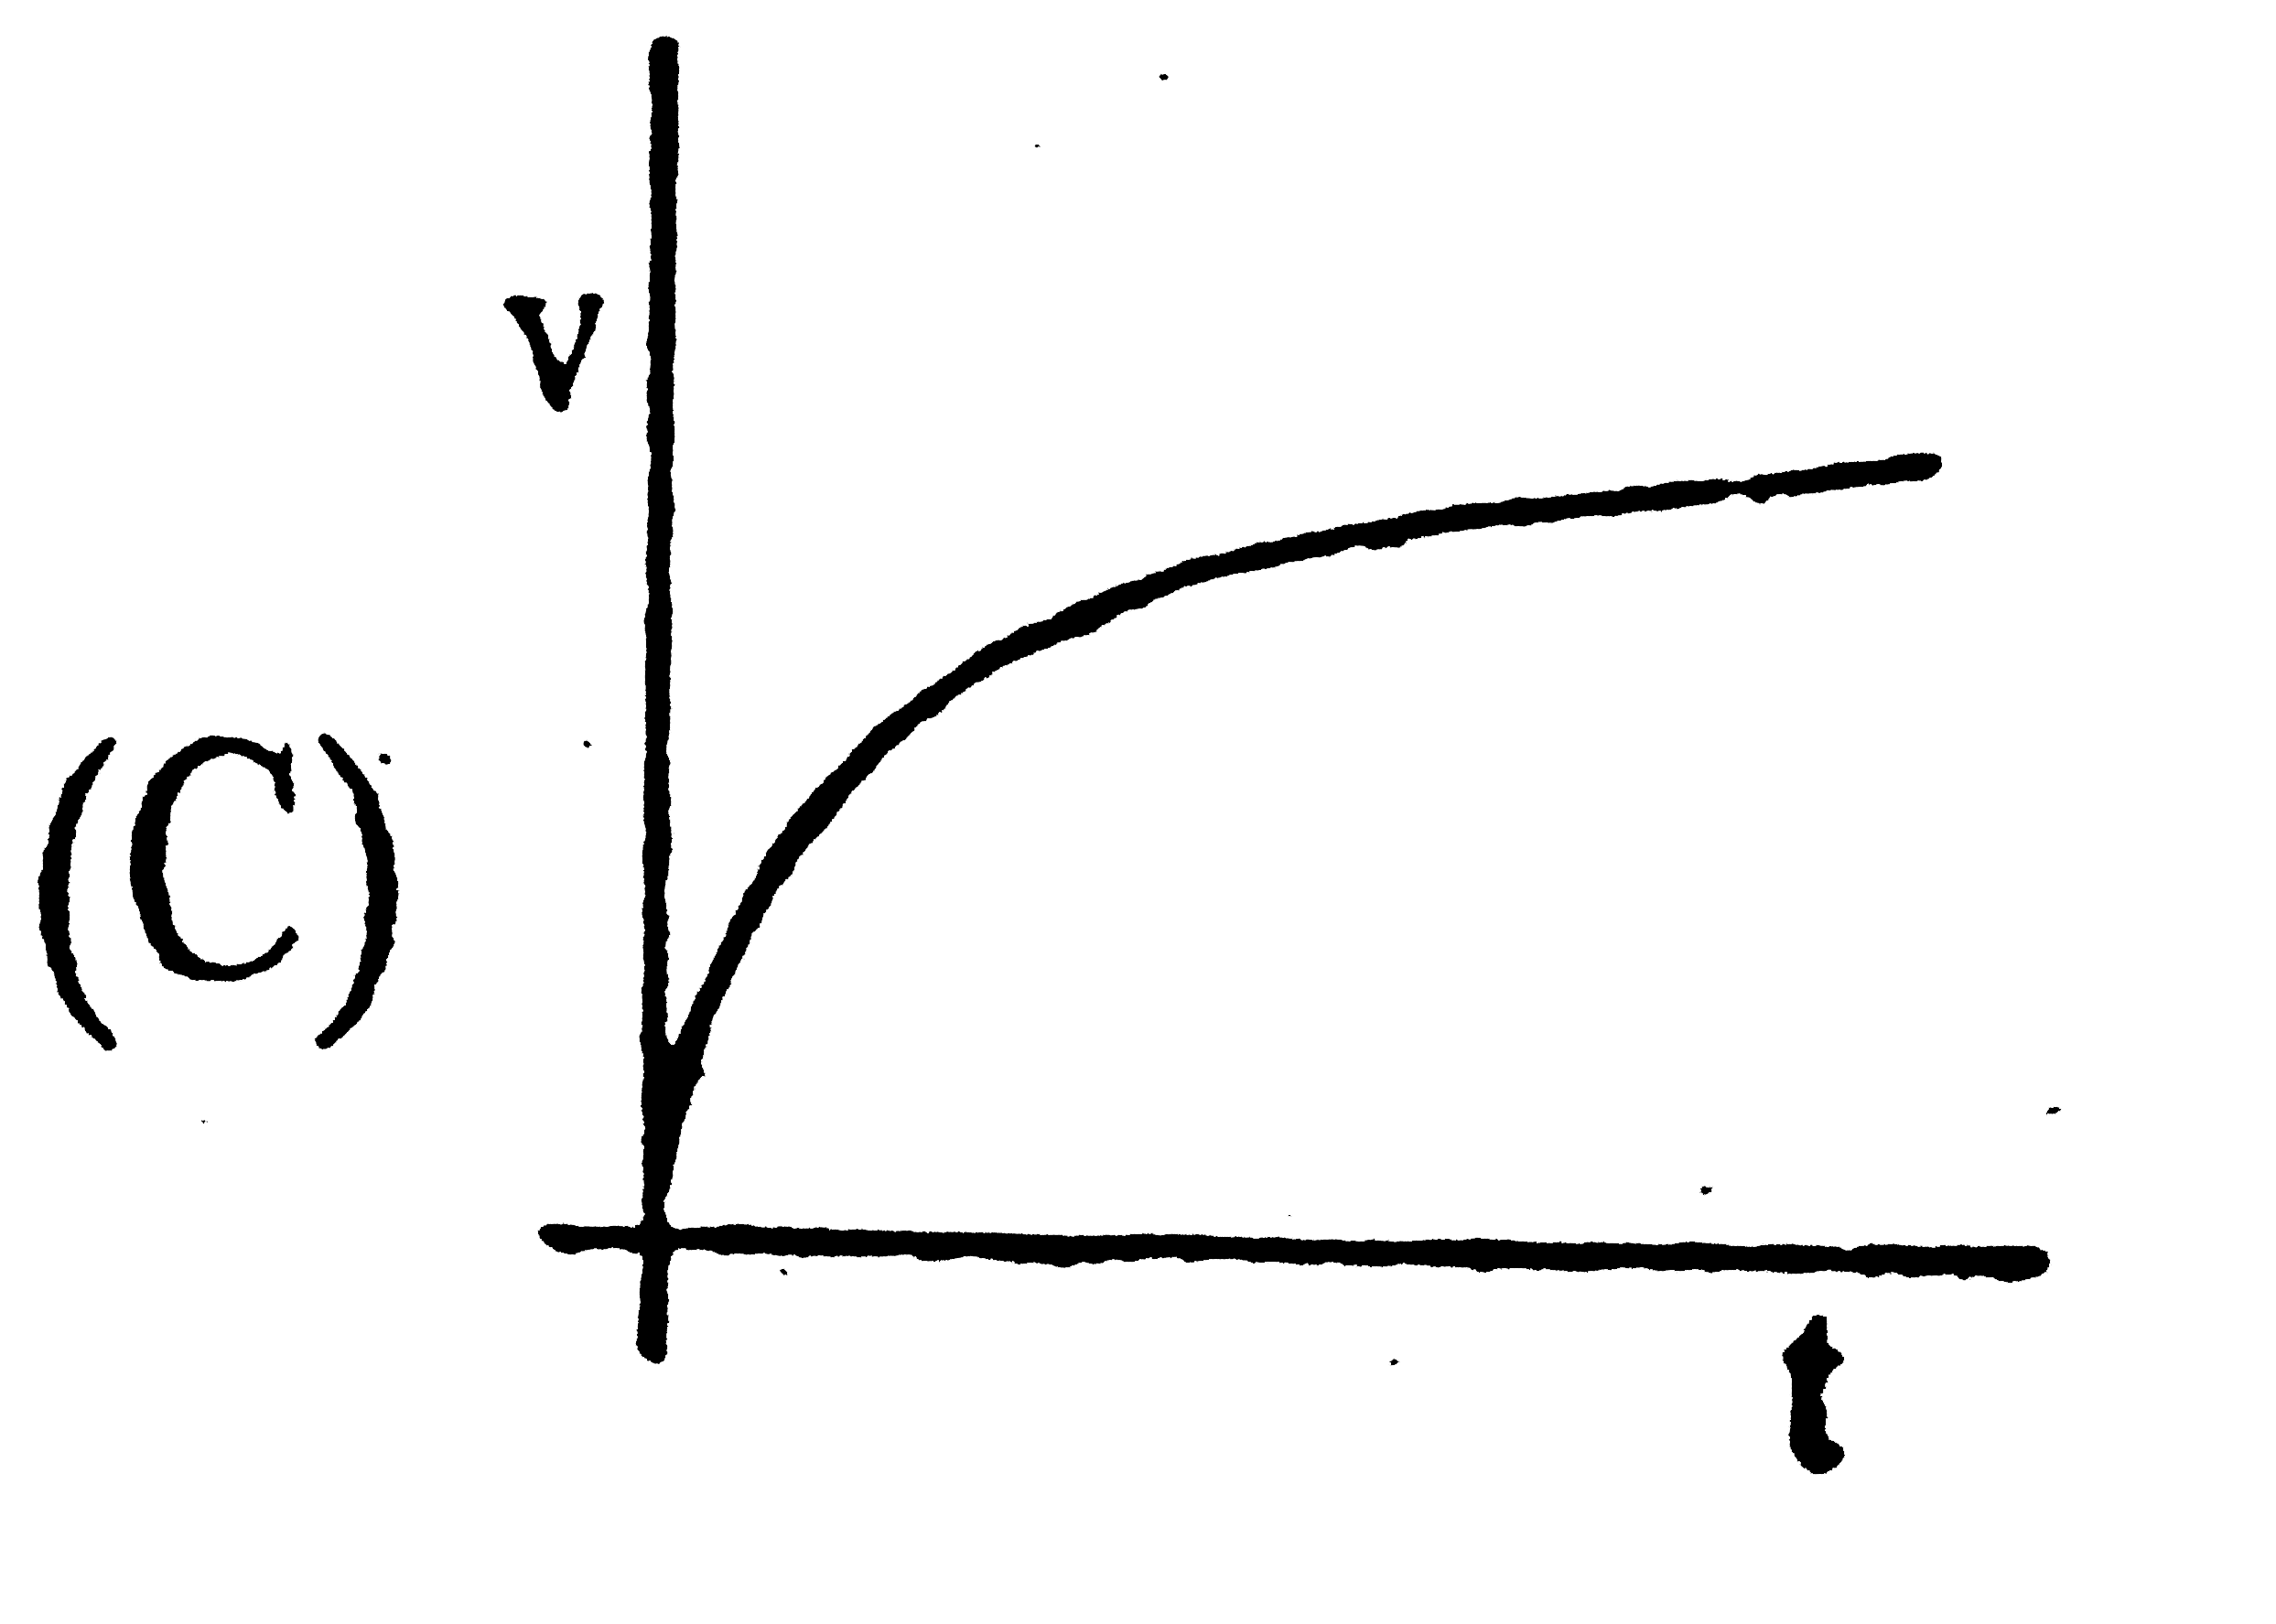
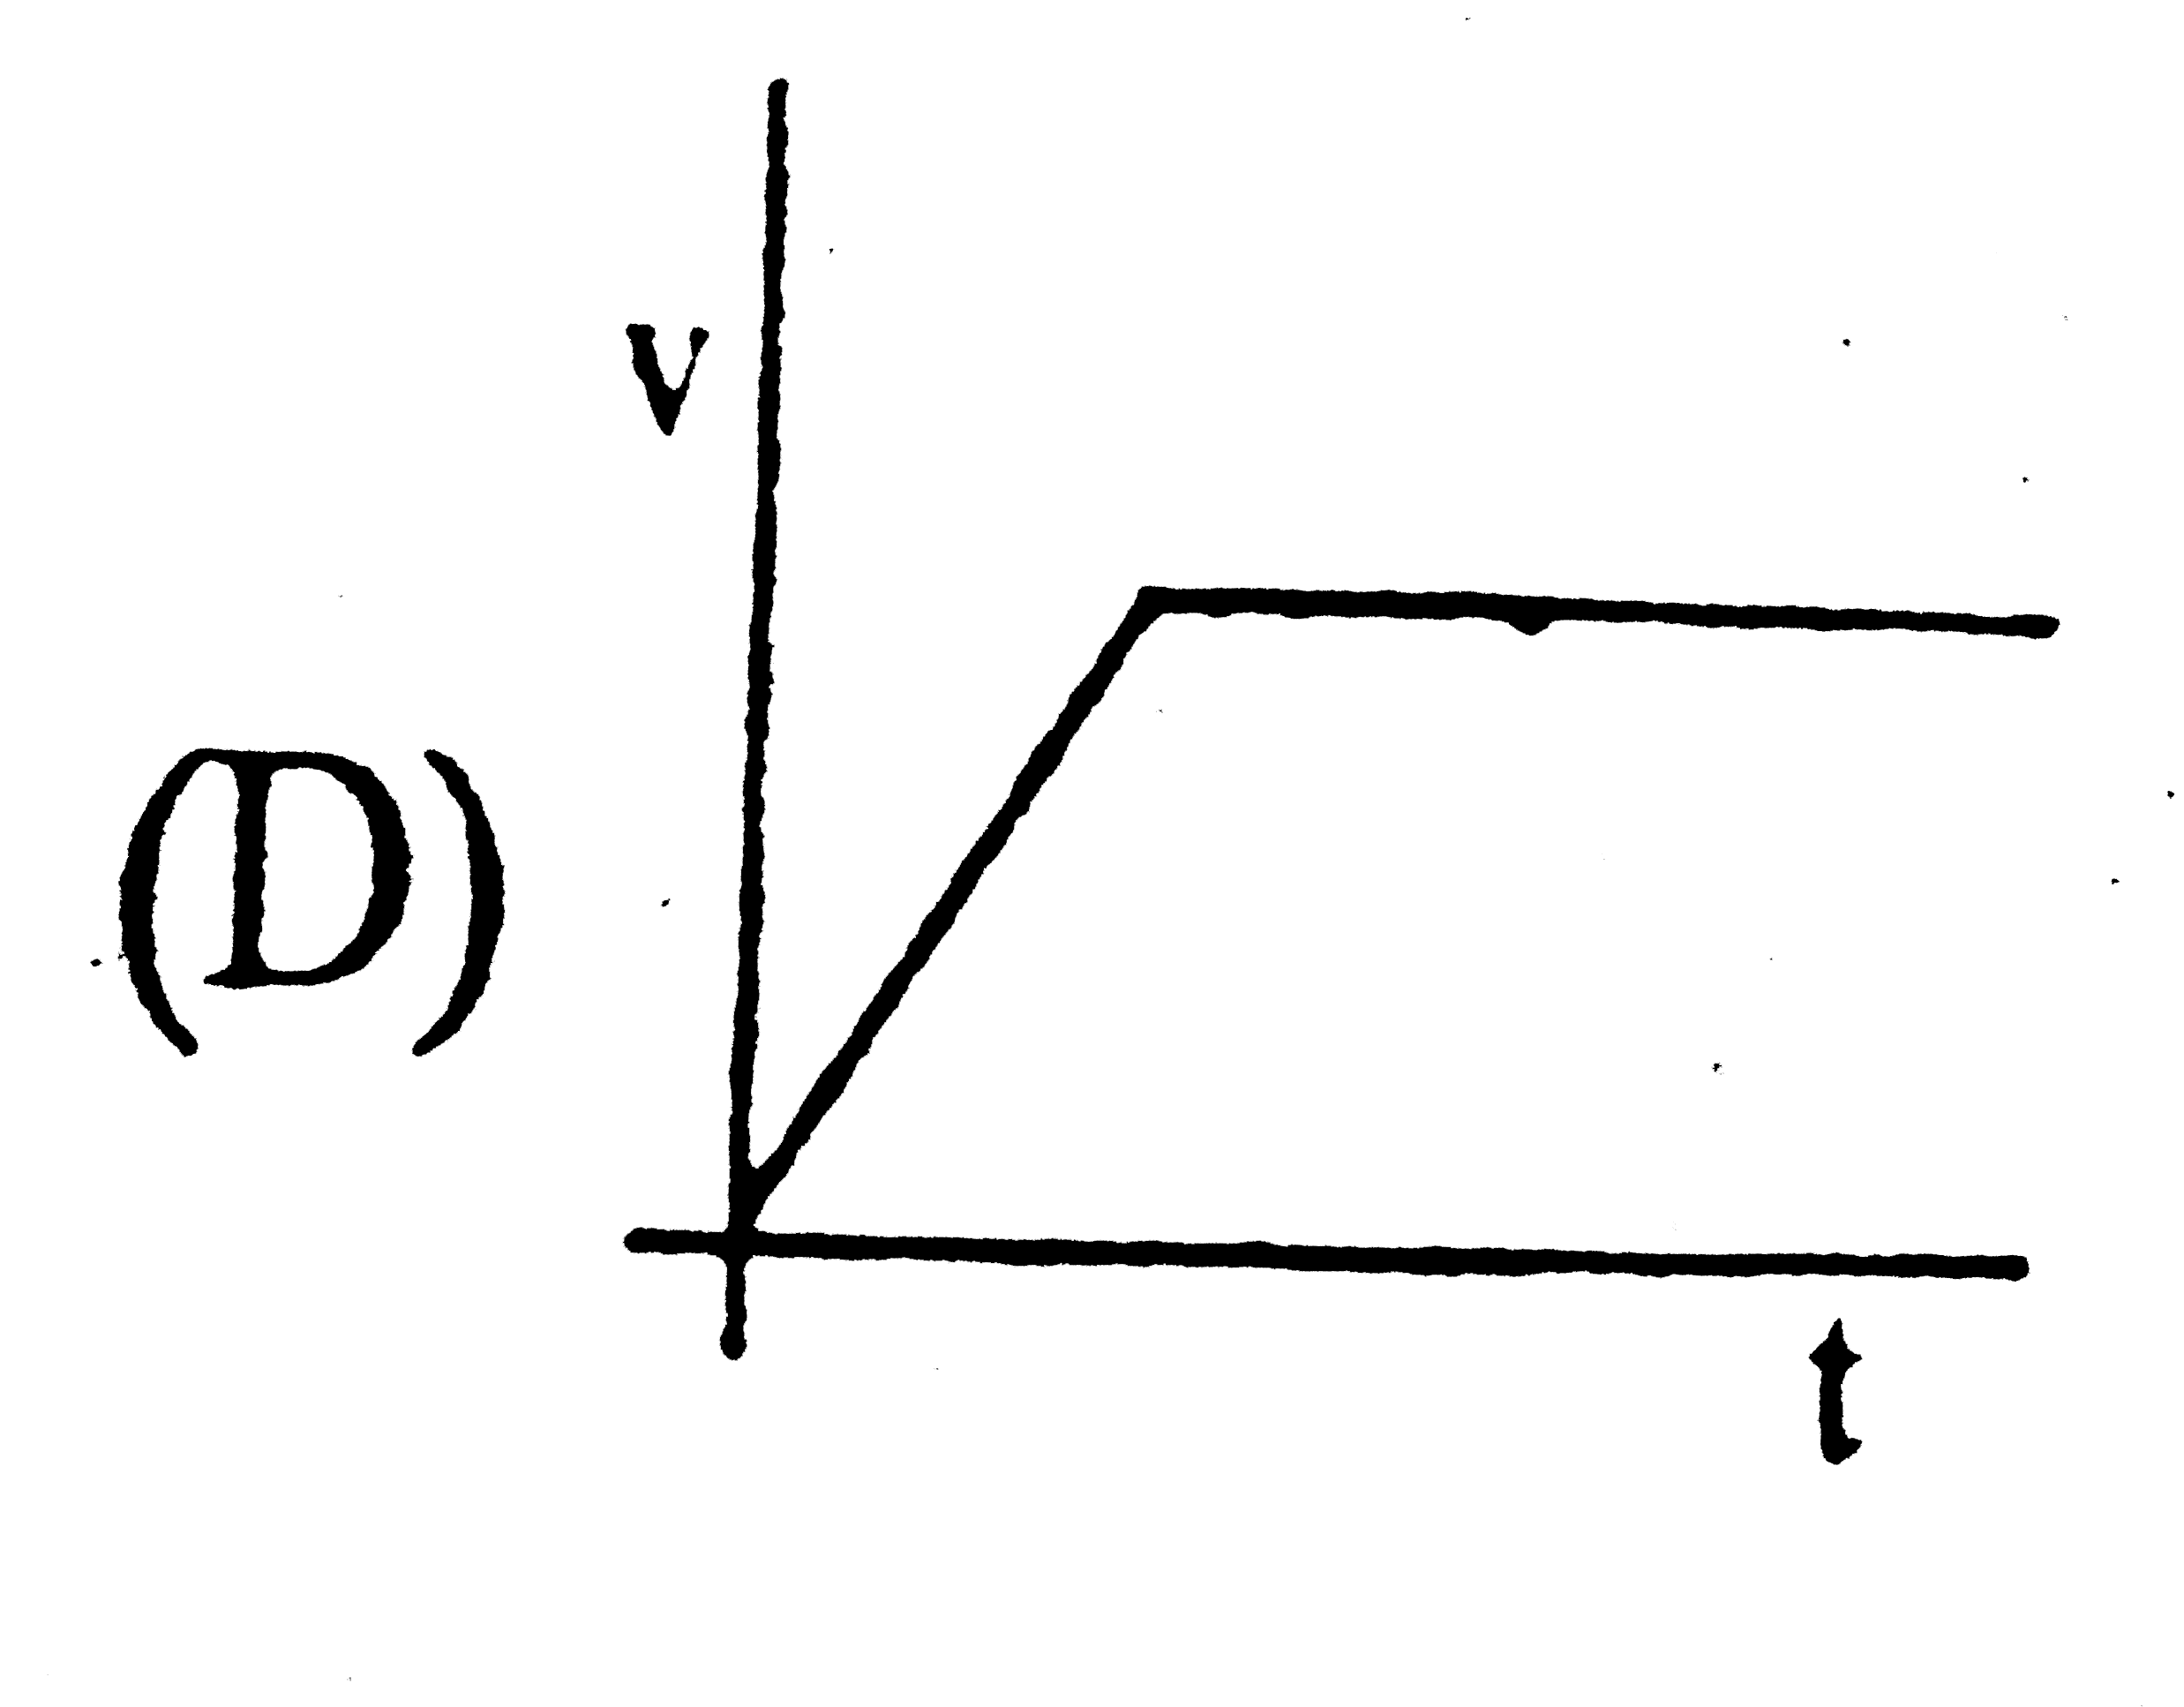
The correct Answer is:C
To determine which graph best represents the motion of a raindrop, we need to analyze the forces acting on the raindrop and how its velocity changes over time.
1. Identify the Forces:
- When a raindrop falls, it experiences two main forces: gravitational force (downward) and drag force (upward).
- The gravitational force acting on the raindrop is given by mg, where m is the mass of the raindrop and g is the acceleration due to gravity.
- The drag force can be expressed as Fd=6ηrv, where η is the viscosity of the fluid (air), r is the radius of the raindrop, and v is its velocity.
2. Set Up the Equation of Motion:
- According to Newton's second law, the net force acting on the raindrop can be expressed as:
mg−6ηrv=ma
- Here, a is the acceleration of the raindrop, which can be expressed as dvdt.
3. Rearranging the Equation:
- Rearranging the equation gives:
mg−6ηrv=mdvdt
- This can be rewritten as:
dvdt=mg−6ηrvm
4. Separating Variables:
- We can separate the variables to integrate:
dt=mmg−6ηrvdv
5. Integrating Both Sides:
- Integrate both sides:
- The left side integrates from 0 to t.
- The right side integrates from 0 to v.
- This results in:
t=∫v0mmg−6ηrvdv
6. Finding the Velocity Equation:
- After performing the integration, we find that the velocity v approaches a terminal velocity Vt as time increases:
Vt=mg6ηr
- The velocity increases exponentially over time until it reaches this terminal velocity.
7. Graph Representation:
- The graph of velocity versus time for a raindrop will show an exponential increase, starting from zero and approaching the terminal velocity asymptotically.
8. Conclusion:
- Therefore, the graph that best represents the motion of a raindrop is one that shows an exponential increase in velocity over time, which corresponds to option C.
- When a raindrop falls, it experiences two main forces: gravitational force (downward) and drag force (upward).
- The gravitational force acting on the raindrop is given by mg, where m is the mass of the raindrop and g is the acceleration due to gravity.
- The drag force can be expressed as Fd=6ηrv, where η is the viscosity of the fluid (air), r is the radius of the raindrop, and v is its velocity.
- According to Newton's second law, the net force acting on the raindrop can be expressed as:
mg−6ηrv=ma
- Here, a is the acceleration of the raindrop, which can be expressed as dvdt.
- Rearranging the equation gives:
mg−6ηrv=mdvdt
- This can be rewritten as:
dvdt=mg−6ηrvm
- We can separate the variables to integrate:
dt=mmg−6ηrvdv
- Integrate both sides:
- The left side integrates from 0 to t.
- The right side integrates from 0 to v.
- This results in:
t=∫v0mmg−6ηrvdv
- After performing the integration, we find that the velocity v approaches a terminal velocity Vt as time increases:
Vt=mg6ηr
- The velocity increases exponentially over time until it reaches this terminal velocity.
- The graph of velocity versus time for a raindrop will show an exponential increase, starting from zero and approaching the terminal velocity asymptotically.
- Therefore, the graph that best represents the motion of a raindrop is one that shows an exponential increase in velocity over time, which corresponds to option C.
Topper's Solved these Questions
Similar Questions
Knowledge Check
Which of the following graph represents e−x?
A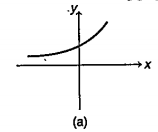 B
B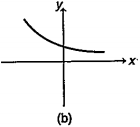 C
C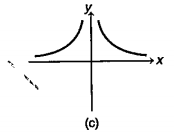 D
D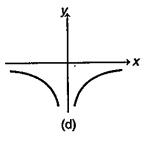
Which of the following graphs best represents the variation of acceleration 'a' with displacement x?
A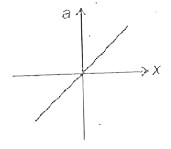 B
B C
C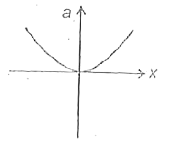 D
D
Which one of the following graphs represents motion?
A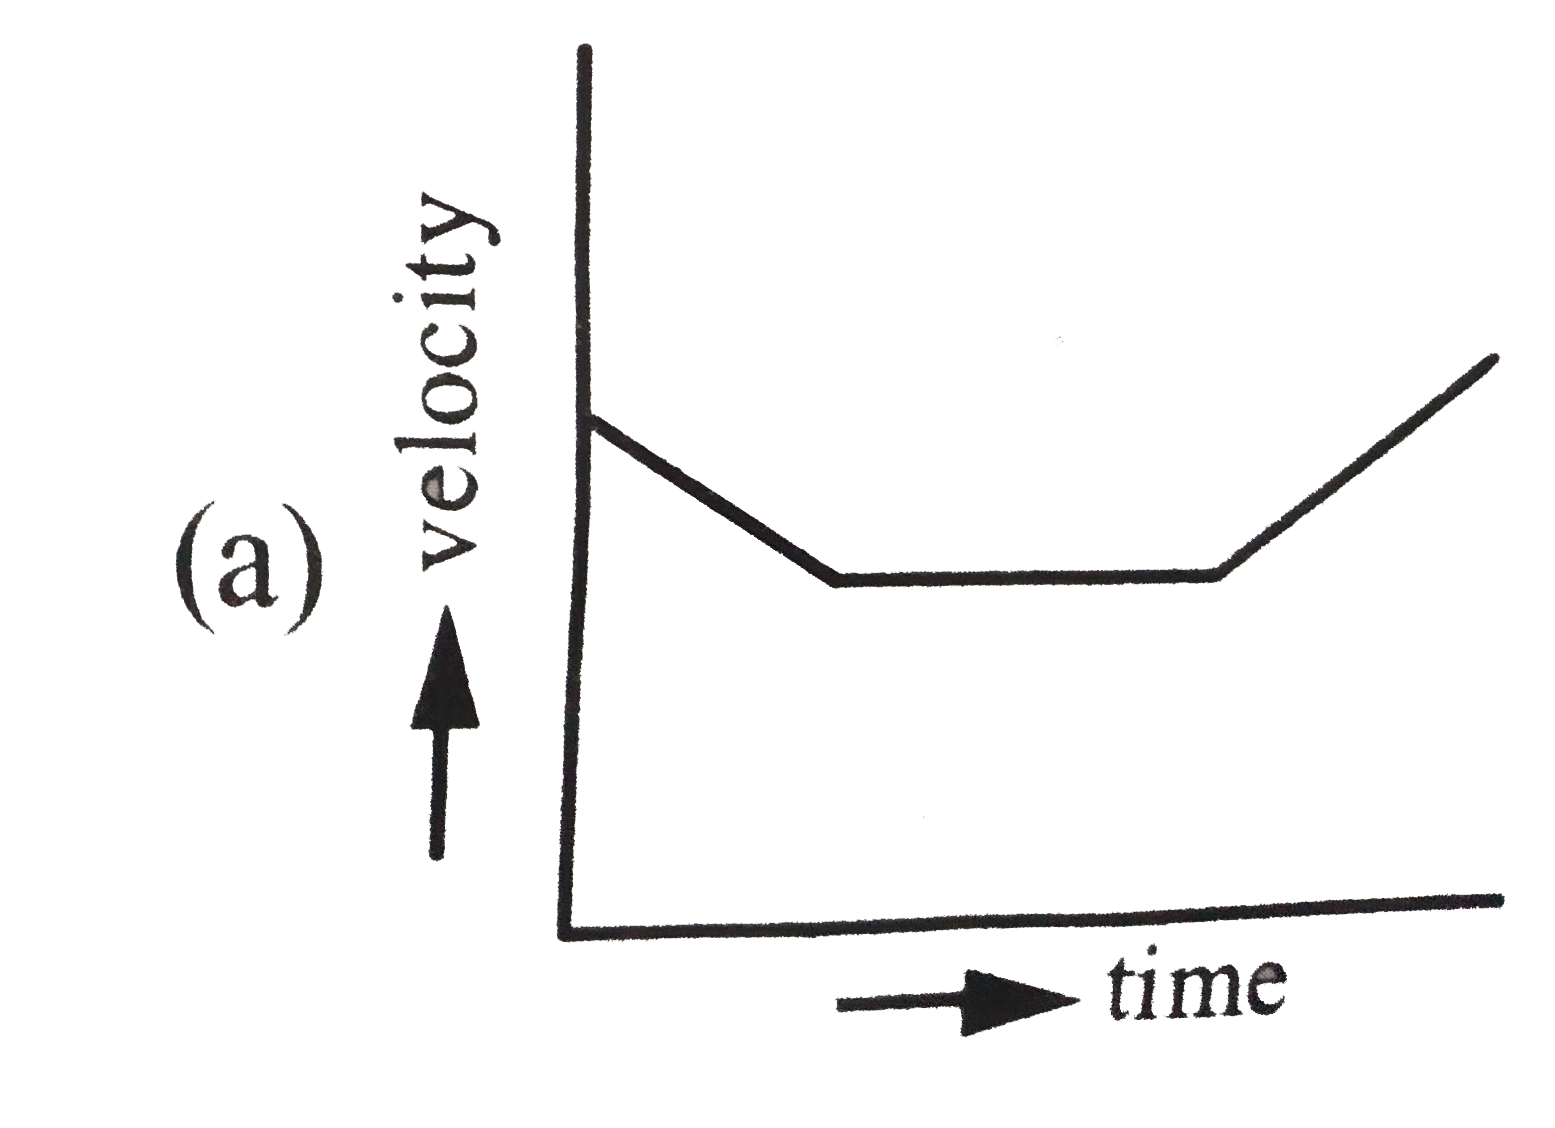 B
B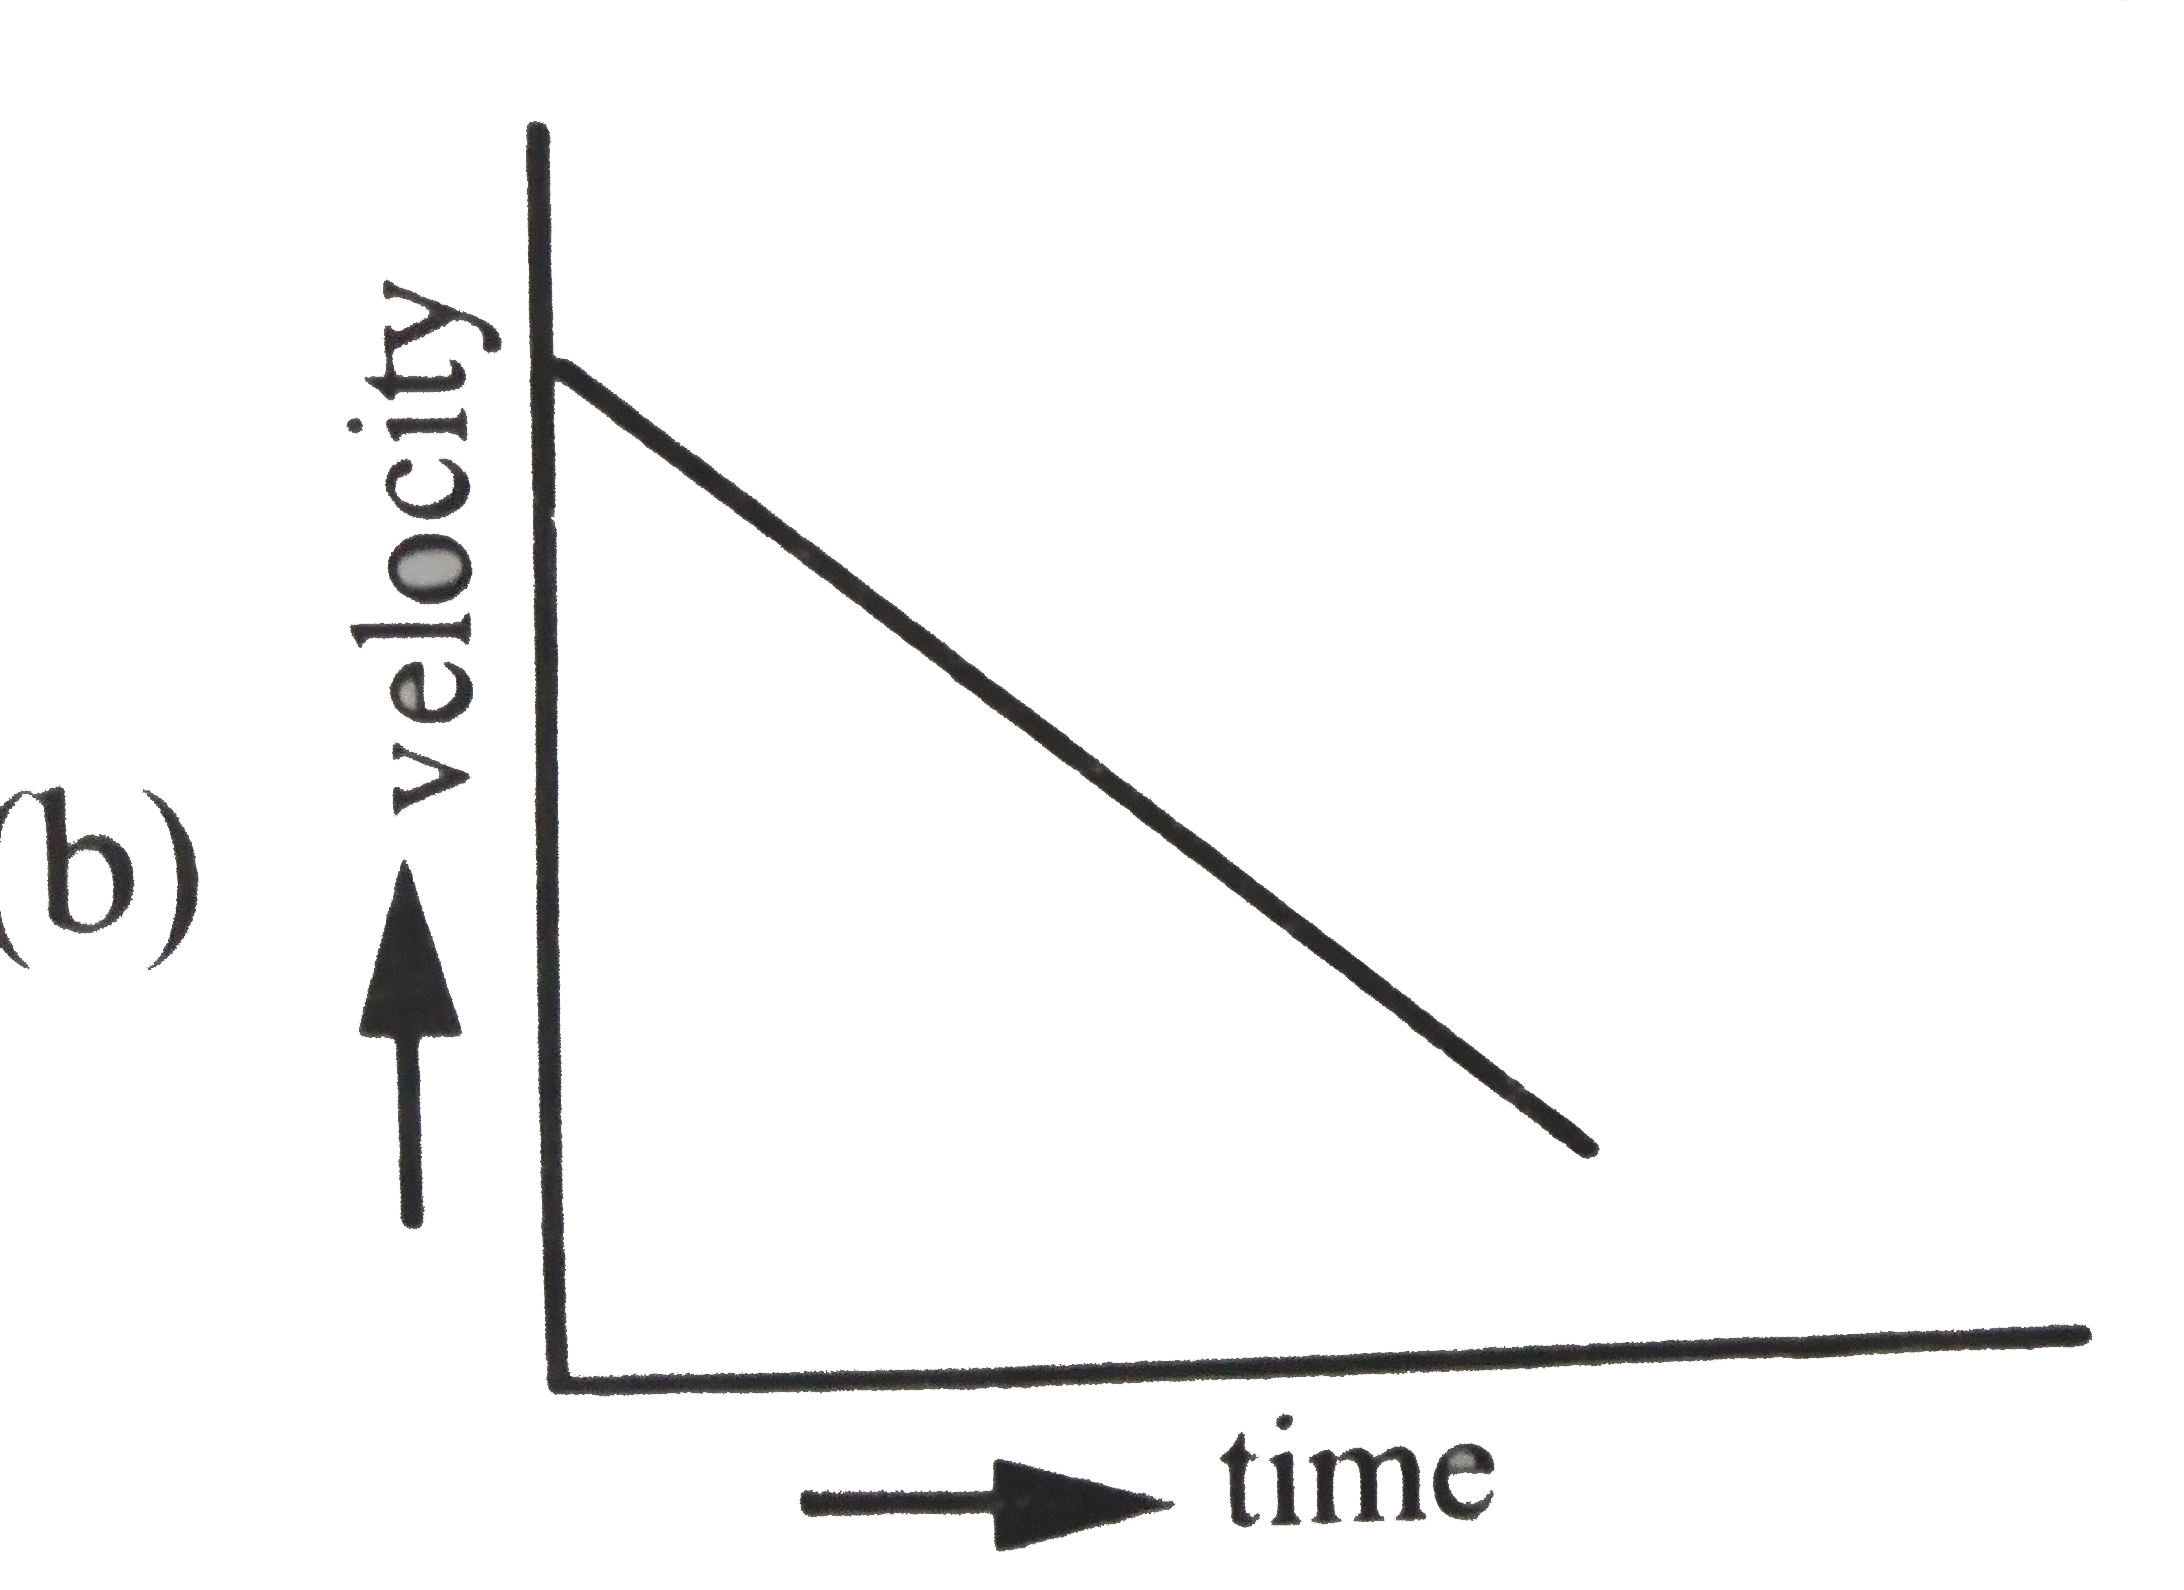 C
C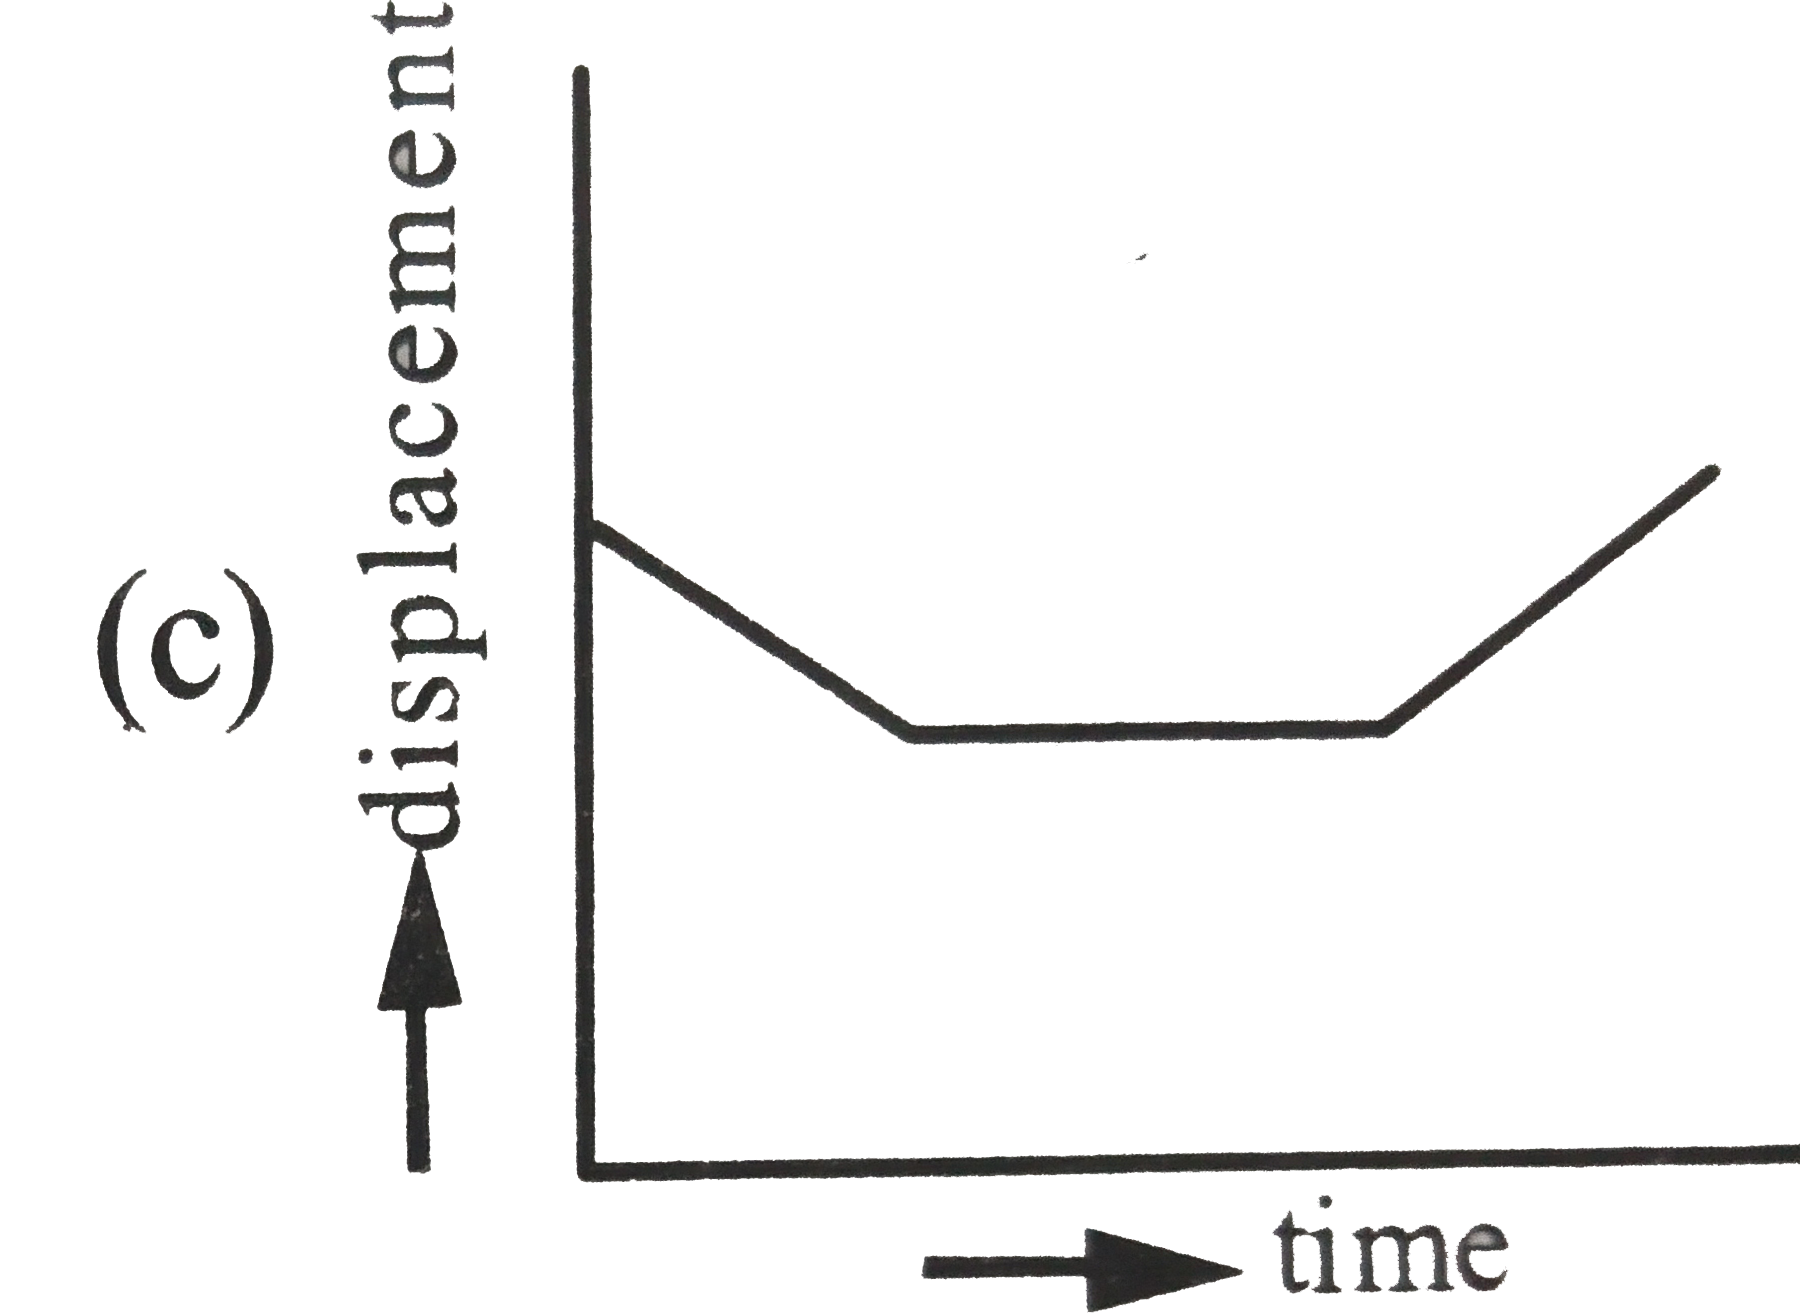 D
D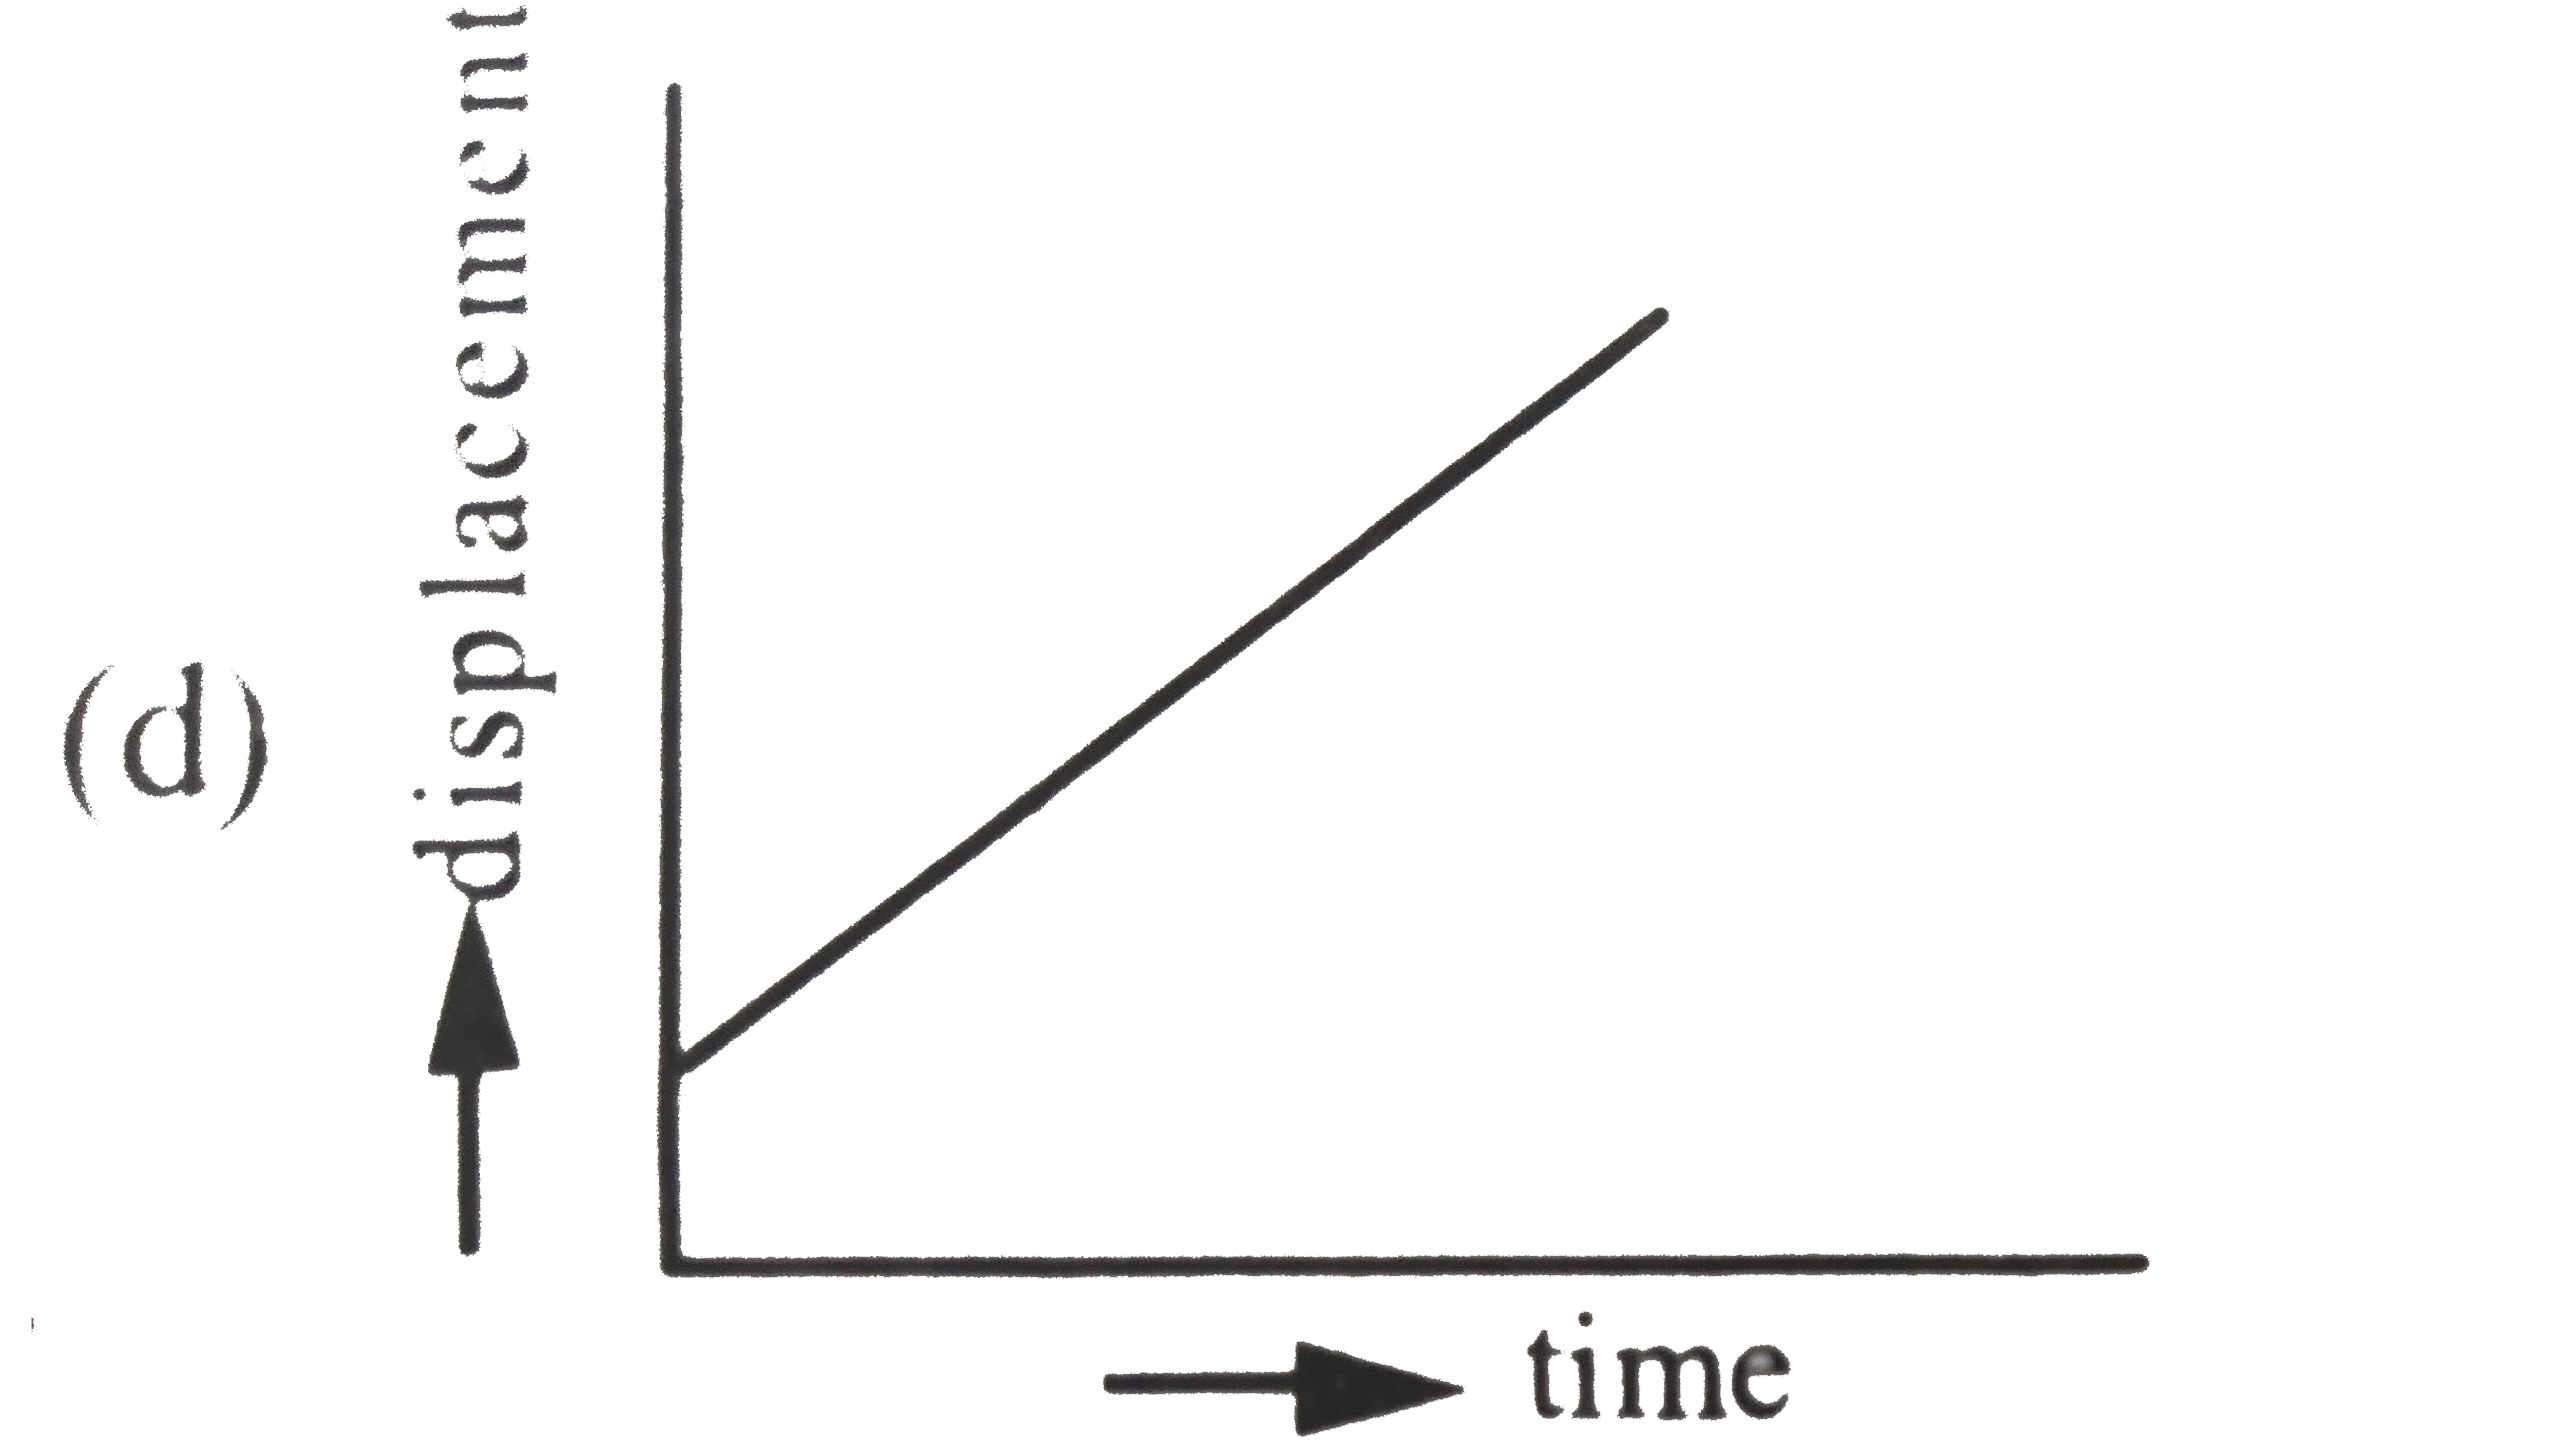
Which of the following graph represents uniform motion
View SolutionThe graph shown the variation with times t of the velocity v of an object . Which one of the following graphs best represents the variation of acceleration a of the object with time t?

View SolutionWhich of the following graph represents e−x?
View SolutionA particle is thrown vertically upwards with a velocity v. It returns to the ground in time T. which of the following graphs correctly represents the motion ?
View SolutionWhich of the following graph represents e−x?
View Solution


