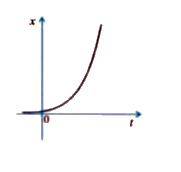
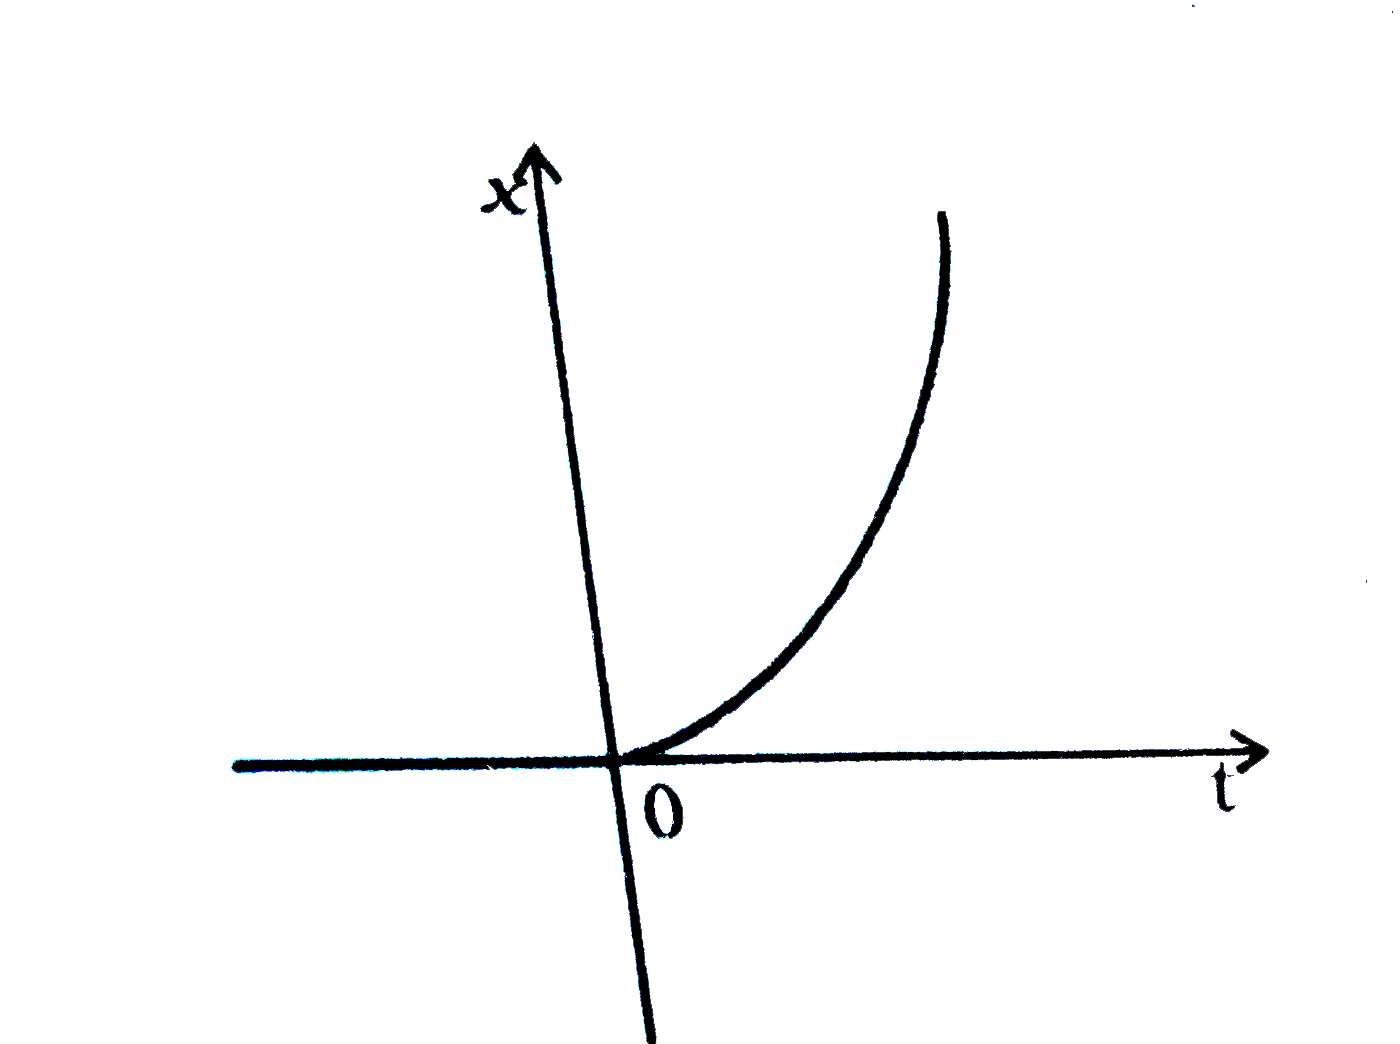
Figure shows the x-t plot of one-dimensional motion of a particle. Is it correct to say from the graph that the particle moves in a straight line for llat0 and on a parabolic path for t>0 ? If not, suggest a suitable physical context for this graph.
 Solution in Gujrati
No, we cannot say that prticle moves on straight line for t<0 and moves on parabolic path for tgy0, because graph of x→t doesn.t show the path of motion. From graph, if t=0, then x =0.
Refrence: For object falling freely from top of tower if x=0, then t=0.
Topper's Solved these Questions
- MOTION IN A STRAIGHT LINE BOOK - KUMAR PRAKASHANCHAPTER - MOTION IN A STRAIGHT LINE EXERCISE - SECTION-C
43 Videos
- MOTION IN A STRAIGHT LINE BOOK - KUMAR PRAKASHANCHAPTER - MOTION IN A STRAIGHT LINE EXERCISE - SECTION-D
26 Videos
- MOTION IN A STRAIGHT LINE BOOK - KUMAR PRAKASHANCHAPTER - MOTION IN A STRAIGHT LINE EXERCISE - SECTION-A TRY YOUR SELF (VSQs)
52 Videos
- MECHANICAL PROPERTIES OF FLUIDS BOOK - KUMAR PRAKASHANCHAPTER - MECHANICAL PROPERTIES OF FLUIDS EXERCISE - QUESTION PAPER (SECTION -C)
3 Videos
- OBJECTIVE QUESTIONS AS PER NEW PAPER STYLE BOOK - KUMAR PRAKASHANCHAPTER - OBJECTIVE QUESTIONS AS PER NEW PAPER STYLE EXERCISE - CHAPTER - 8 (Match Type questions)
5 Videos
Similar Questions
What is acceleration ? What is the direction ? Also gives its unit.
View SolutionAmong the four graph shown in the figure there is only one graph for which average velocity over the time interval (O,T) can vanish for a suitably chosen T. Which one is it ?
View SolutionHow can we determine whether the object is in rest or not?
View SolutionGlycerine flows steadily through a horizontal tube of length 1.5m and radius 1.0 cm . If the amount of glycerine collected per second at one is 4.0×10⁻³kgs−1 , what is the pressure difference between the two ends of the tube ? (Density of glycerine =1.3×10103kgm−3 and viscosity of glycerine =0.83 Pa s). [ you may also like to check if the assumption of laminar flow in the tube is correct]
View SolutionType of satellites are given in Column-I and their uses are given in Column-II. Match them properly :
Column-IColumn-II(1) Polar satellite(a) Tele communication(2) Geo-stationary satellite(b) Investigation(c) For information about atmosphere
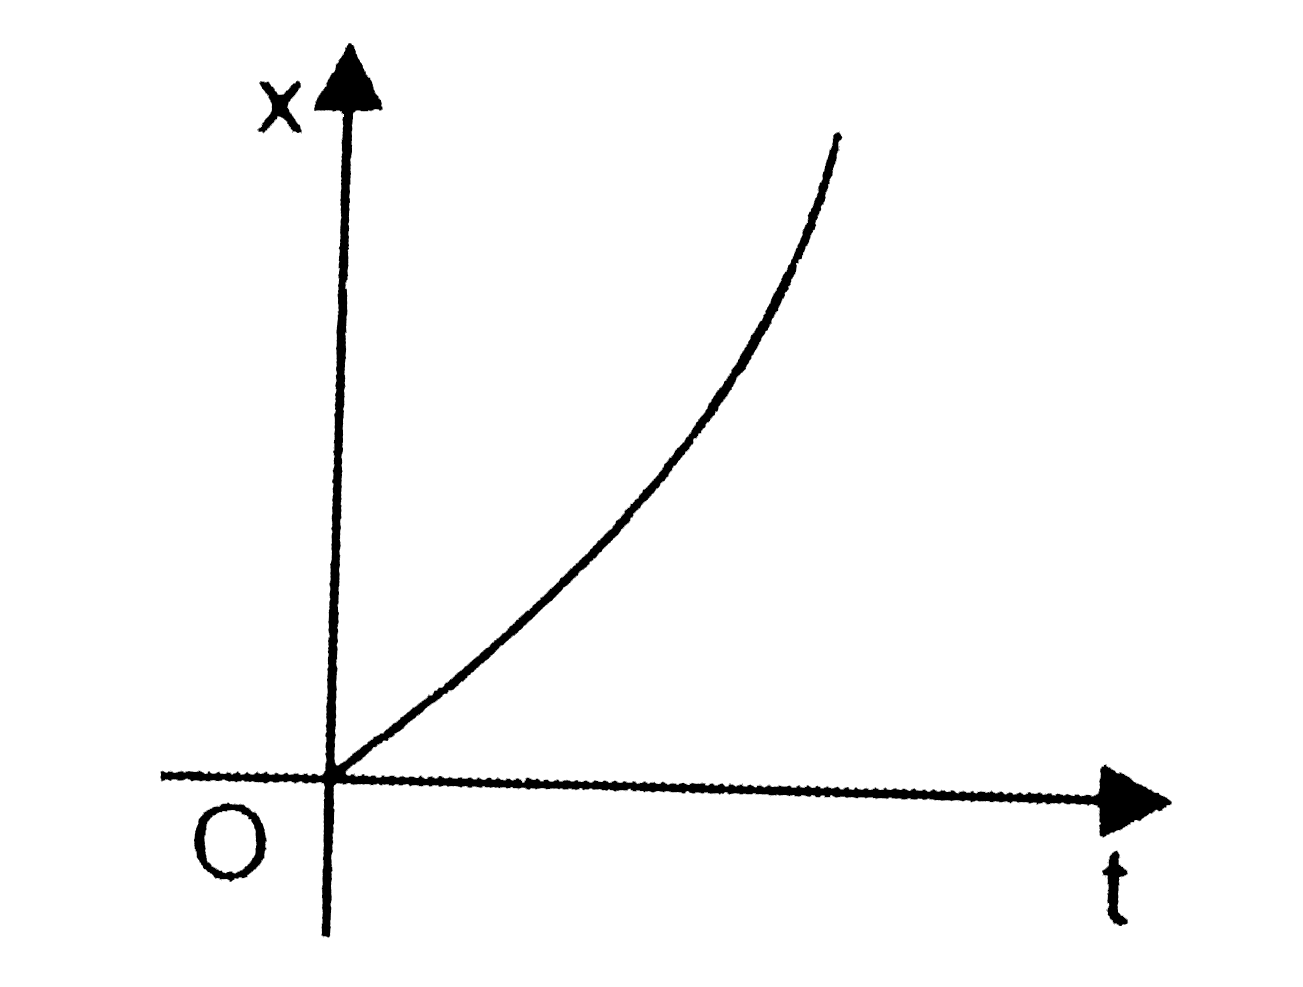
View SolutionThe x-t graph of a particle moving along a straight line is shown in figure

The v-t graph of the particle is correctly shown by
View SolutionThe x-t graph of a particle moving along a straight line is shown in figure The a-t graph of the particle is correctly shown by
View SolutionFig. 2 (NCT). 6 shows x-t plot of one dismensional motion a particle. Is it correct to say from the graph that the particle moves in a straight line for t lt 0 and on a parabolic path form t gt 0 ? If not, suggest a suitable physical contxt for this graph.
View SolutionThe x-t graph of particle moving along a straight line is shown in figure The v-t graph of the particles is correctly shown by
View SolutionThe x-t graph of particle moving along a straight line is shown in figure The a-t graph of the particle is correctly shown by
View Solutionचित्र 3.21 में किसी कण की एकविमीय गति का x-t ग्राफ दिखाया गया है | ग्राफ से क्या यह कहना ठीक होगा कि यह कण t<0 के लिए किसी सरल रेखा में और t>0 के लिए किसी परवलीय पथ में गति करता है | यदि नहीं, तो ग्राफ के संगत किसी उचित भौतिक संदर्भ का सुझाव दीजिए |

View Solutionचित्र में किसी कण की एकविमीय गति का x−t ग्राफ दिखाया गया है। ग्राफ से क्या यह कहना ठीक होगा कि यह कण t>0 के लिए किसी सरल रेखा में और t>0 के लिए किसी परवलीय पथ में गति करता है। यदि नहीं, तो ग्राफ के संगत किसी उचित भौतिक संदर्भ का सुझाव दीजिए।

View SolutionFigure. shows the x-t plot of one-dimensional motion of a particle. Is it correct to say from the graph that the particle moves in a straight line for t lt 0 and on a parabolic path for t gt 0 ? If not, suggest a suitable physical context for this graph.
View SolutionFigure. shows the x-t plot of one-dimensional motion of a particle. Is it correct to say from the graph that the particle moves in a straight line for t lt 0 and on a parabolic path for t gt 0 ? If not, suggest a suitable physical context for this graph.
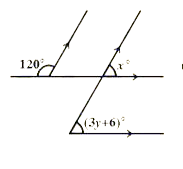
View SolutionFind the value of x and y from the figure.

View Solution
