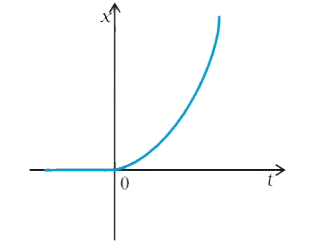
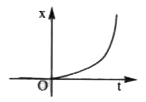
Figure. shows the x-t plot of one-dimensional motion of a particle. Is it correct to say from the graph that the particle moves in a straight line for t<0 and on a parabolic path for t>0 ? If not, suggest a suitable physical context for this graph.
 Solution in Telugu
No, wrong. x-t plot does not show the trajectory of a particle. Context: A body is dropped from a tower (x = 0) at t = 0.
Topper's Solved these Questions
- MOTION IN A STRAIGHT LINEBOOK - NCERT TELUGUCHAPTER - MOTION IN A STRAIGHT LINEEXERCISE - ADDITIONAL EXERCISES
5 Videos
- MOTION IN A STRAIGHT LINEBOOK - NCERT TELUGUCHAPTER - MOTION IN A STRAIGHT LINEEXERCISE - ADDITIONAL EXERCISES
5 Videos
- MOTION IN A PLANEBOOK - NCERT TELUGUCHAPTER - MOTION IN A PLANEEXERCISE - EXCERCISES
30 Videos
- OSCILLATIONSBOOK - NCERT TELUGUCHAPTER - OSCILLATIONSEXERCISE - Additional Exercises
6 Videos
Similar Questions
A boy standing on a stationary lift (open from above) throws a ball upwards with the maximum initial speed he can, equal to 49ms−1. How much time does the ball take to return to his hands ? If the lift starts moving up with a uniform speed of 5ms−1 and the boy again throws the ball up with the maximum speed he can, how long does the ball take to return to his hands ?
View SolutionA boy standing on a stationary lift (open from above) throws a ball upwards with the maximum initial speed he can, equal to 49ms−1. How much time does the ball take to return to his hands ? If the lift starts moving up with a uniform speed of 5ms−1 and the boy again throws the ball up with the maximum speed he can, how long does the ball take to return to his hands ?
View SolutionState , for each of the following physical quantities , if it is a scalar or a vector : volume , mass , speed , acceleration , density , number of moles , velocity , angular frequency , displacement , angular velocity .
View SolutionAn air chamber of volume V has a neck area of cross section a into which a ball of mass m just fits and can move up and down without any friction (Fig.14.27). Show that when the ball is pressed down a little and released , it executes SHM. Obtain an expression for the time period of oscillations assuming pressure-volume variations of air to be isothermal [see Fig. 14.27].

View SolutionThe x-t graph of a particle moving along a straight line is shown in figure

The v-t graph of the particle is correctly shown by
View SolutionThe x-t graph of a particle moving along a straight line is shown in figure The a-t graph of the particle is correctly shown by
View SolutionFig. 2 (NCT). 6 shows x-t plot of one dismensional motion a particle. Is it correct to say from the graph that the particle moves in a straight line for t lt 0 and on a parabolic path form t gt 0 ? If not, suggest a suitable physical contxt for this graph.
View SolutionThe x-t graph of particle moving along a straight line is shown in figure The v-t graph of the particles is correctly shown by
View SolutionThe x-t graph of particle moving along a straight line is shown in figure The a-t graph of the particle is correctly shown by
View Solutionचित्र 3.21 में किसी कण की एकविमीय गति का x-t ग्राफ दिखाया गया है | ग्राफ से क्या यह कहना ठीक होगा कि यह कण t<0 के लिए किसी सरल रेखा में और t>0 के लिए किसी परवलीय पथ में गति करता है | यदि नहीं, तो ग्राफ के संगत किसी उचित भौतिक संदर्भ का सुझाव दीजिए |
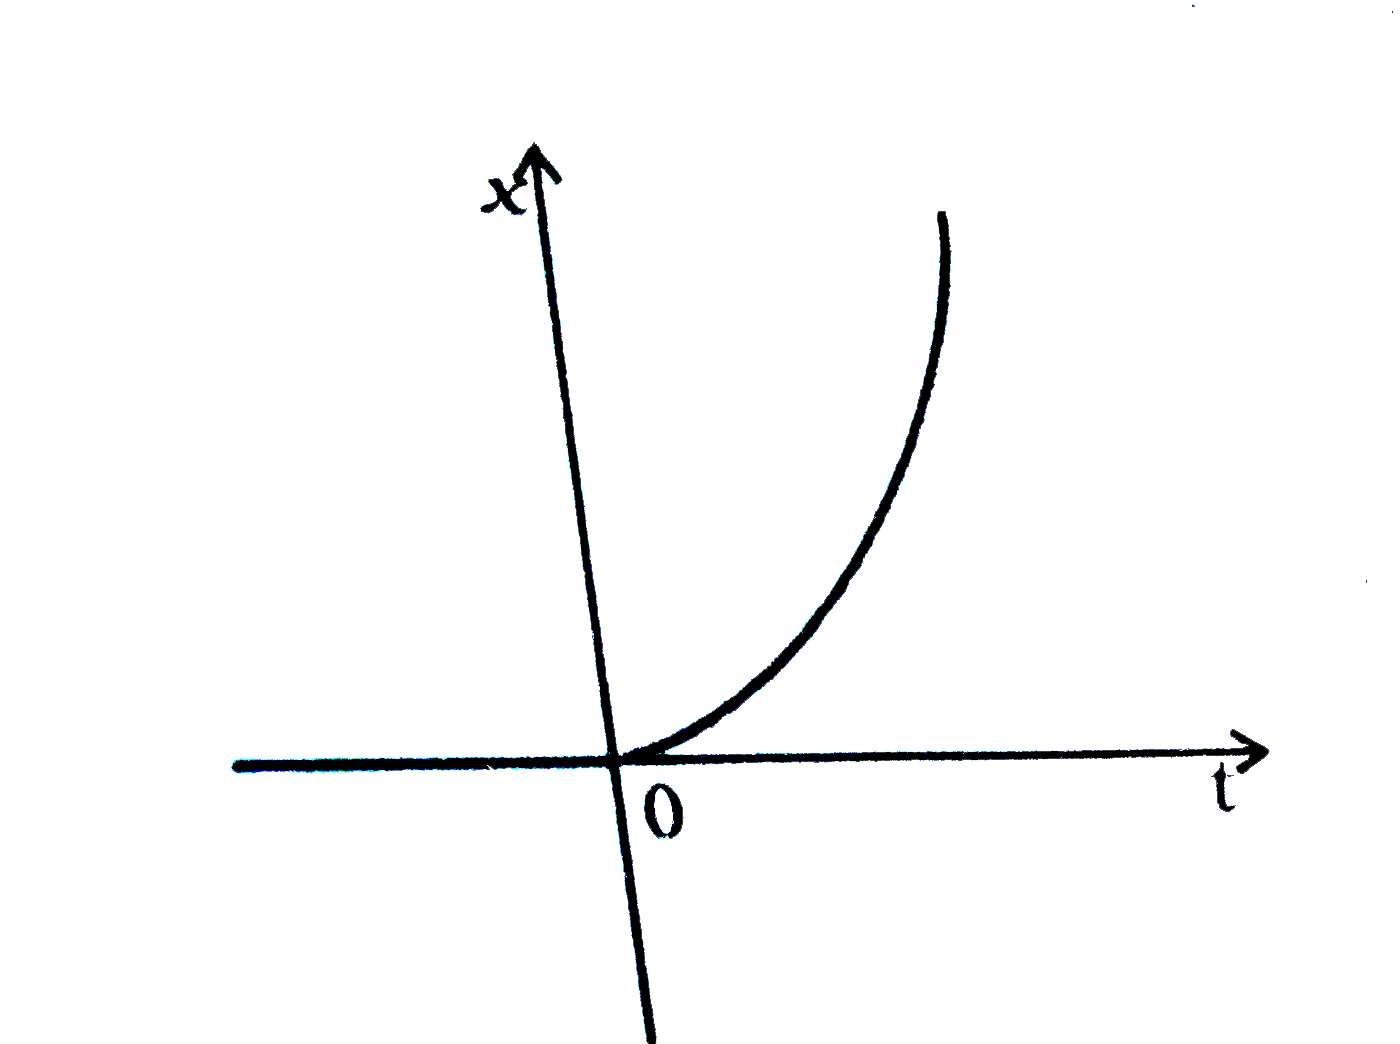
View Solutionचित्र में किसी कण की एकविमीय गति का x−t ग्राफ दिखाया गया है। ग्राफ से क्या यह कहना ठीक होगा कि यह कण t>0 के लिए किसी सरल रेखा में और t>0 के लिए किसी परवलीय पथ में गति करता है। यदि नहीं, तो ग्राफ के संगत किसी उचित भौतिक संदर्भ का सुझाव दीजिए।
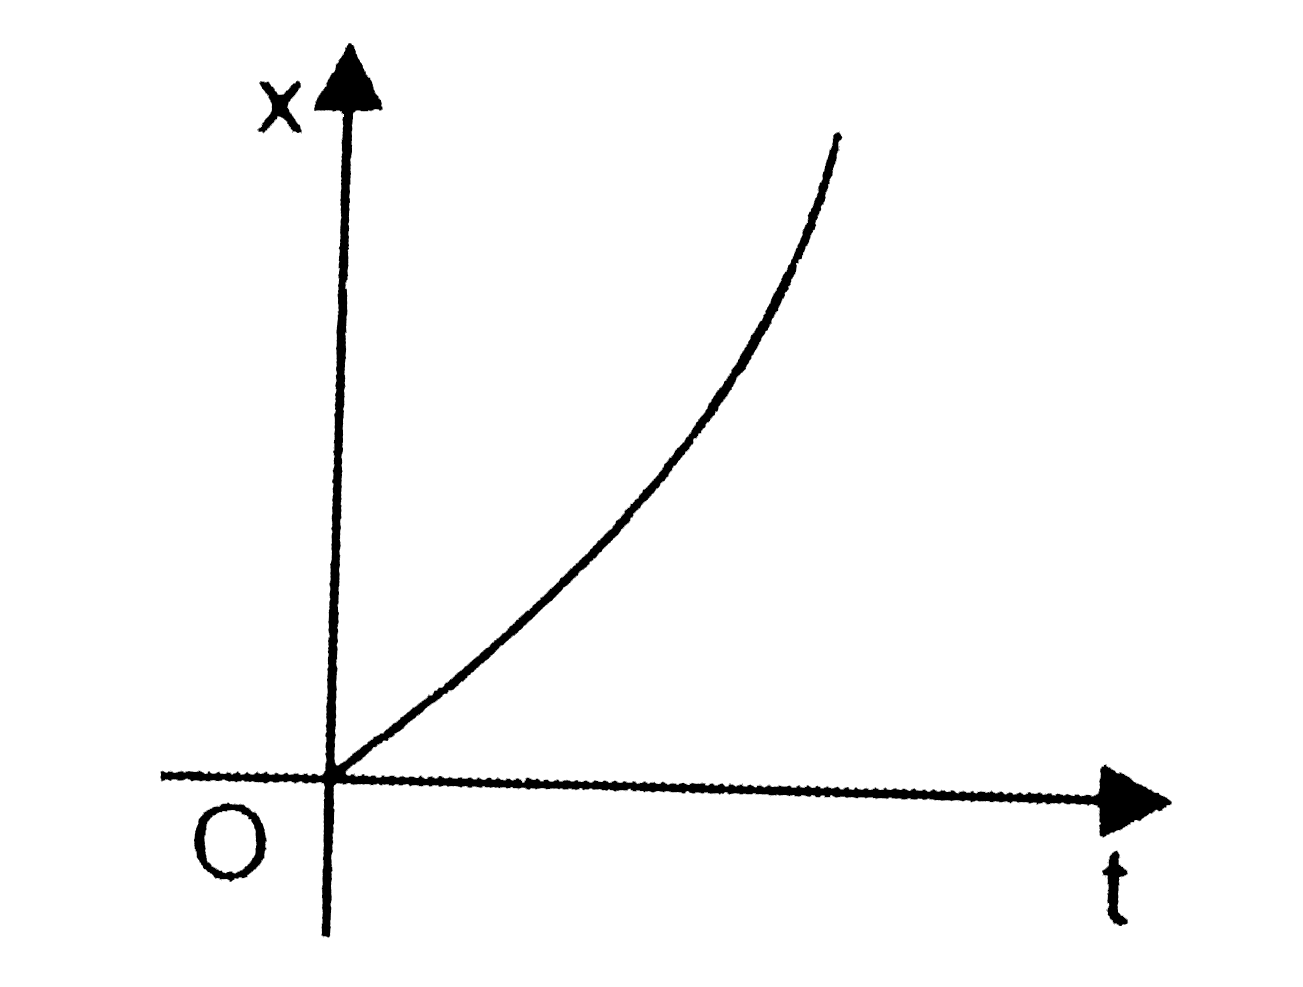
View SolutionFigure. shows the x-t plot of one-dimensional motion of a particle. Is it correct to say from the graph that the particle moves in a straight line for t lt 0 and on a parabolic path for t gt 0 ? If not, suggest a suitable physical context for this graph.
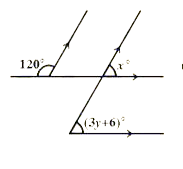
View SolutionFind the value of x and y from the figure.
View SolutionFigure shows the x-t plot of one dimensional motion of a particle. Is it correct to say from the graph that the particle moves in a straight line for t < 0 and on a parabolic path for t > 0 ? If not, suggest a suitable physical context for this graph.
View SolutionFig. shows x-t plot of one dimensional motion a particle. Is it correct to say from the graph that the particle moves in a straight line for t lt 0 and on a parabolic path form t gt 0 ? If not, suggest a suitable physical context for this graph.
View Solution
