The distribution of sale of shirts sold in a month in a departmental store is as under

Calculate the modal size of shirts sold
Clearly , the modal class is 95-100 as it has the maximum frequency
x=95,h=5,fk=155,fk−1=85,fk+1=110
Mode Mo=xk+{h×(fk−fk−1)2fk−fk−1−fk+1
95+{5×(155−85)(2×155−85−110)}
=95+{5×70(310−195)}=95+{5×70115}
=95+7023=95+3.04=98.04
∴ modal size =98.04
Topper's Solved these Questions
- MEAN,MEDAN,MODE OF GROUPED,DATA CUMULATIVE FREQUENCY GRAPH AND OGIVE Book:RS AGGARWALChapter:MEAN,MEDAN,MODE OF GROUPED,DATA CUMULATIVE FREQUENCY GRAPH AND OGIVE Exercise:MISCELLANEOUS QUESTIONS ON MEAN,MODE AND MEDIAN
Explore 1 Video
- MEAN,MEDAN,MODE OF GROUPED,DATA CUMULATIVE FREQUENCY GRAPH AND OGIVE Book:RS AGGARWALChapter:MEAN,MEDAN,MODE OF GROUPED,DATA CUMULATIVE FREQUENCY GRAPH AND OGIVE Exercise:Exercise 18A
Explore 2 Videos
- MEAN,MEDAN,MODE OF GROUPED,DATA CUMULATIVE FREQUENCY GRAPH AND OGIVE Book:RS AGGARWALChapter:MEAN,MEDAN,MODE OF GROUPED,DATA CUMULATIVE FREQUENCY GRAPH AND OGIVE Exercise:Test Yourself
Explore 18 Videos
- LINEAR EQUATIONS IN TWO VARIABLES Book:RS AGGARWALChapter:LINEAR EQUATIONS IN TWO VARIABLES Exercise:QUESTION
Explore 2 Videos
- PERIMETER AND AREA OF PLANE FIGURES Book:RS AGGARWALChapter:PERIMETER AND AREA OF PLANE FIGURES Exercise:TEST YOURSELF (SHORT -ANSWER QUESTIONS)
Explore 1 Video
Similar Questions
Directions: Study the Pie chart and answer the following question. The pie chart is showing the percentage of different types of shirts sold by five different stores namely A, B, C, D and E.
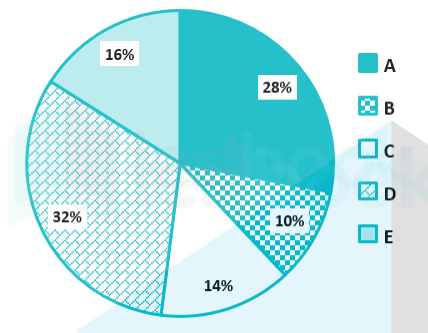
Find the average of shirt sold by all stores. If the shirt sold by store B is 1750.
View SolutionDirections: Study the Pie chart and answer the following question. The pie chart is showing the percentage of different types of shirts sold by five different stores namely A, B, C, D and E.

Find the average of shirt sold by store D and E, if the shirt sold by E is 256
View Solution
Knowledge Check
The line chart given blow represents the sales (in 00) of trousers ans shirts for five months.
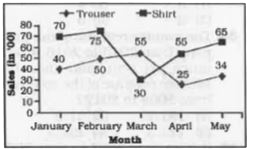
Total sale of shirts for five months is how much per cent more than the total sale of trousers for five months?A30.84B38.46C44.61D49.94The line chart given blow represents the sales (in 00) of trousers ans shirts for five months.
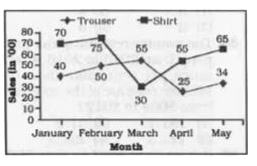
In March sale of trousers is what per cent of sale of shirts?A83.33B54.54C125D183.33
The given bar graph shows the sale of different brands of shirts in a shop in one month.
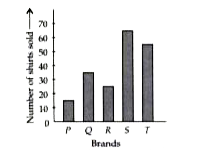
Find the ratio of number of shirts sold of brand S to the number of shirts sold or brand P and R together.
{ ((a),8:9),((b)13:8),((c )11:7),((d)13:6): }
View SolutionDirections: Study the Pie chart and answer the following question. The pie chart is showing the percentage of different types of shirts sold by five different stores namely A, B, C, D and E.

If the difference in shirt sold by store C and store D is 1800. Find the number of shirts sold by store D.
View SolutionDirections: Study the Pie chart and answer the following question. The pie chart is showing the percentage of different types of shirts sold by five different stores namely A, B, C, D and E.

If the difference in shirt sold by store A and store D is 64, then find the total shirt sold by store A, B and E.
View Solution
If the no. of shirts of type U sold by the shopkeeper in given four days is 25% more than the no. of shirts sold of type S in all the given days then find the no. of shirts sold of type U in all the given days.
View Solution
What is the ratio of no. of shirts of type Q sold by the shopkeepr on Saturday and Monday together to the no of shirt of type T sold by himon the same days ?
View SolutionThe line chart given below represents the sales (in 00) of trousers and shirts for five months.
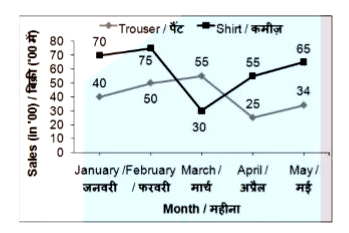
In January sale of is what trousers percent of sale of Shirts ?
View Solution
