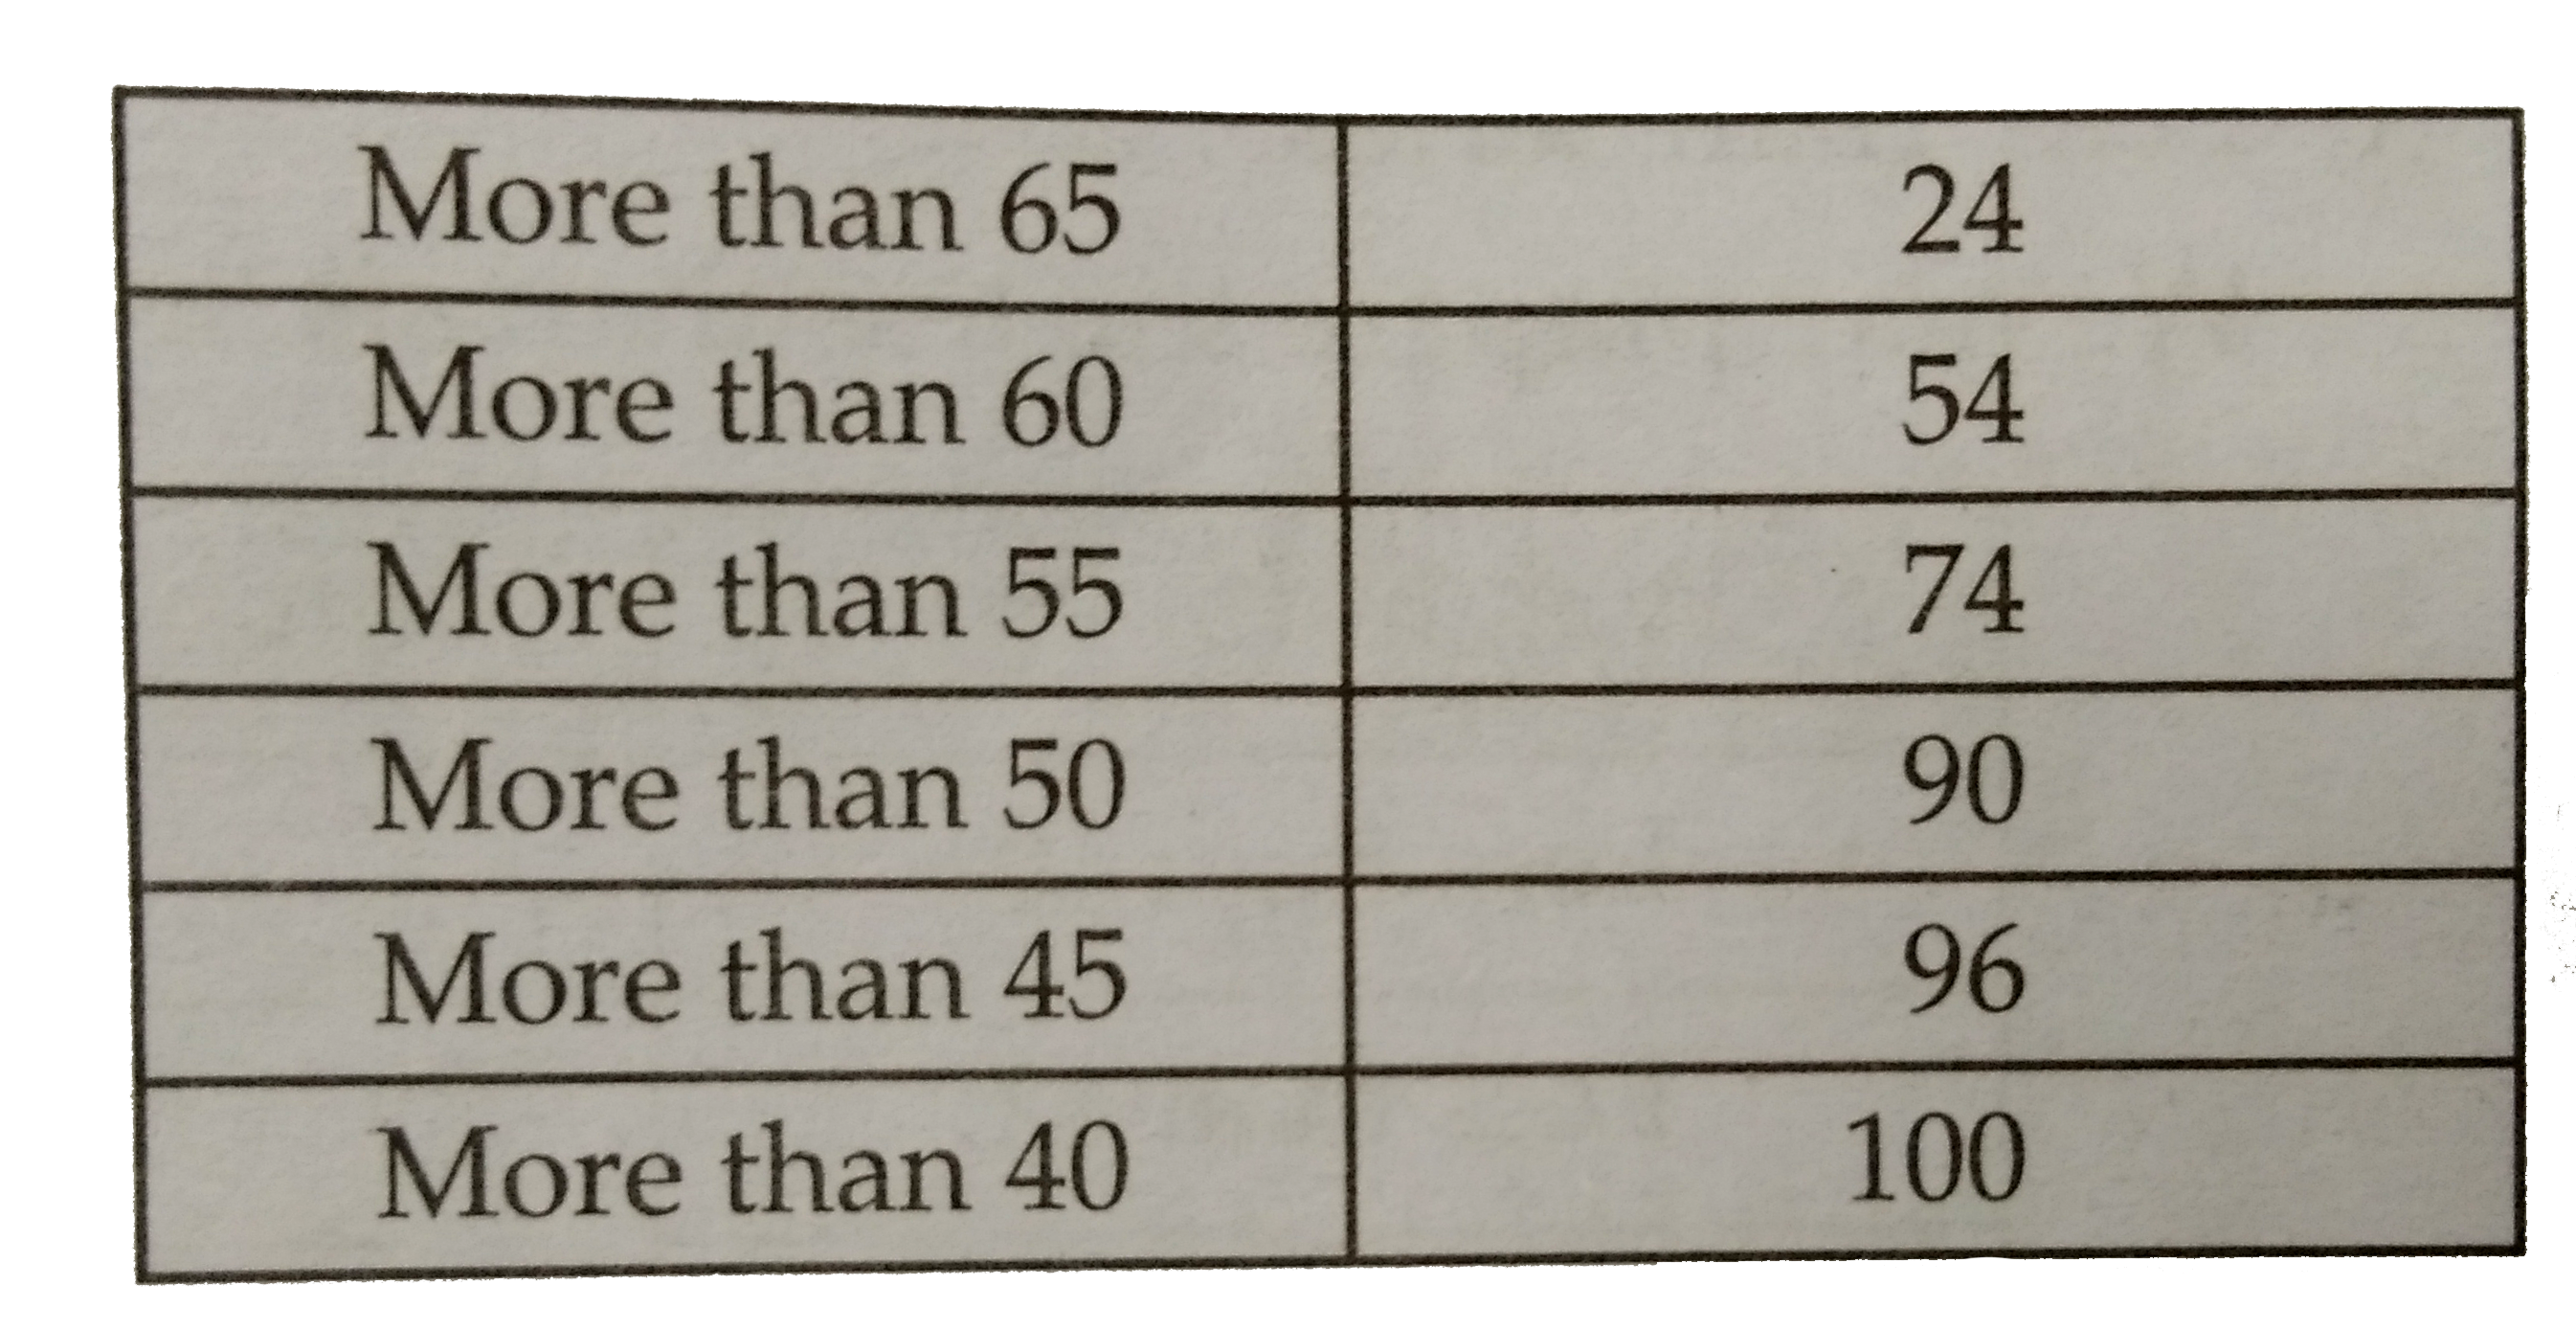
The following table gives production yield per hectare of wheat of 100 farms of a village

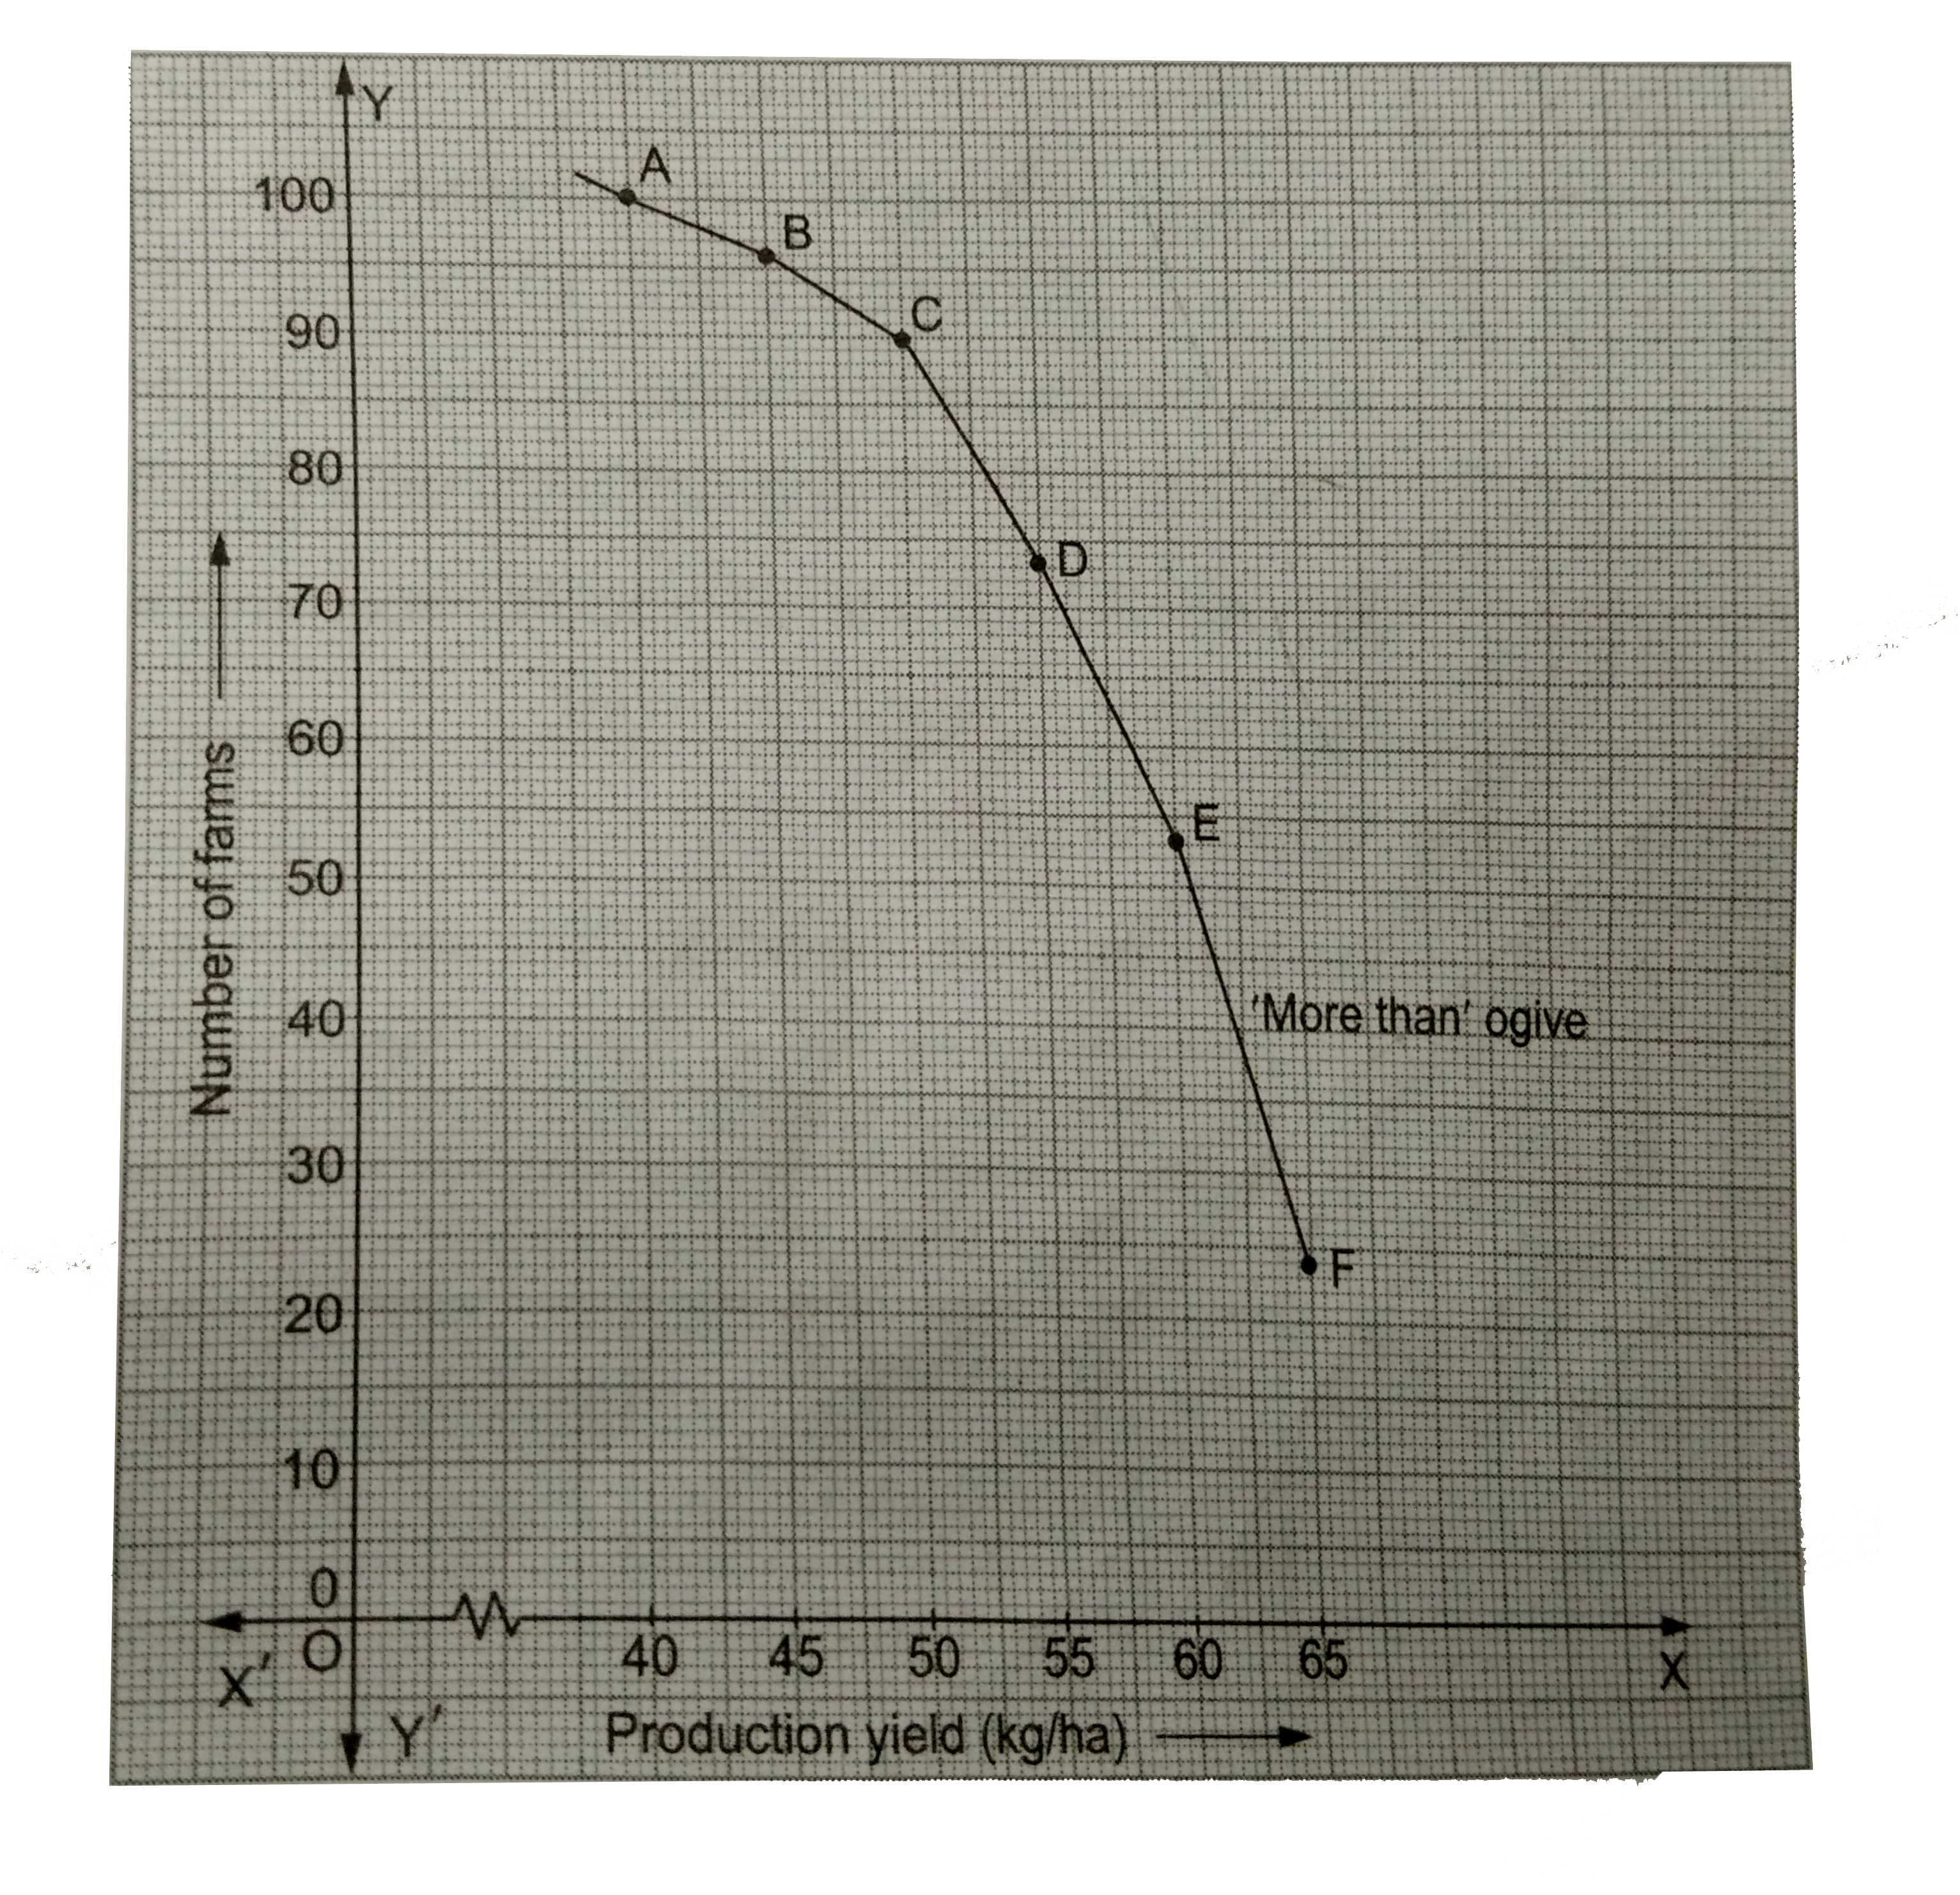
Change the distribution to a 'more than' type distribution and draw its ogive
We may prepare the 'more than' series as shown below
Scale:

{Along the x-axis, 1 small div,=1Along the y-axis , 1 small div,=1
On a graph paper, we plot the points A(40, 100), B(45, 96), C(S0, 90), D(SS, 74), E(60, 54) and F(65, 24).
Join AB, BC, CD, DE and EF freehand to get a 'More Than Ogive'

Topper's Solved these Questions
- MEAN,MEDAN,MODE OF GROUPED,DATA CUMULATIVE FREQUENCY GRAPH AND OGIVE BOOK - RS AGGARWALCHAPTER - MEAN,MEDAN,MODE OF GROUPED,DATA CUMULATIVE FREQUENCY GRAPH AND OGIVE EXERCISE - MISCELLANEOUS QUESTIONS ON MEAN,MODE AND MEDIAN
1 Videos
- MEAN,MEDAN,MODE OF GROUPED,DATA CUMULATIVE FREQUENCY GRAPH AND OGIVE BOOK - RS AGGARWALCHAPTER - MEAN,MEDAN,MODE OF GROUPED,DATA CUMULATIVE FREQUENCY GRAPH AND OGIVE EXERCISE - Exercise 18A
2 Videos
- MEAN,MEDAN,MODE OF GROUPED,DATA CUMULATIVE FREQUENCY GRAPH AND OGIVE BOOK - RS AGGARWALCHAPTER - MEAN,MEDAN,MODE OF GROUPED,DATA CUMULATIVE FREQUENCY GRAPH AND OGIVE EXERCISE - Test Yourself
18 Videos
- LINEAR EQUATIONS IN TWO VARIABLES BOOK - RS AGGARWALCHAPTER - LINEAR EQUATIONS IN TWO VARIABLES EXERCISE - QUESTION
2 Videos
- PERIMETER AND AREA OF PLANE FIGURES BOOK - RS AGGARWALCHAPTER - PERIMETER AND AREA OF PLANE FIGURES EXERCISE - TEST YOURSELF (SHORT -ANSWER QUESTIONS)
1 Videos
Similar Questions
The following table gives production yield per hectare of wheat of 100 farms of a village.

Find the mean production.
View SolutionThe following table production yield in kg per hectare of wheat of 150 farms in a village . Culculate the mean , median and mode of the production yeild.
Production Yield (kg per hectare)50−5353−5656−5959−6262−6565−6868−7171−7474−77Number of Farms 3 8 14 30 36 28 16 10 5
View Solution
Knowledge Check
The following table gives the frequency distribution of number of peas per pea pod of 198 pods :

What is the median of this distribution ?A3B4C5D6
The following table gives the height of 42 trees in meters:

Change the above distribution to less than type distribution and draw its ogive. Hence obtain the median value.
View SolutionThe following table gives production yield per hectare of wheat of 100 farms of a village: Production yield 50-55 55-60 60-65 65-70 70-75 75-80 in kg per hectare: No. of farms: 2 8 12 24 38 16 Draw ‘less than’ ogive and ‘more than’ ogive.
View SolutionThe following distribution gives the daily income of 50 workers of a factory: Convert the distribution above to a less than type cumulative frequency distribution and draw its ogive
View SolutionThe following distribution gives the daily income of 50 workers of a factory.

Convert the distribution above to a less than type cumulative frequency distribution, and draw its ogive.
View SolutionThe following distribution gives the daily income of 60 workers of a factory. Convert the distribution above to a less than type cumulative frequency distribution, and draw its ogive.
View SolutionChange the following distribution to a 'more than type' distribution. Hence, draw the 'more than type' ogive for this distribution.

View SolutionThe following is the distribution of weights (in kg) of 40 persons.

Construct a cumulative frequency distribution (of the less than type) table for the data above.
View Solution
