Directions: Study the Pie chart and answer the following question.
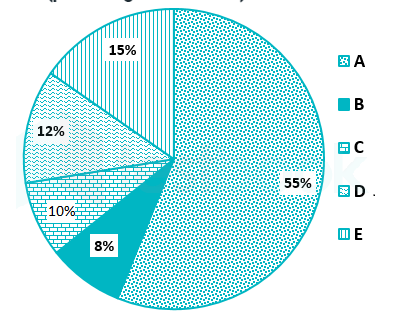
The pie chart is showing the percentage of different types of shirts sold by five different stores namely A, B, C,
D and E.
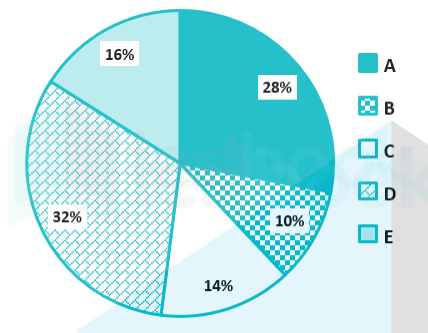
Find the average of shirt sold by store D and E, if the shirt sold by E is 256
330
384
350
360
Step by step video & image solution for Directions: Study the Pie chart and answer the following question. The pie chart is showing the percentage of different types of shirts sold by five different stores namely A, B, C, D and E. Find the average of shirt sold by store D and E, if the shirt sold by E is 256 by Maths experts to help you in doubts & scoring excellent marks in Class 14 exams.
Similar Questions
Directions: Study the Pie chart and answer the following question. The pie chart is showing the percentage of different types of shirts sold by five different stores namely A, B, C, D and E.

Find the average of shirt sold by all stores. If the shirt sold by store B is 1750.View SolutionDirections: Study the Pie chart and answer the following question. The pie chart is showing the percentage of different types of shirts sold by five different stores namely A, B, C, D and E.

If the difference in shirt sold by store A and store D is 64, then find the total shirt sold by store A, B and E.View SolutionDirections: Study the Pie chart and answer the following question. The pie chart is showing the percentage of different types of shirts sold by five different stores namely A, B, C, D and E.

If the difference in shirt sold by store C and store D is 1800. Find the number of shirts sold by store D.View SolutionDirection: Study the chart and answer the following questions

What is the average expenditure spent on different five sector over the year?View SolutionDirections: Read the following Pie chart carefully and answer the following questions:- The pie chart shows the percentage of candidates in 6 different shifts of an examination. Total number of candidates = 5500
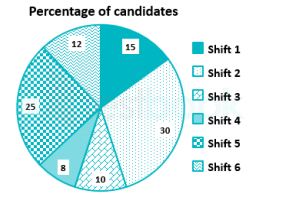
Find the average number of candidates in shift 2, shift 3 and shift 4 together in the examination.View SolutionDirections: Read the following Pie chart carefully and answer the following questions:- The pie chart shows the percentage of candidates in 6 different shifts of an examination. Total number of candidates = 5500
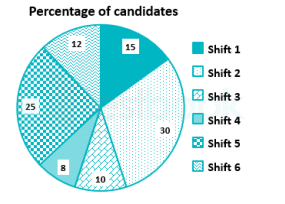
If 40% candidates in shift 6 were failed, then find the number of candidates passed the examination in the same shift.View SolutionDirection: Study the data carefully and answer the following questions.
Following is the data given of selling of 5 shops A, B, C, D and E of two different types of books.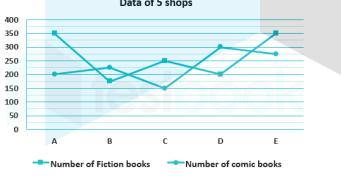
Find the average of total number of fictions books sold from all the 5 shops.View SolutionStudy the pie chart and answer the question
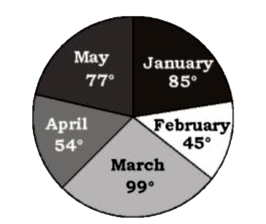
The total number of computers sold in February and April is what percentage more than the number of computers sold in MayView SolutionStudy the following pie-chart and answer the given question.
The pie-chart shows the Budget Expenditure of a company in the year 2018 (percentage distribution) on different heads AB.C,D & E.
The central angle of the sector representing expenditure on head E is:
View SolutionDirection: Study the data carefully and answer the following questions.
Following is the data given of selling of 5 shops A, B, C, D and E of two different types of books.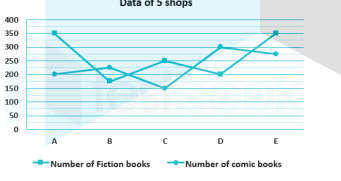
Find the difference between number of fiction books sold from shop B to number of comic books sold from shop D.View Solution
