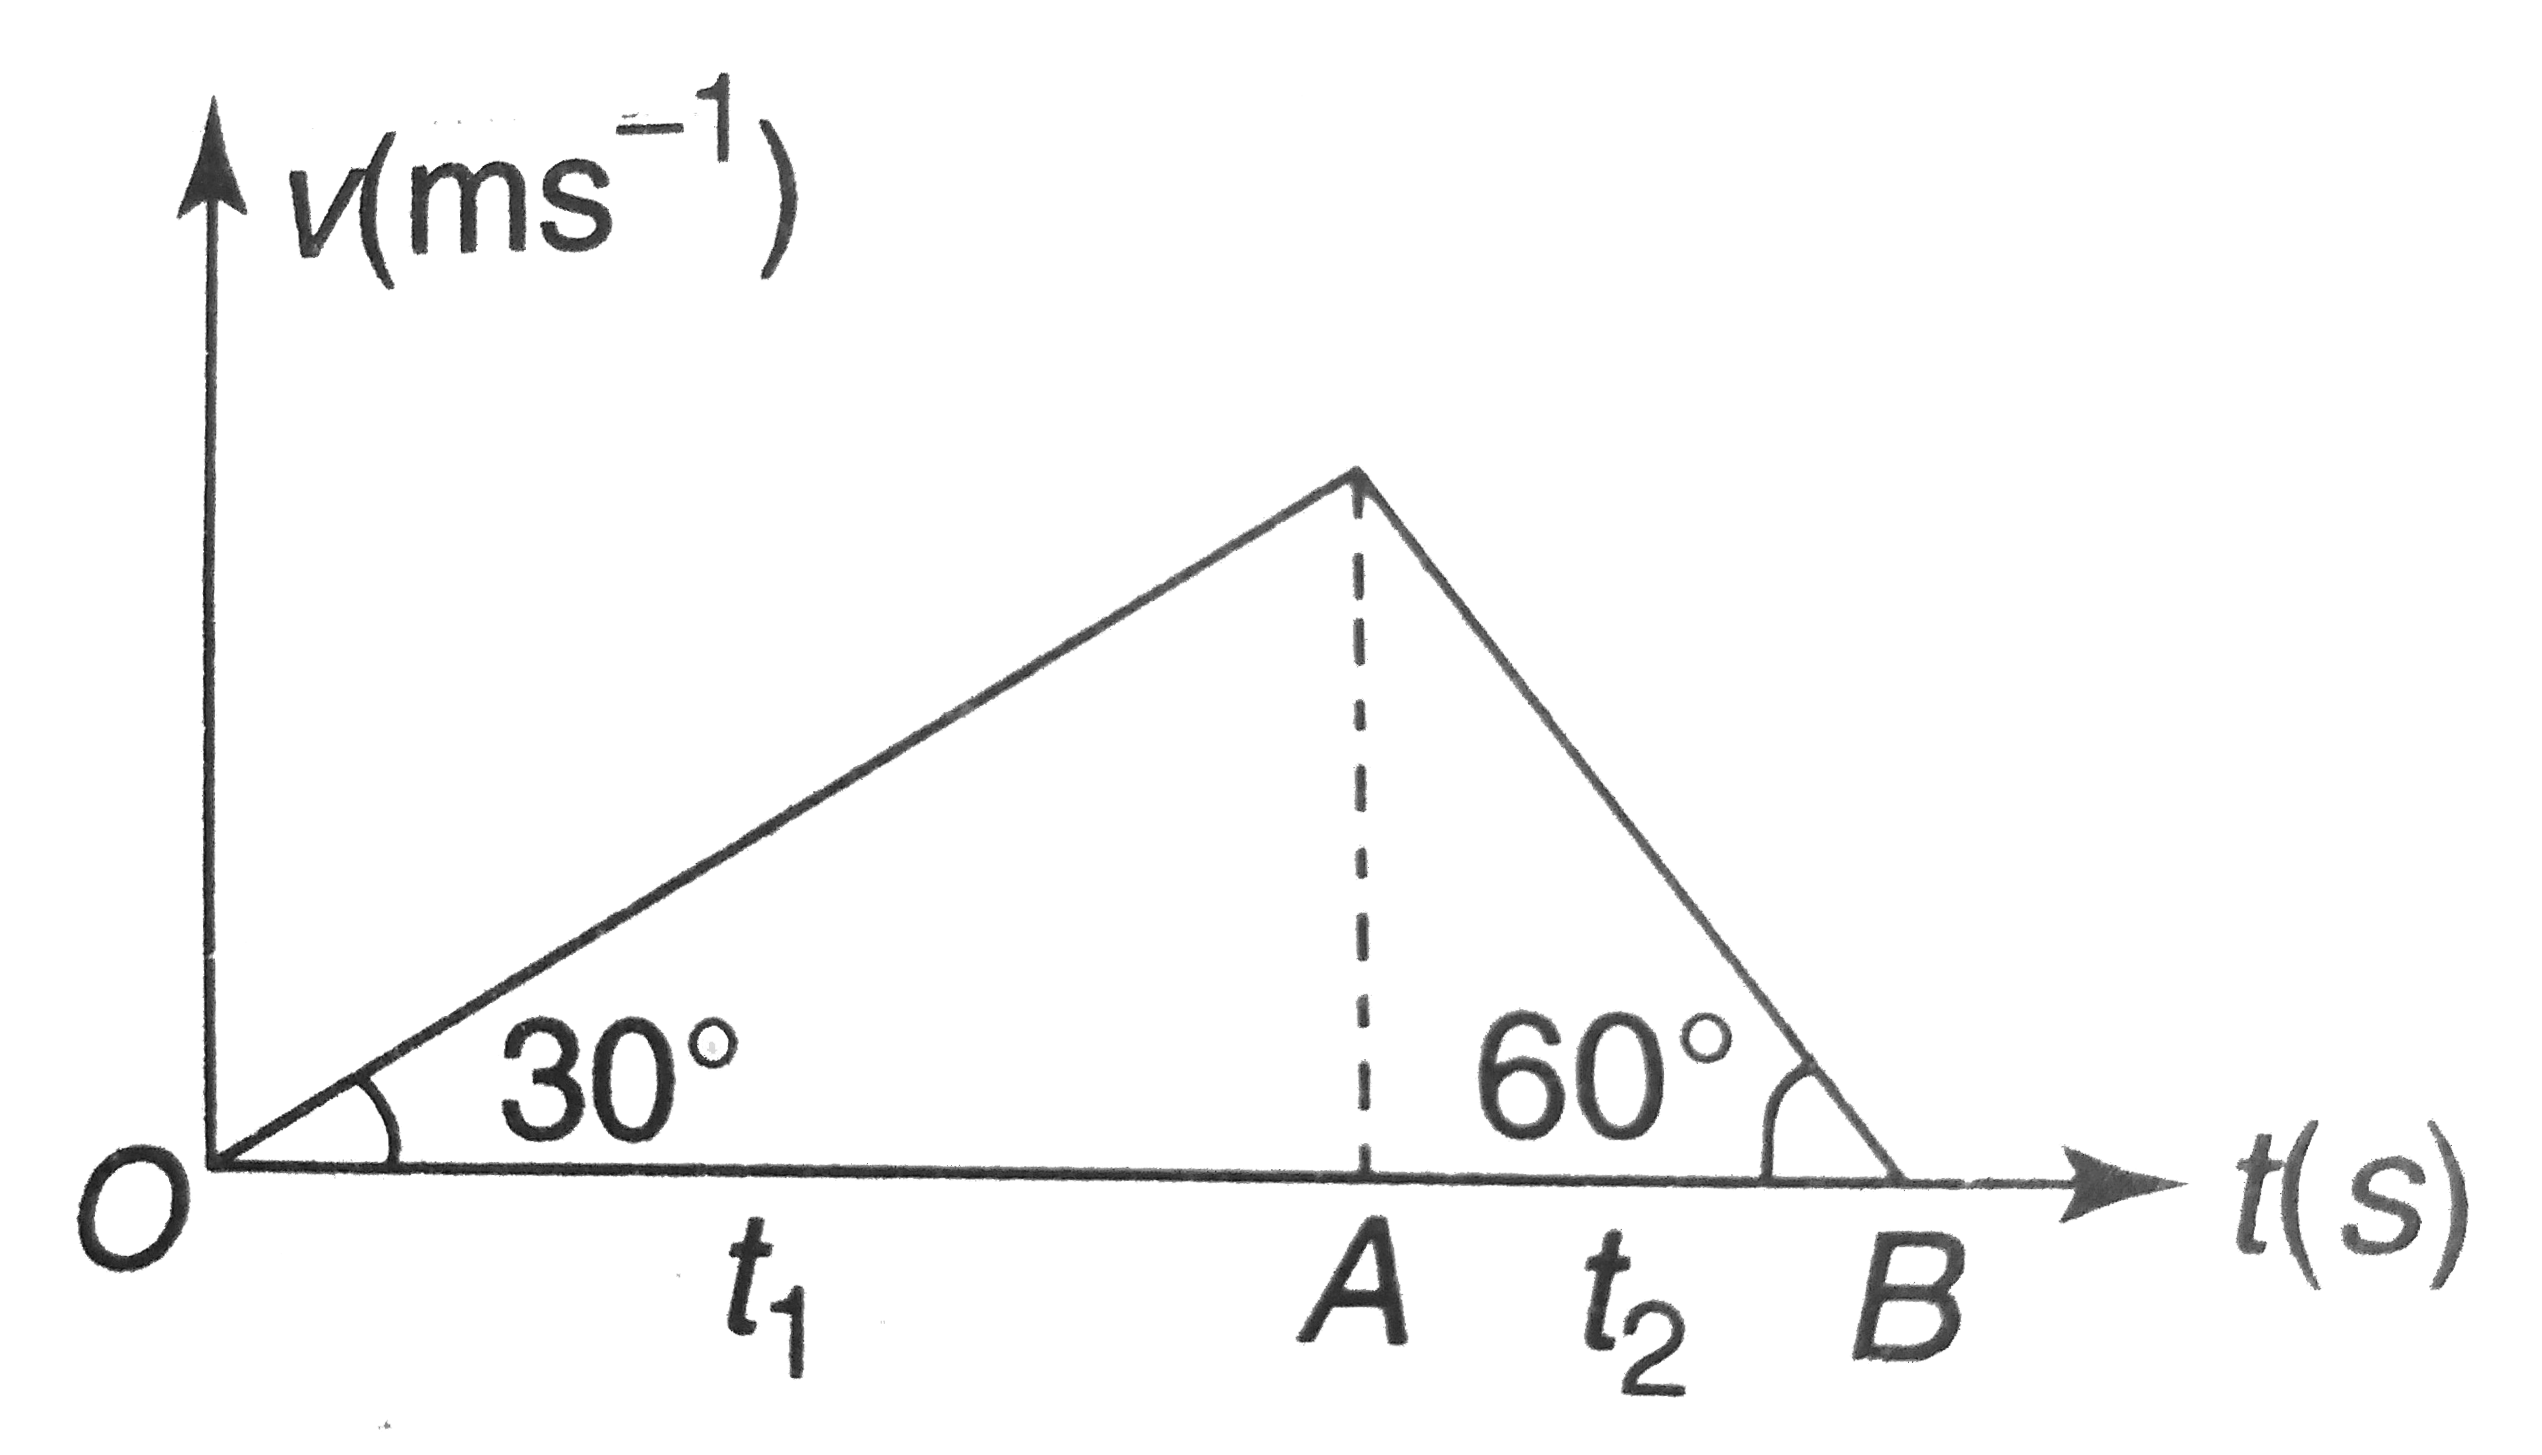
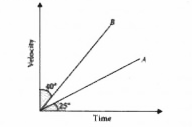
The velocity - time graph of a body is shown in fig. The ratio of the .....during the intervals OA and AB is _______
 Solution in Telugu
average velocities: 1:1
OAAB:14
average accelerations, same as distances covered
distances covered :12
The correct Answer is:A
Step by step video, text & image solution for The velocity - time graph of a body is shown in fig. The ratio of the .....during the intervals OA and AB is _______ by Physics experts to help you in doubts & scoring excellent marks in Class 12 exams.
Updated on:21/07/2023Topper's Solved these Questions
- MOTION IN A STRAIGHT LINE Book:AAKASH SERIESChapter:MOTION IN A STRAIGHT LINE Exercise:PRACTICE EXERCISE
Explore 58 Videos
- MOTION IN A STRAIGHT LINE Book:AAKASH SERIESChapter:MOTION IN A STRAIGHT LINE Exercise:problems
Explore 47 Videos
- MOTION IN A STRAIGHT LINE Book:AAKASH SERIESChapter:MOTION IN A STRAIGHT LINE Exercise:EXERCISE -I
Explore 58 Videos
- MOTION IN A PLANEBook:AAKASH SERIESChapter:MOTION IN A PLANEExercise:QUESTION FOR DESCRIPTIVE ANSWER
Explore 7 Videos
- MOVING CHARGES AND MAGNETISMBook:AAKASH SERIESChapter:MOVING CHARGES AND MAGNETISMExercise:EXERCISE-III
Explore 45 Videos
Similar Questions
If a cyclist takes two minutes to compete half revolution on a circular path of 120 m radius. What is the average speed?
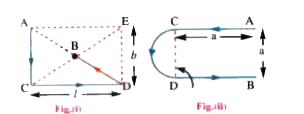
View SolutionFind the covered by the particles,in the following figures,(i) and (ii) while a particle travels from A to B as shown by the arrows.
View SolutionThe ratio of the numerical values of the average velocity and average speed of a body is always
View SolutionA particle is projected over a triangle from one end of a horizontal base and garzing the vertex falls on the other end of the base . If α and β the base angles and θ the angle of projection then show that tanθ=tanα+tanβ.
View SolutionA proton, a deuteron and an a particle having same momentum enter a uniform magnetic field at right angles to the field. Then the ratio of their angular momenta during their motion in the magnetic field is
View SolutionThe velocity time graph of a body moving along a straight line is shown in figure. The ratio of the average velocities during the time t1 and t2 is.
View SolutionThe graph between the displacement x and time t for a particle moving in a straight line is shown in the figure. During the interval OA, AB, BC and CD the acceleration of the particle is OA, AB, BC, CD
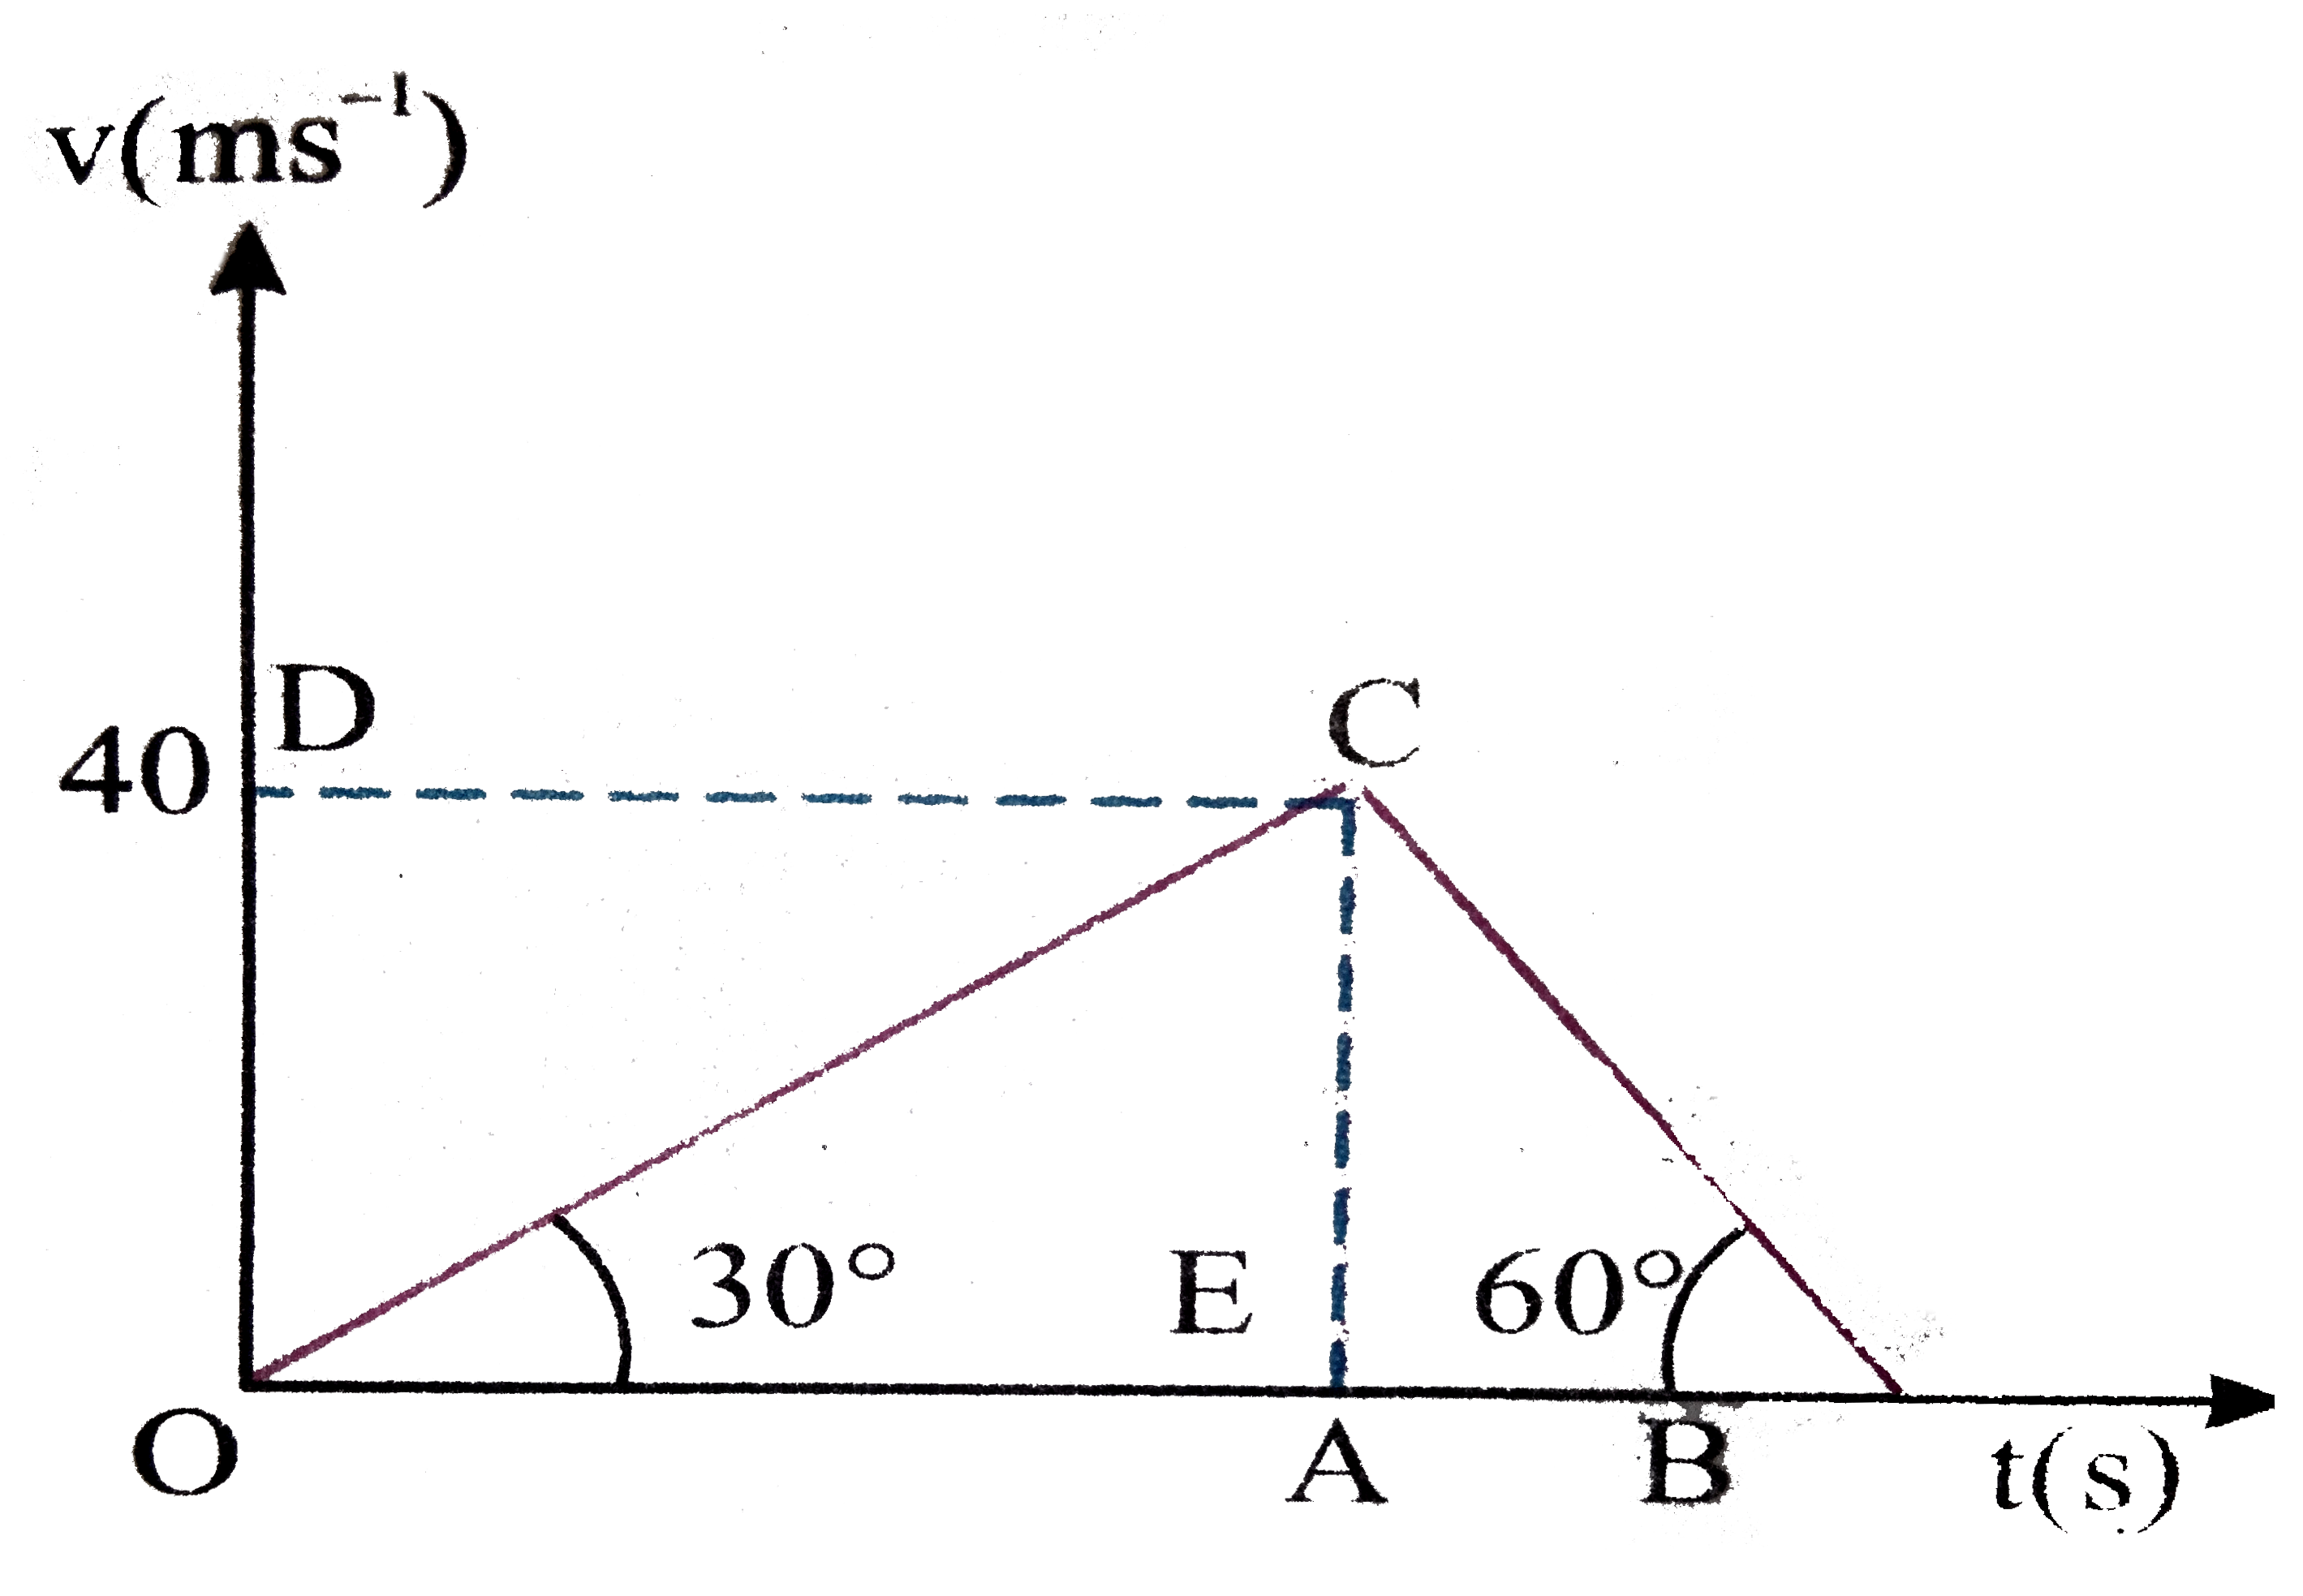
View SolutionThe velocity-time graph of a body is shown in figure. The ratio of magnitude of average acceleration during the intervals OA and AB is
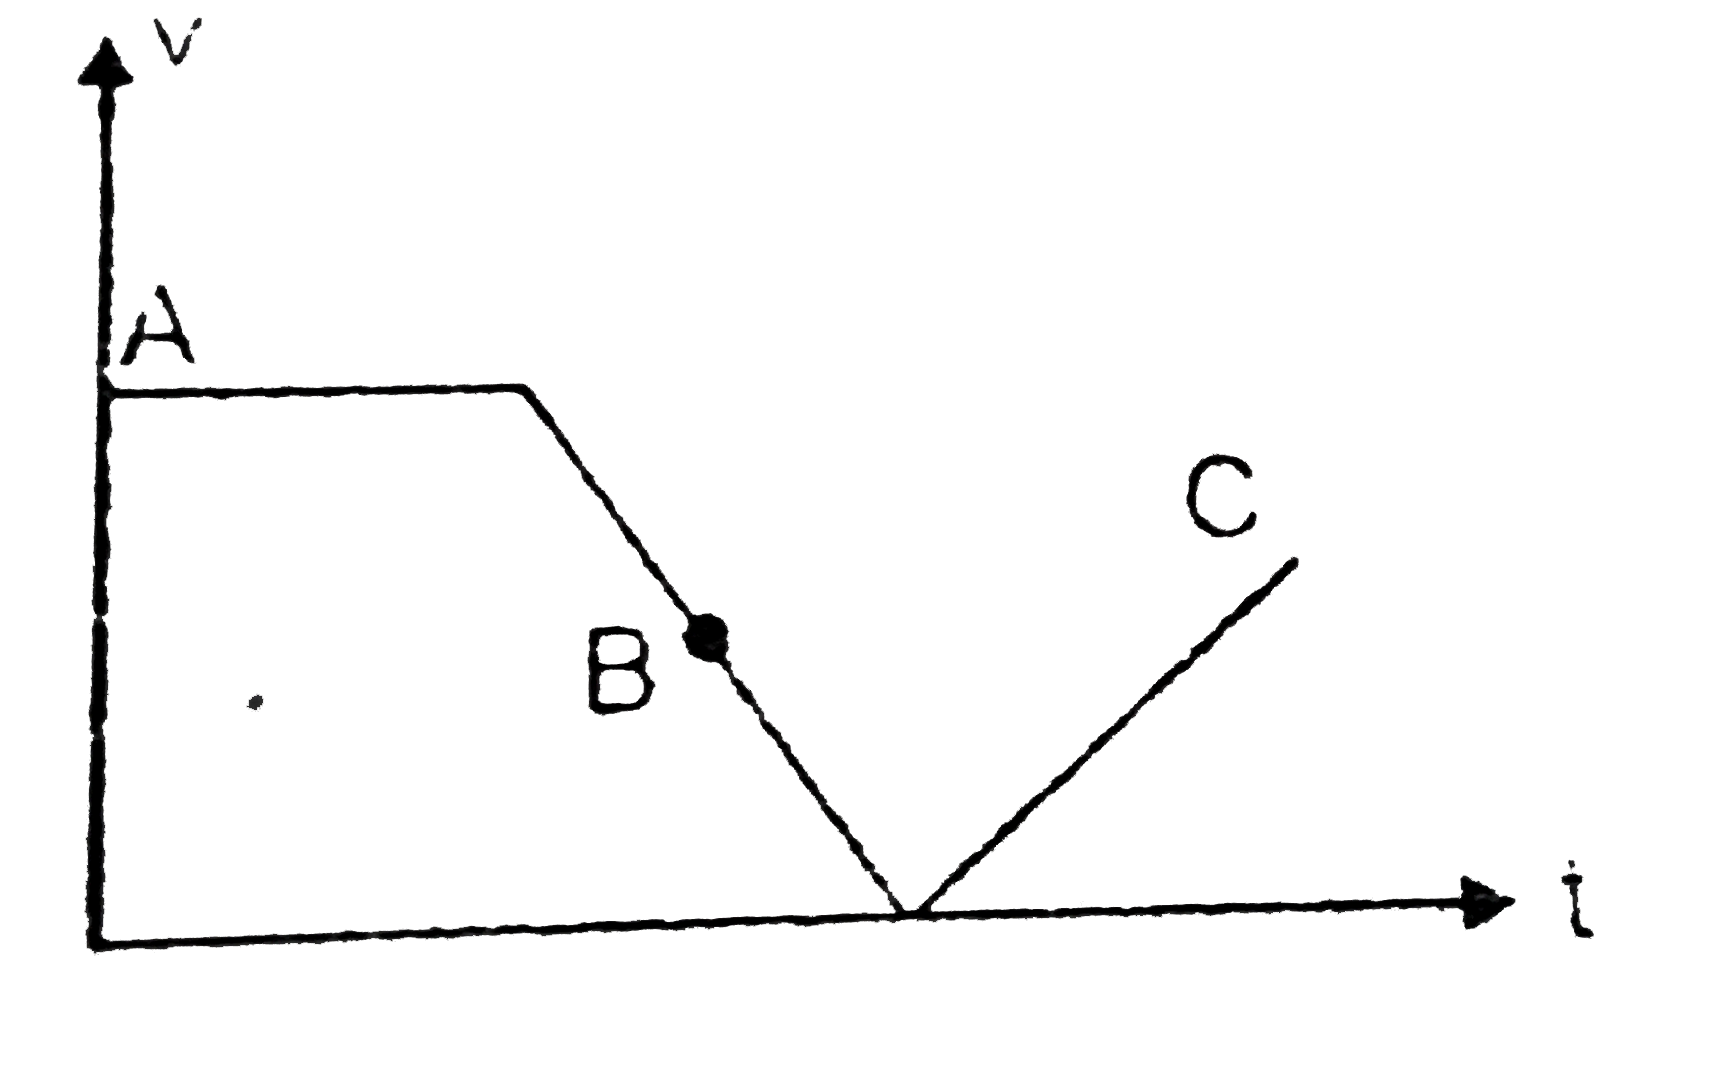
View SolutionThe velocity time graph of a body is shown in fig. it indicates that :
View SolutionOn a velocity time graph of a body, the ratio of average acceleration during time interval OA and AB is:
View SolutionThe velocity time graph of a body moving along a straight line is shown in Fig. The acceleration of the body during OA will be:
View SolutionThe velocity - time graph for two bodies A and B are in the ratio
View SolutionThe graph between the displacement x and time t for a particle moving in a straight line is shown in figure. During the interval OA, AB, BC and CD, the acceleration of the particles is
View SolutionThe position - time graph for a particle is shown in fig. Then in the time interval of (0, 6sec)
View SolutionThe velocity-time (v – t) graph of a body is shown in the figure. For the intervals OP and PQ, the ratio of the distances covered is
View Solution

