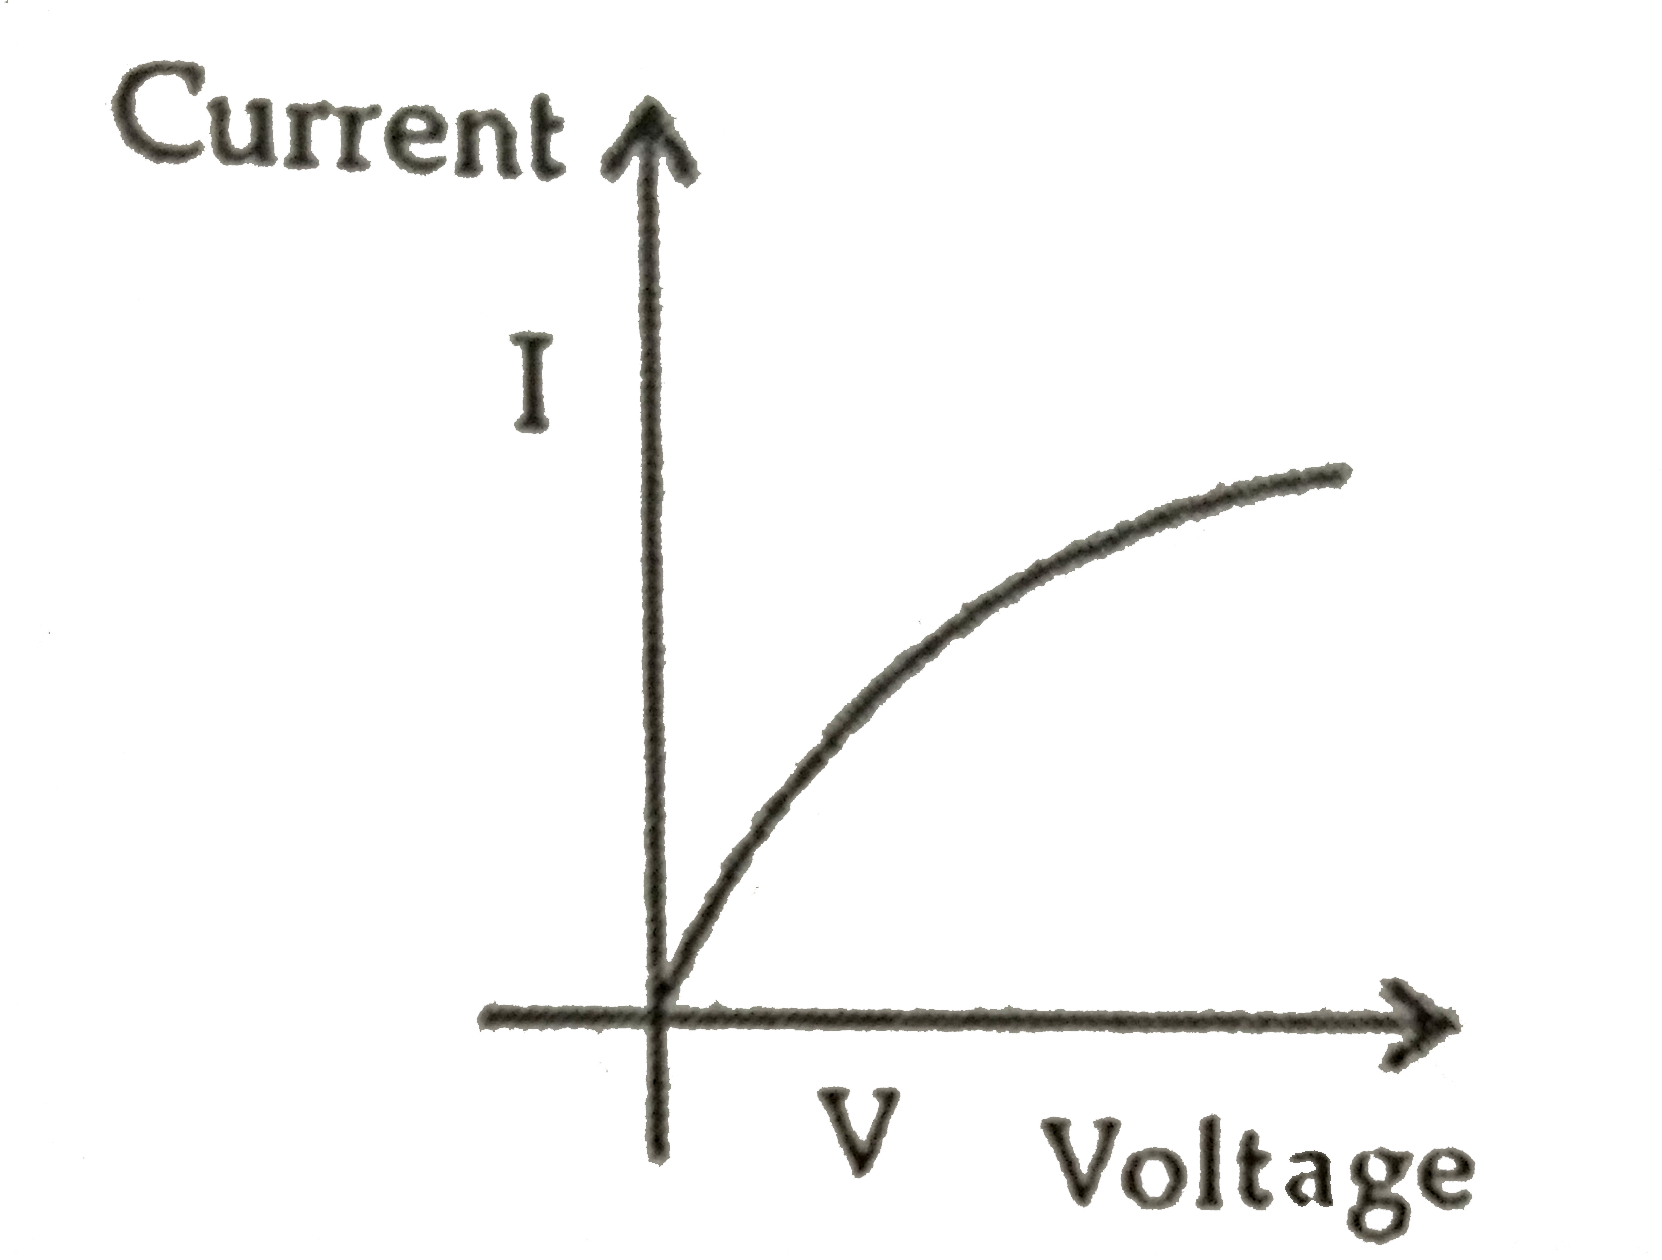
(a) Draw graph showing the variation of current versus voltage in an electroyte when an external resistance is also connceted.
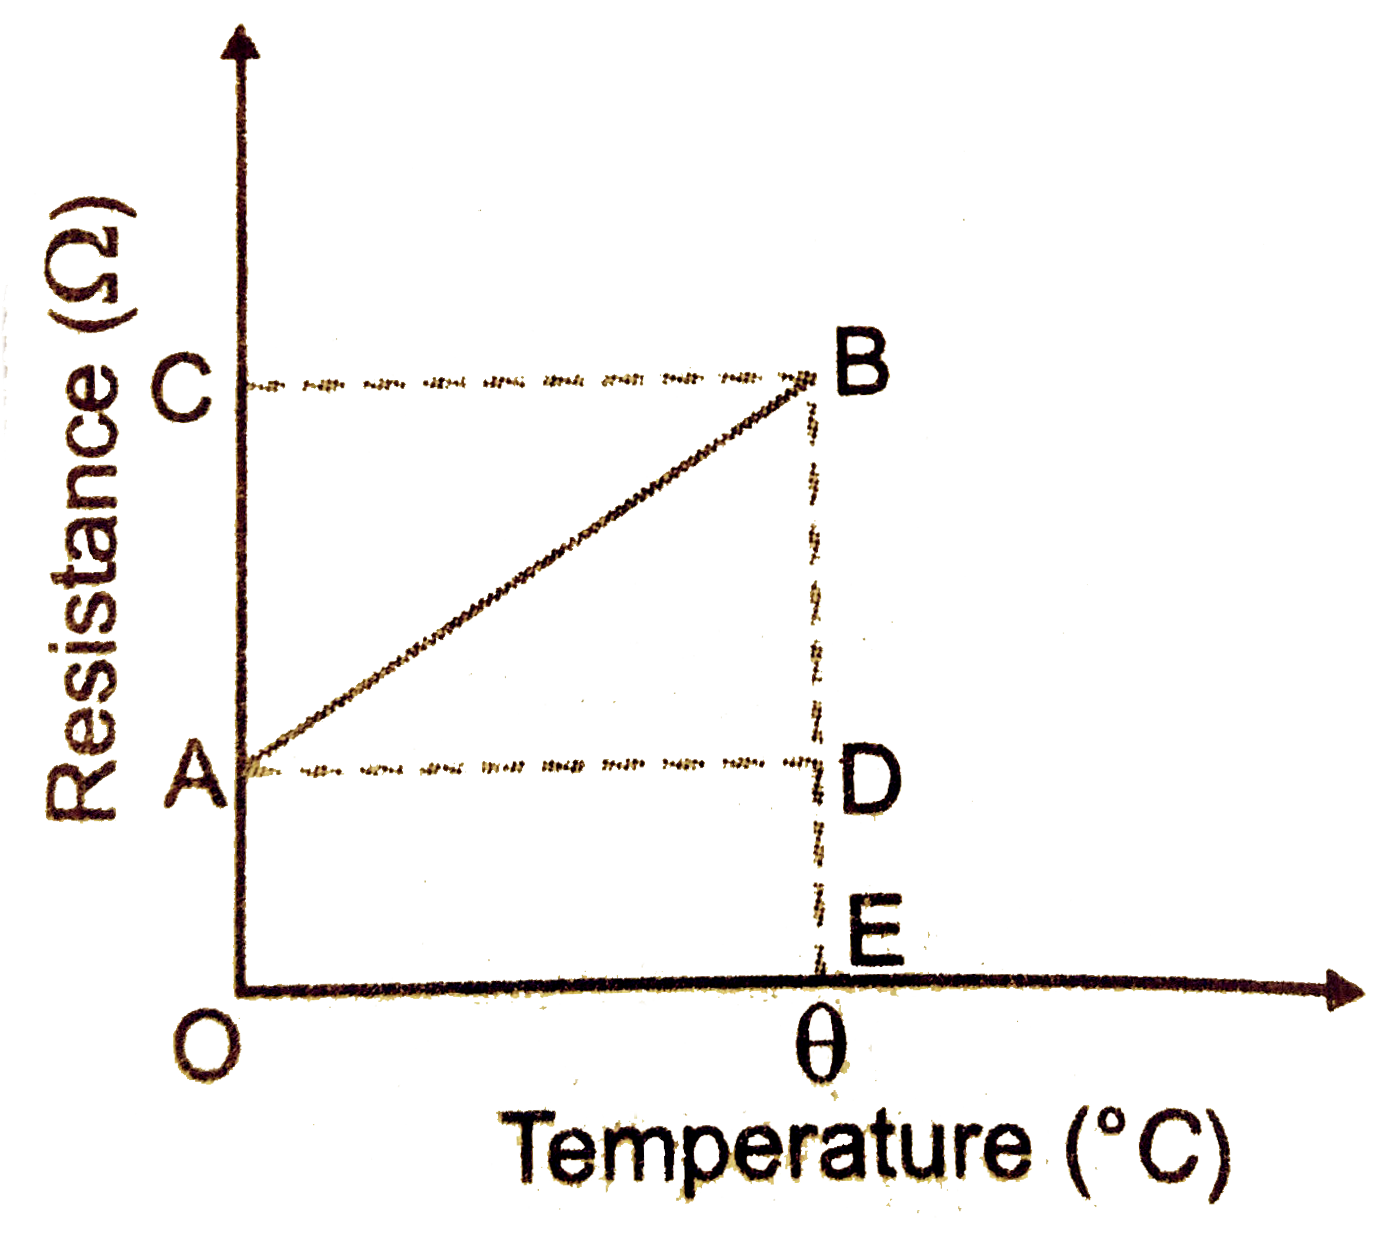
(b) (i) The graph between resistance (R ) and temperature (T) for Hg is shown in the figure (a). Explain the behaviour of Hg near 4k.
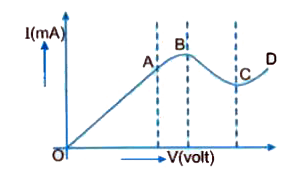
(ii) In which region of the graph shown in the figure (b) is the resistance negative and why?

(a) Current
(i) Near 4 K the resistance of Hg is zero hence it will at like a super conductor.
(i) From B to C, the resistance is -ve, as voltage is increasing and the current is decreasing.
Topper's Solved these Questions
- XII BOARDSBOOK - XII BOARDS PREVIOUS YEARCHAPTER - XII BOARDSEXERCISE - SECTION - D
6 Videos
- XII BOARDSBOOK - XII BOARDS PREVIOUS YEARCHAPTER - XII BOARDSEXERCISE - SECTION - E
6 Videos
- XII BOARDSBOOK - XII BOARDS PREVIOUS YEARCHAPTER - XII BOARDSEXERCISE - [SET -III, OUTSIDE DELHI]
5 Videos
- SAMPLE PAPER 2019BOOK - XII BOARDS PREVIOUS YEARCHAPTER - SAMPLE PAPER 2019EXERCISE - SECTION D
6 Videos
Similar Questions
Graph showing the variation of current versus voltage for a material GaAs is shown in figure. Identify the region of (i) negative resistance (ii) where Ohm's law is obeyed.
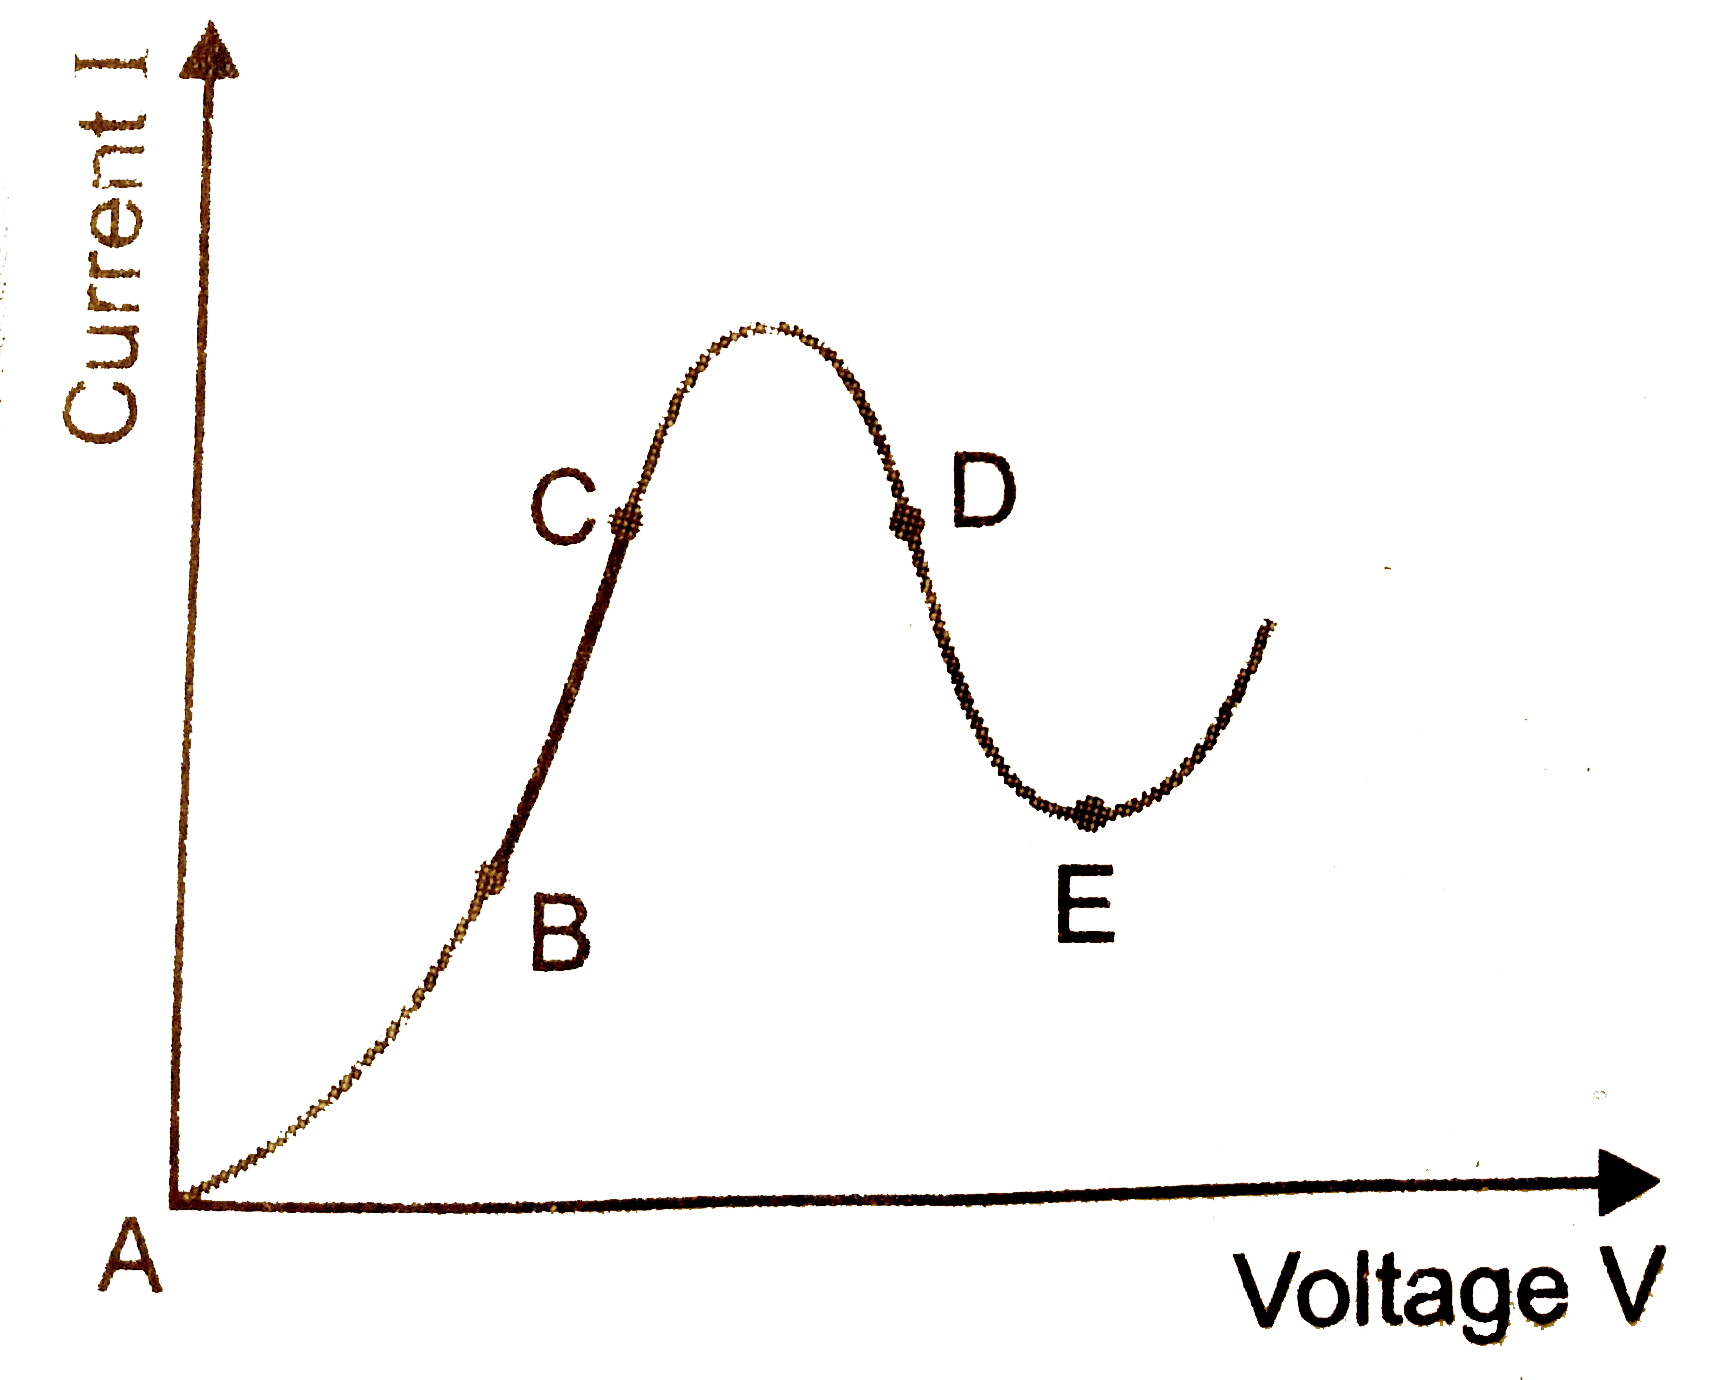
View SolutionGraph showing the variation of current versus voltage for a material GaAs is shown in figure. Identify the region of (i) negative resistance (ii) where Ohm's law is obeyed.

View Solution
Knowledge Check
The current-voltage graph of a device is shown in figure. The resistance is negative in region.
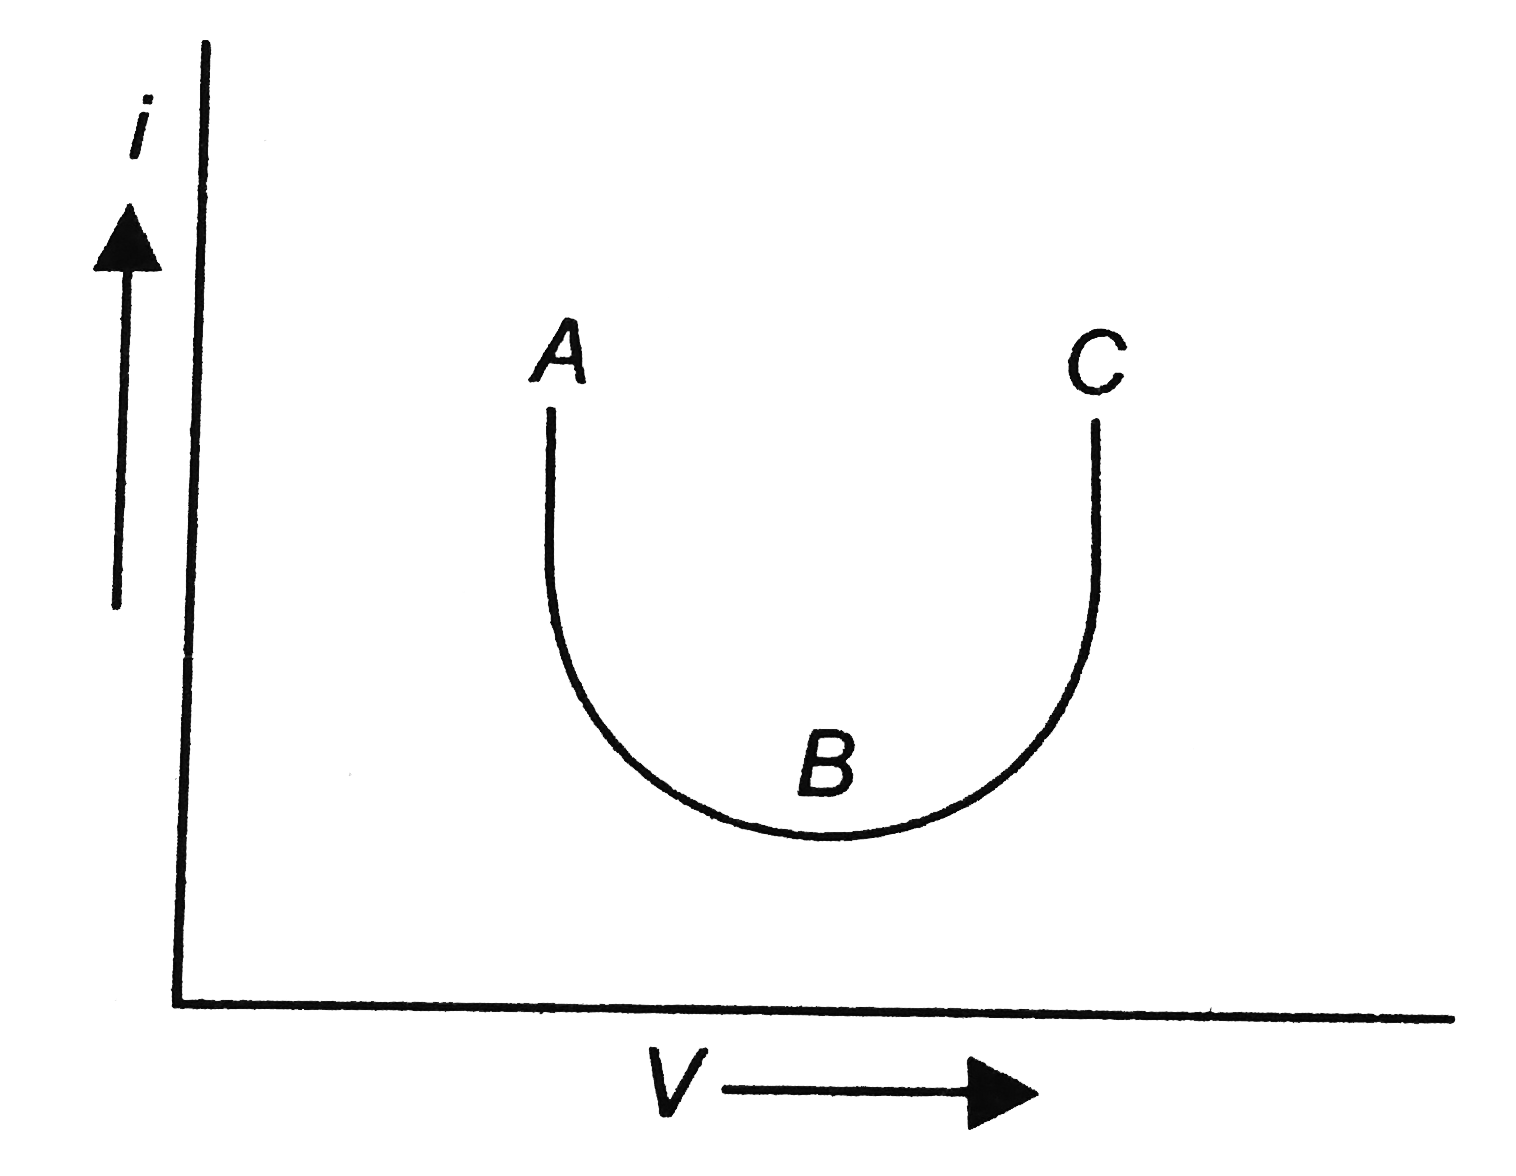 AABBBCCABCDNone of these
There are two samples A and B, which contains two different gases. Each sample has one mole of a gas. Graph between internal energy (E) and temperature (T) as shown in figure, then:
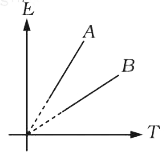 AA contains He, B contains N2BB contains N2, A contains O2CA contains CO2, B contains HeDA contains He, B contains CO2
A resistance R=12Ω is connected across a source of emf as shown in the figure. Its emf changes with time as shown in the graph. What is the heat developed in the resistance in the first 4 s. ?
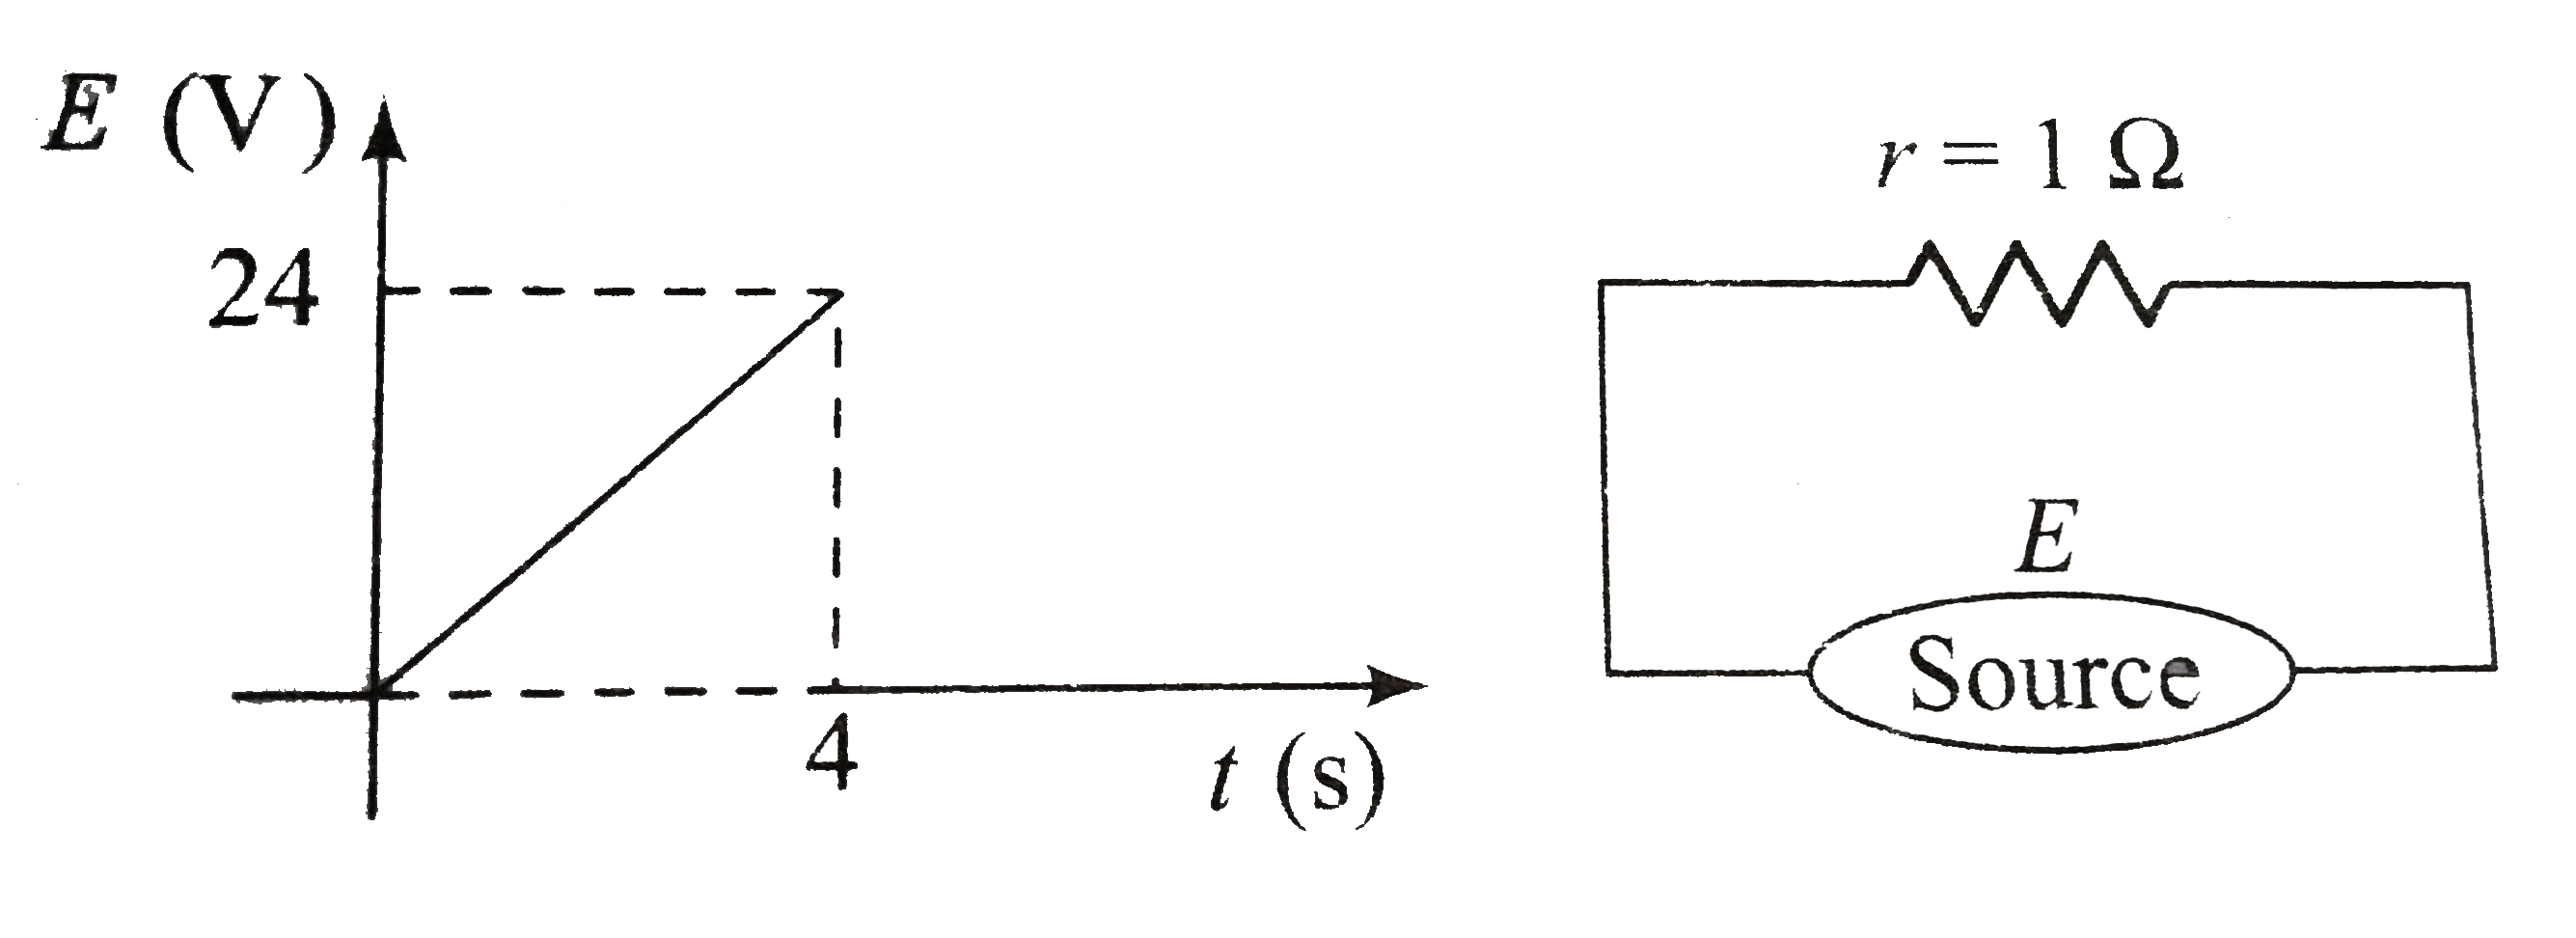 A72 JB64 JC108 JD100 J
The graph of current versus voltage drop across the three resistors P,Q,R is shown above. Find the ratio of their resistances.
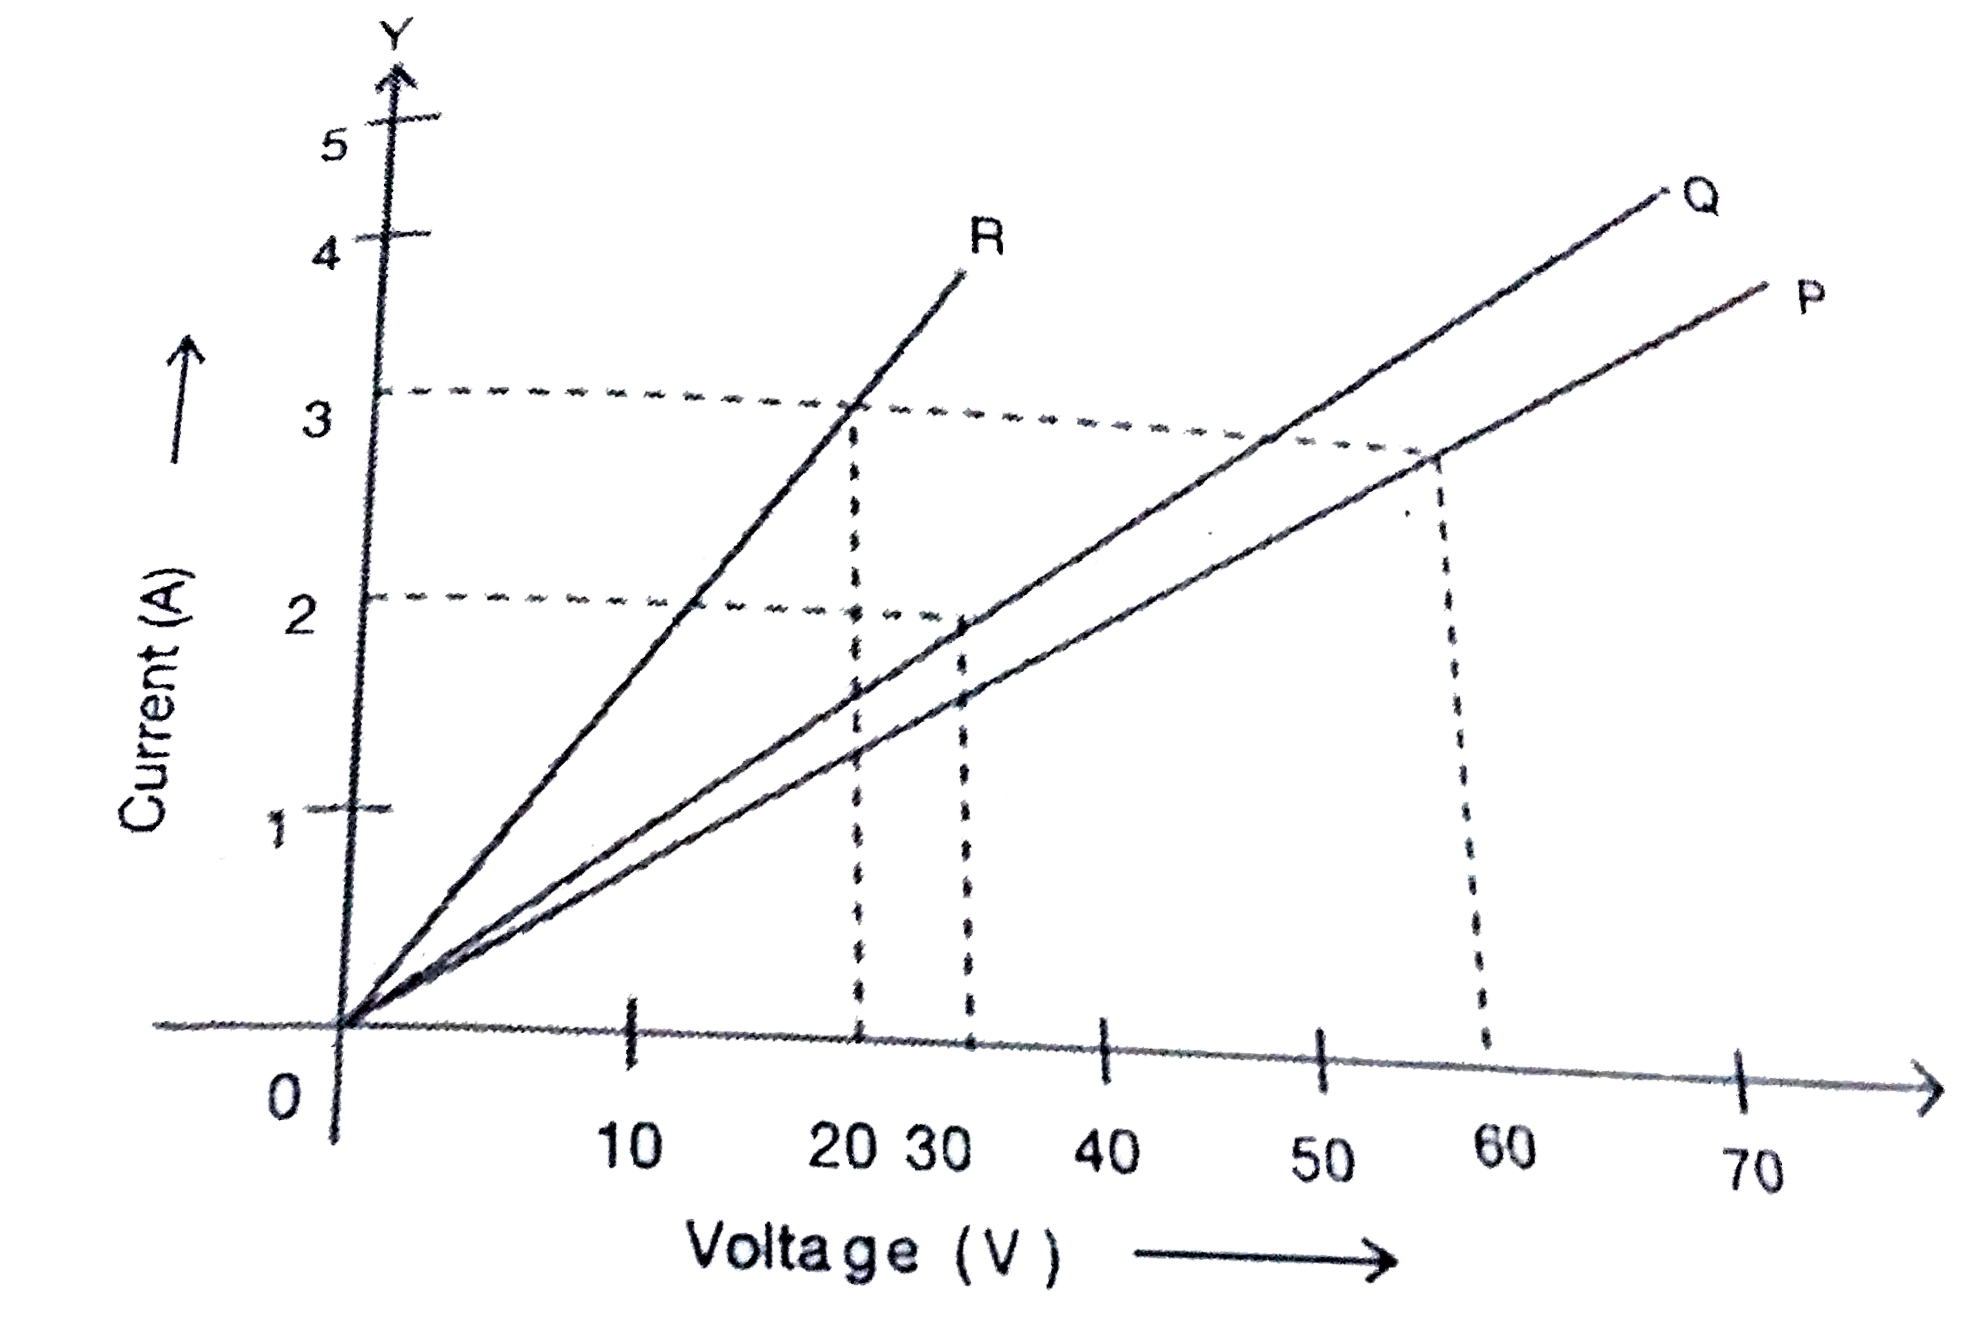
View SolutionGraph showing the variation of current versus voltage for a material Ga As (a semiconductor) is shown in the Fig. Identify the region of (i) negative resistance, (ii) where Ohm's law is obeyed.
View SolutionV-I graph for the metallic wires X and Y at constant temperature are as shown in figure:
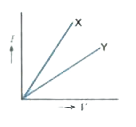
Assuming that the two wires have same length and same diameter, explain as to which of the two wires has higher resistivity and why?
View SolutionThe variation of resistance of a metallic conductor with temperature is shown in figure. (i) Calculate the temperature coefficient of resistance from the graph. (ii) State why the resistance of the conductor increases with the rise in temperature.
View Solution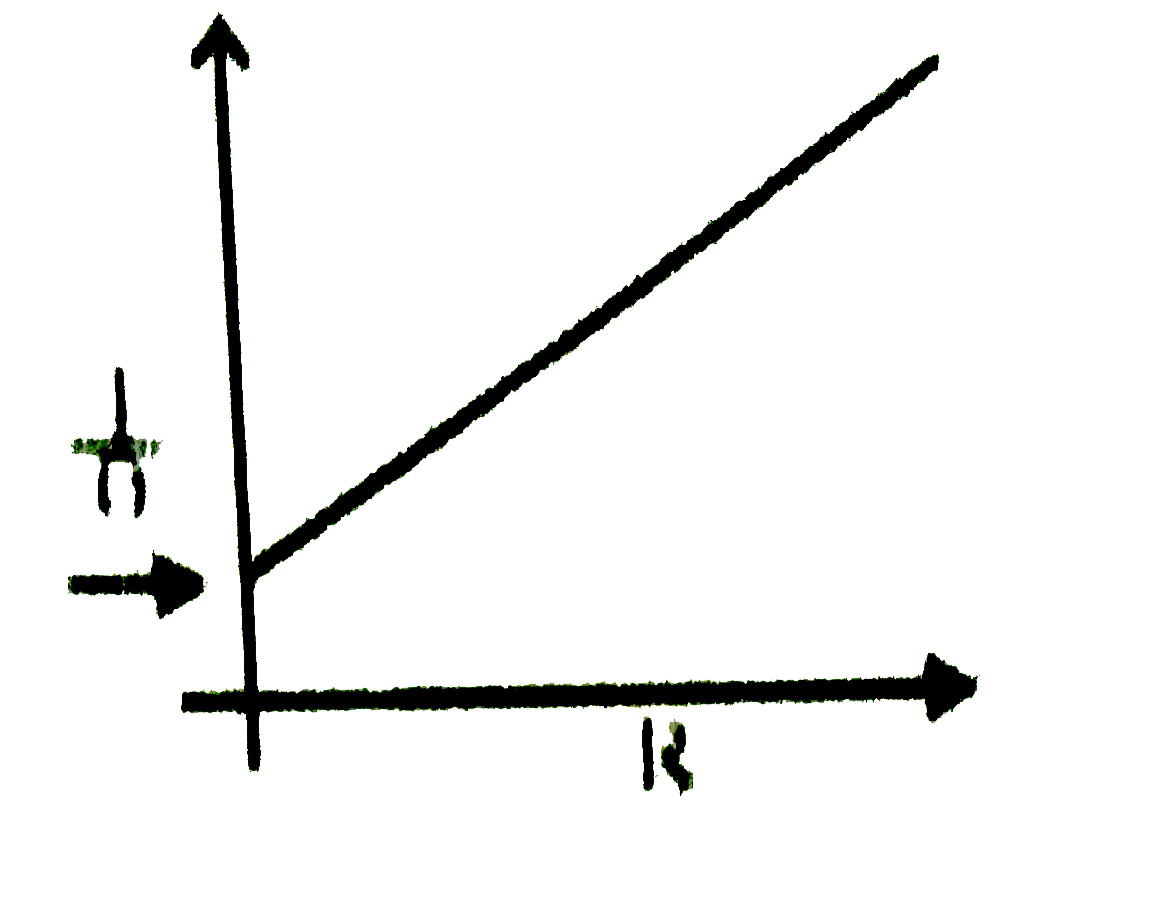
A student plots a graph between the resistance R and the reciprocal of deflection θ for the give galvanometer. The graph obtained is as shown in figure. From the graph he can calculate the resitance of galvanometer as
View Solution