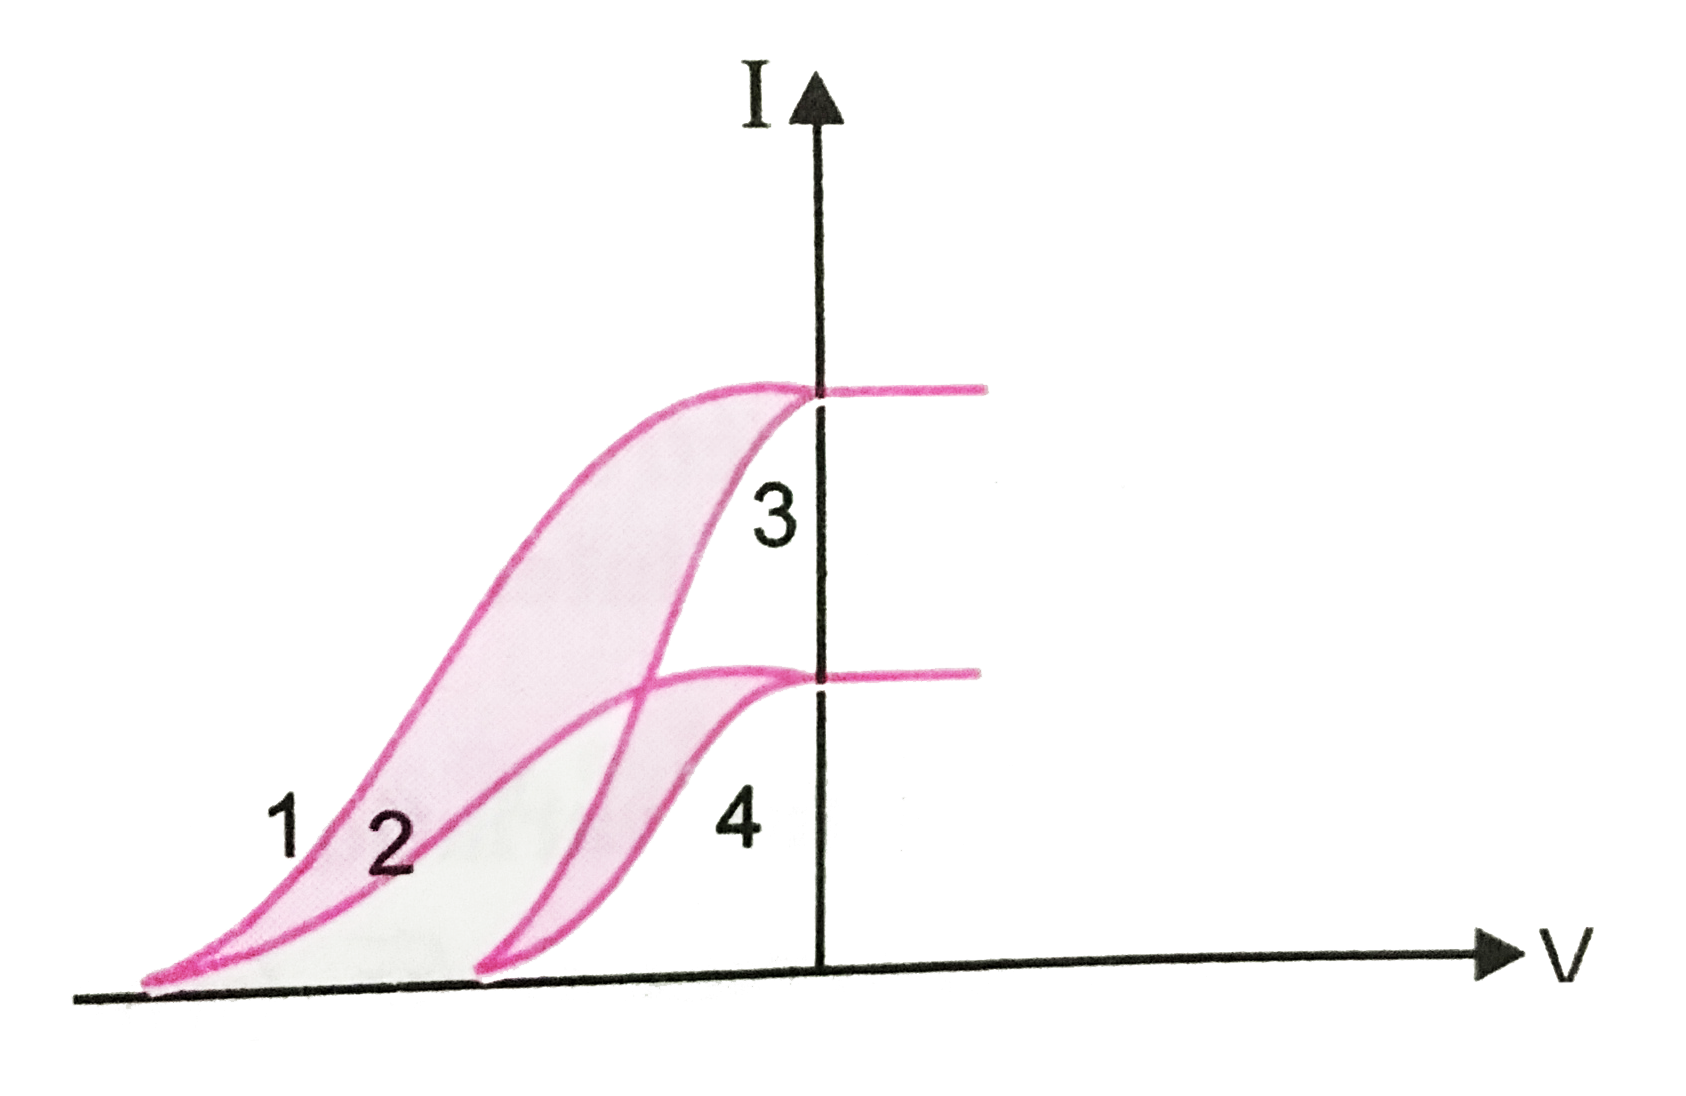
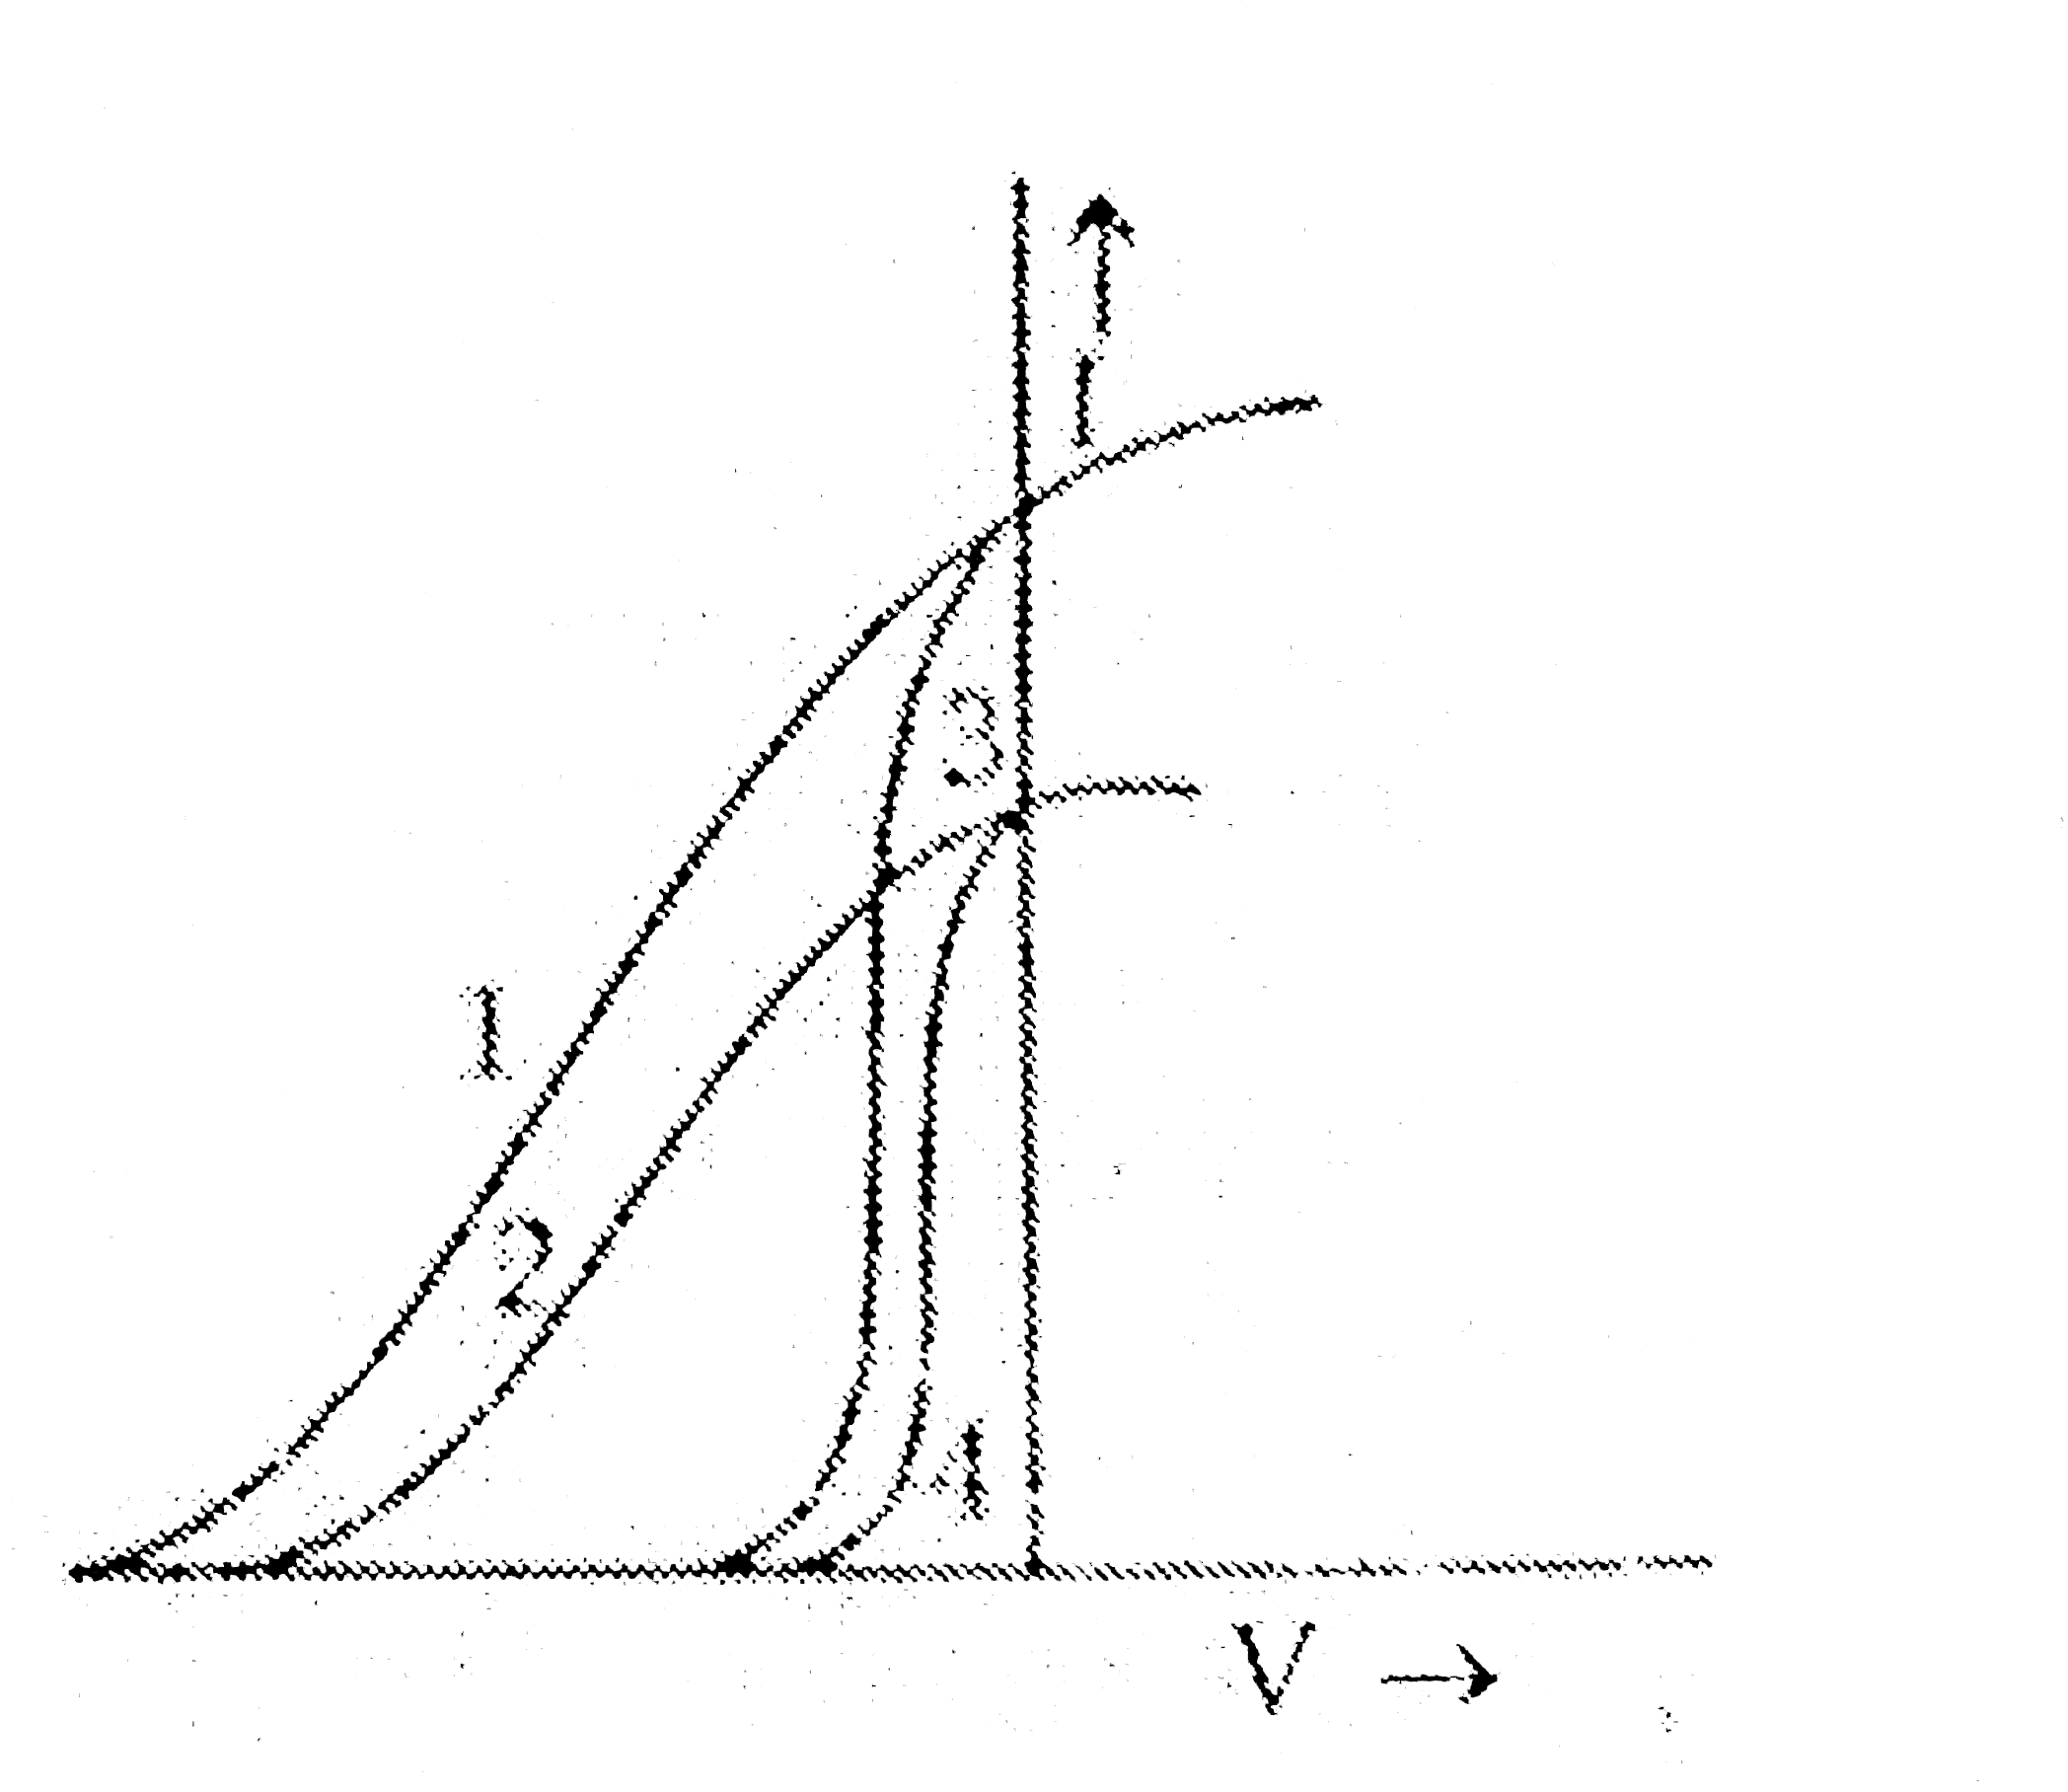
The graph of Fig. shows the variation of photoelectric current (I) versus applied voltage (V) for the two different photosensitive materials for two different intensities of the incident radiation. Identify the pairs of curves that correspond to different materials but same intensity of incident radiation.

Curves 1 and 2 correspond to similar materials while curves 3 and 4 represent different materials, since the value of stopping potential for the pair of curves 1 and 2 and 3 and 4 are the same. For given frequency of the incident radiation the stopping potential is independent of its intensity.
So, the pairs of curves (1, 3) and (2, 4) correspond to different materials but same intensity of incident radiation.

Topper's Solved these Questions
- XII BOARDSBOOK - XII BOARDS PREVIOUS YEARCHAPTER - XII BOARDSEXERCISE - SET - II (Delhi Board)
8 Videos
- XII BOARDSBOOK - XII BOARDS PREVIOUS YEARCHAPTER - XII BOARDSEXERCISE - SET - III (Delhi Board)
8 Videos
- XII BOARDSBOOK - XII BOARDS PREVIOUS YEARCHAPTER - XII BOARDSEXERCISE - PHYSICS (Theory) [SET - III]
10 Videos
- SAMPLE PAPER 2019BOOK - XII BOARDS PREVIOUS YEARCHAPTER - SAMPLE PAPER 2019EXERCISE - SECTION D
6 Videos
Similar Questions
Draw a plot showing the variation of photoelectric current versus the intensity of incident radiation on a given photosenstive surface.
View SolutionDraw graphs showing variation of photoelectric current with applied voltage for three incident radiations of equal frequency and different intensities. Mark the graph for the radiation of higher intensity.
View Solution
Knowledge Check
The act of photoelectric effect taking place with a certain photosensitive metal depends upon
(i) frequency annd
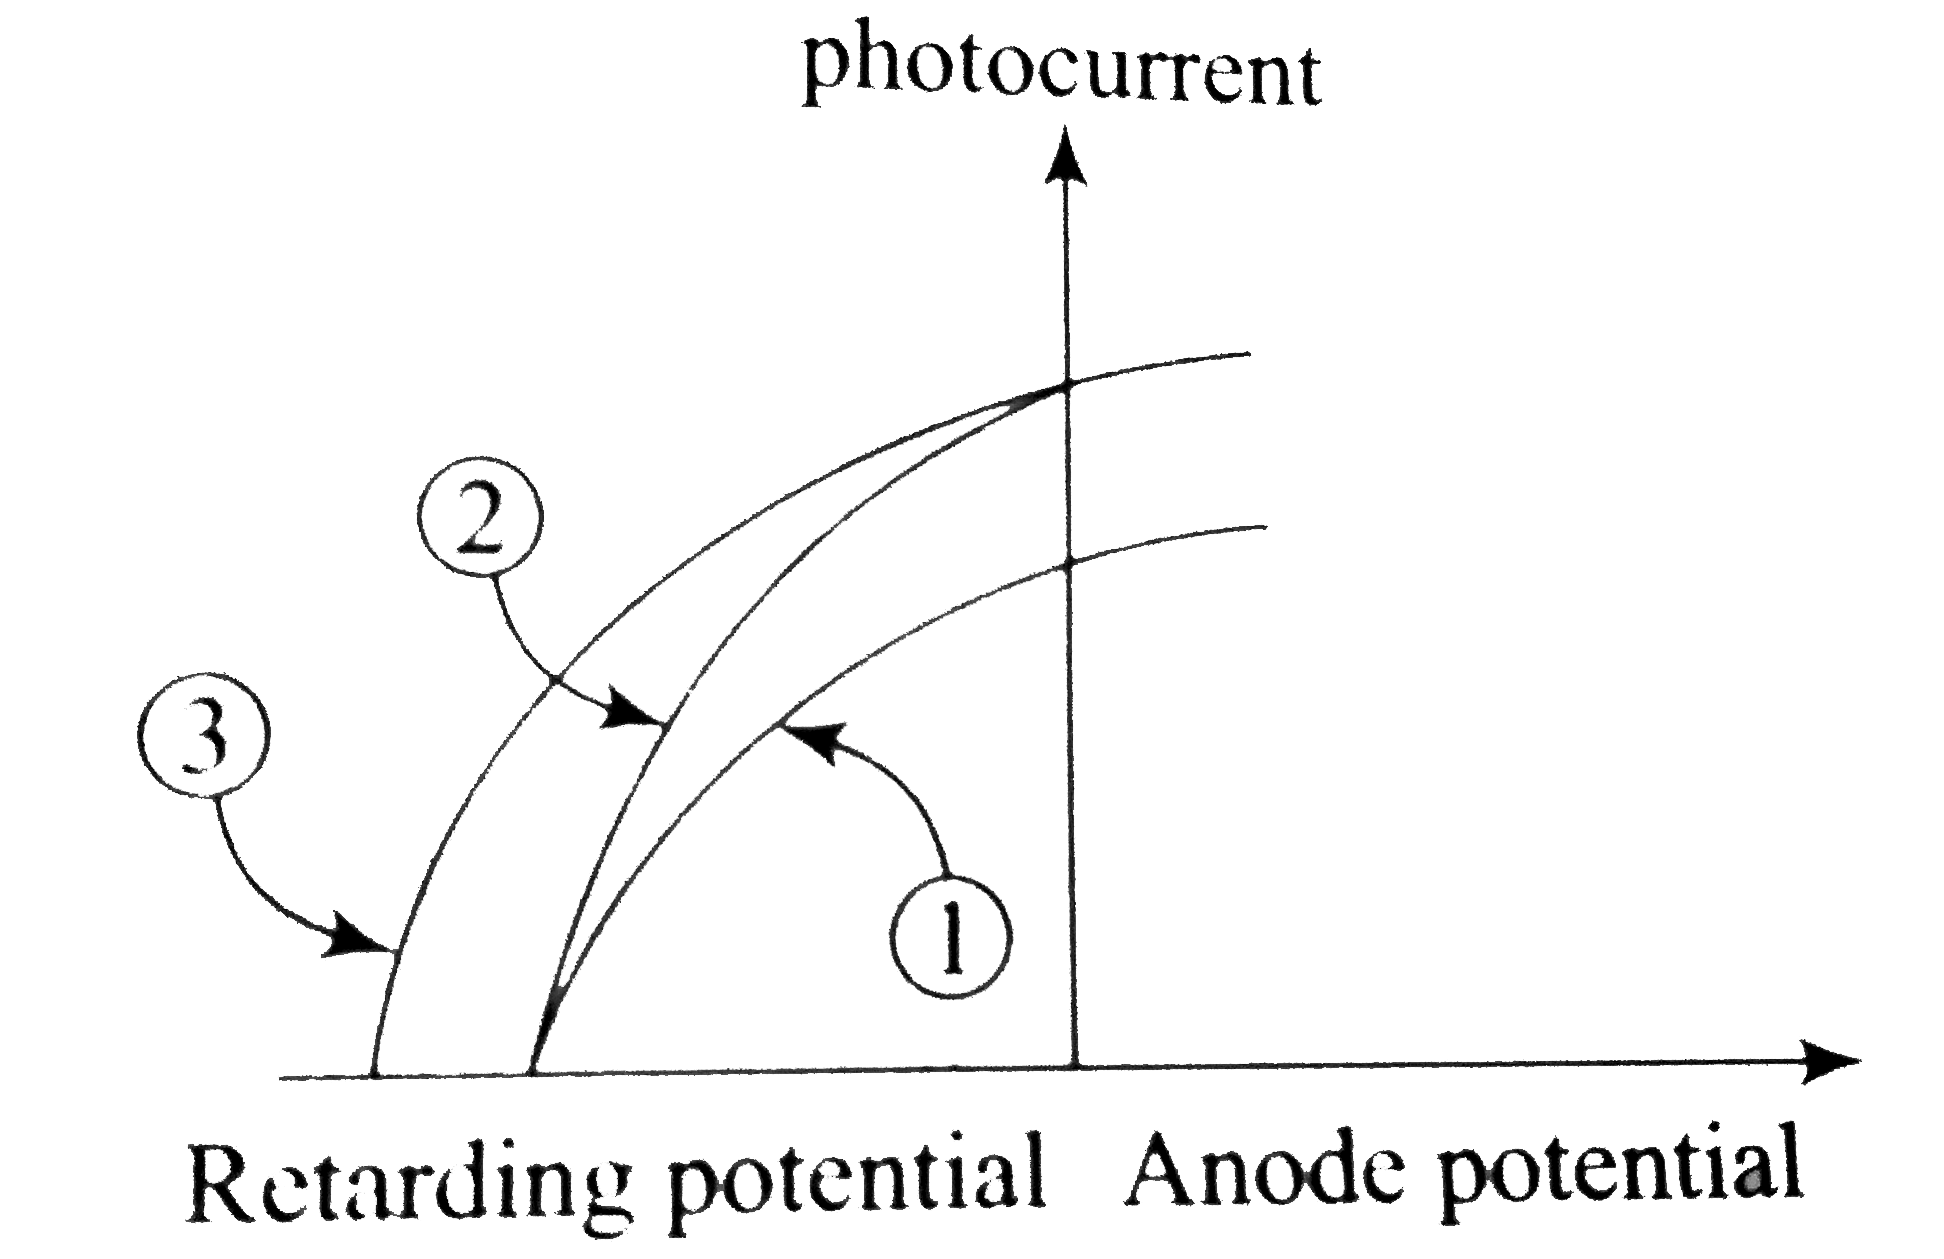
(ii) intensity of the incident radiation.Aboth (i) and (ii) are correctBonly (i) is correctConly (ii) is correctDneigher (i) nor (ii) is correct.The figure shows a plot of photo current versus anode potential for a photosensitive surface for three different radiations. Which one of the following is a correct statement ?
 ACurves a and b represent incident radiations of different frequencies and different intensitiesBCurves a and b represent incident radiations of the same frequency but no different intensitiesCCurves b and c represent incident radiations of different frequencies and different intensitiesDCurve b and c represent incident radiations of the same frequency having the same intensity
Draw a plot showing the variation of photoelectric current versus the intensity of incident radiation on a given photosensitive surface.
View SolutionDraw a plot showing the variation of photoelectric current versus the intensity of incident radiation on a given photosenstive surface.
View SolutionDarw graphs showing variation of photoelctric current with applied voltage for two incident radiations of equal frequecny and different intensities. Mark the graph for the radiaiton of higher intensity.
View SolutionDarw graphs showing variation of photoelctric current with applied voltage for two incident radiations of equal frequecny and different intensities. Mark the graph for the radiaiton of higher intensity.
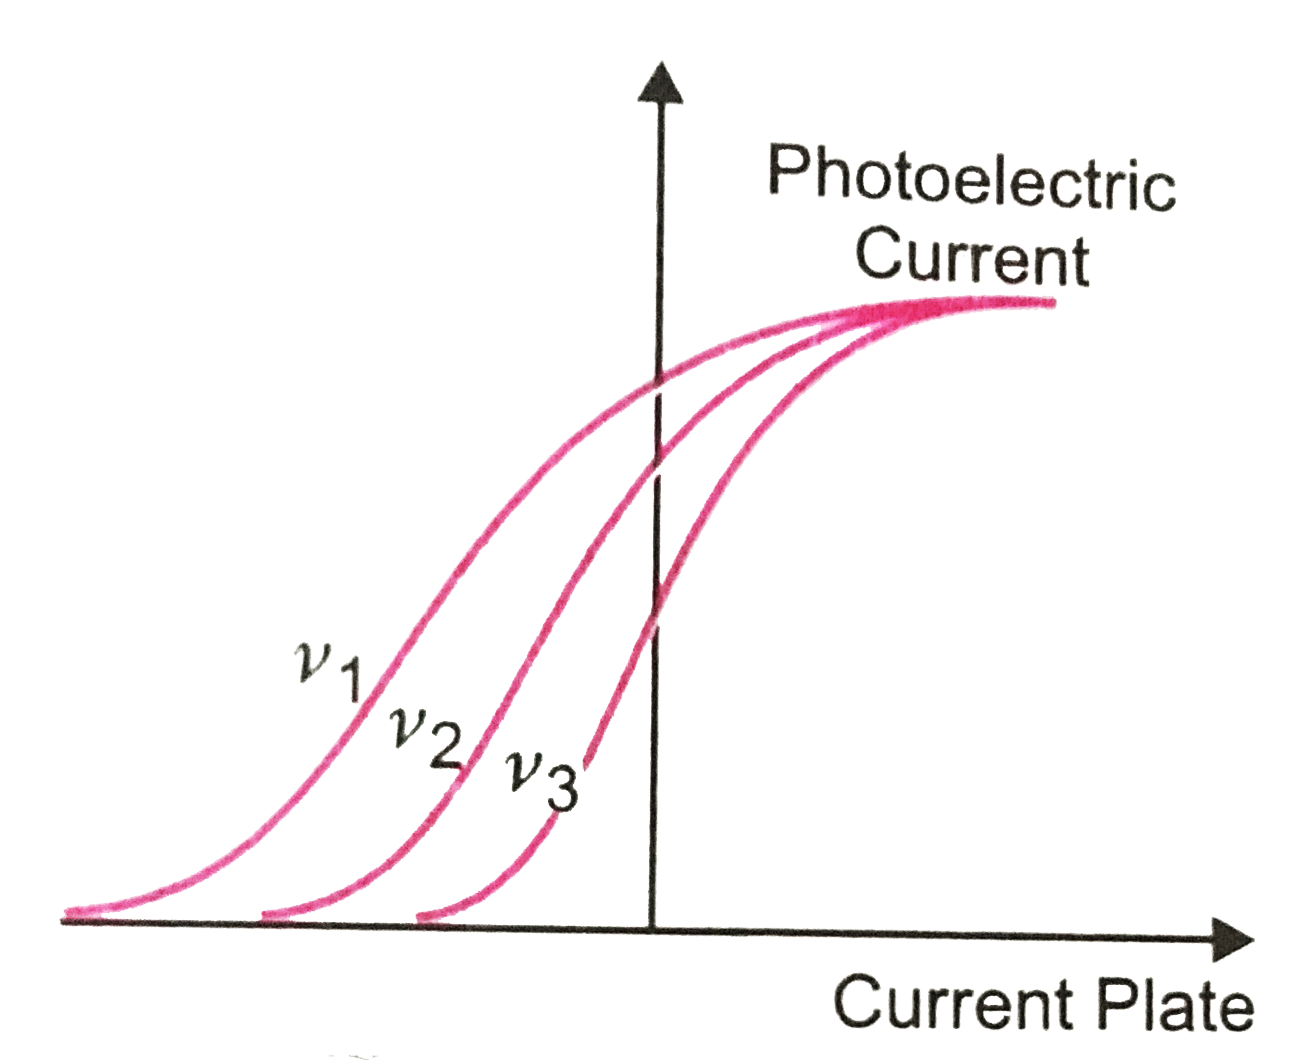
View SolutionThe graph of Fig. shows the variation of photoelectric current with collector plate potential for different frequencies of incident radiations.

(i) Which physical parameter is kept constant for the three curves?
(ii) Which frequency (v1,v2orv3) is the highest?
View SolutionPlot a graph showing the variation of photoelectric current with anode potential for two light beam of same wavelength but different intensity.
View Solution