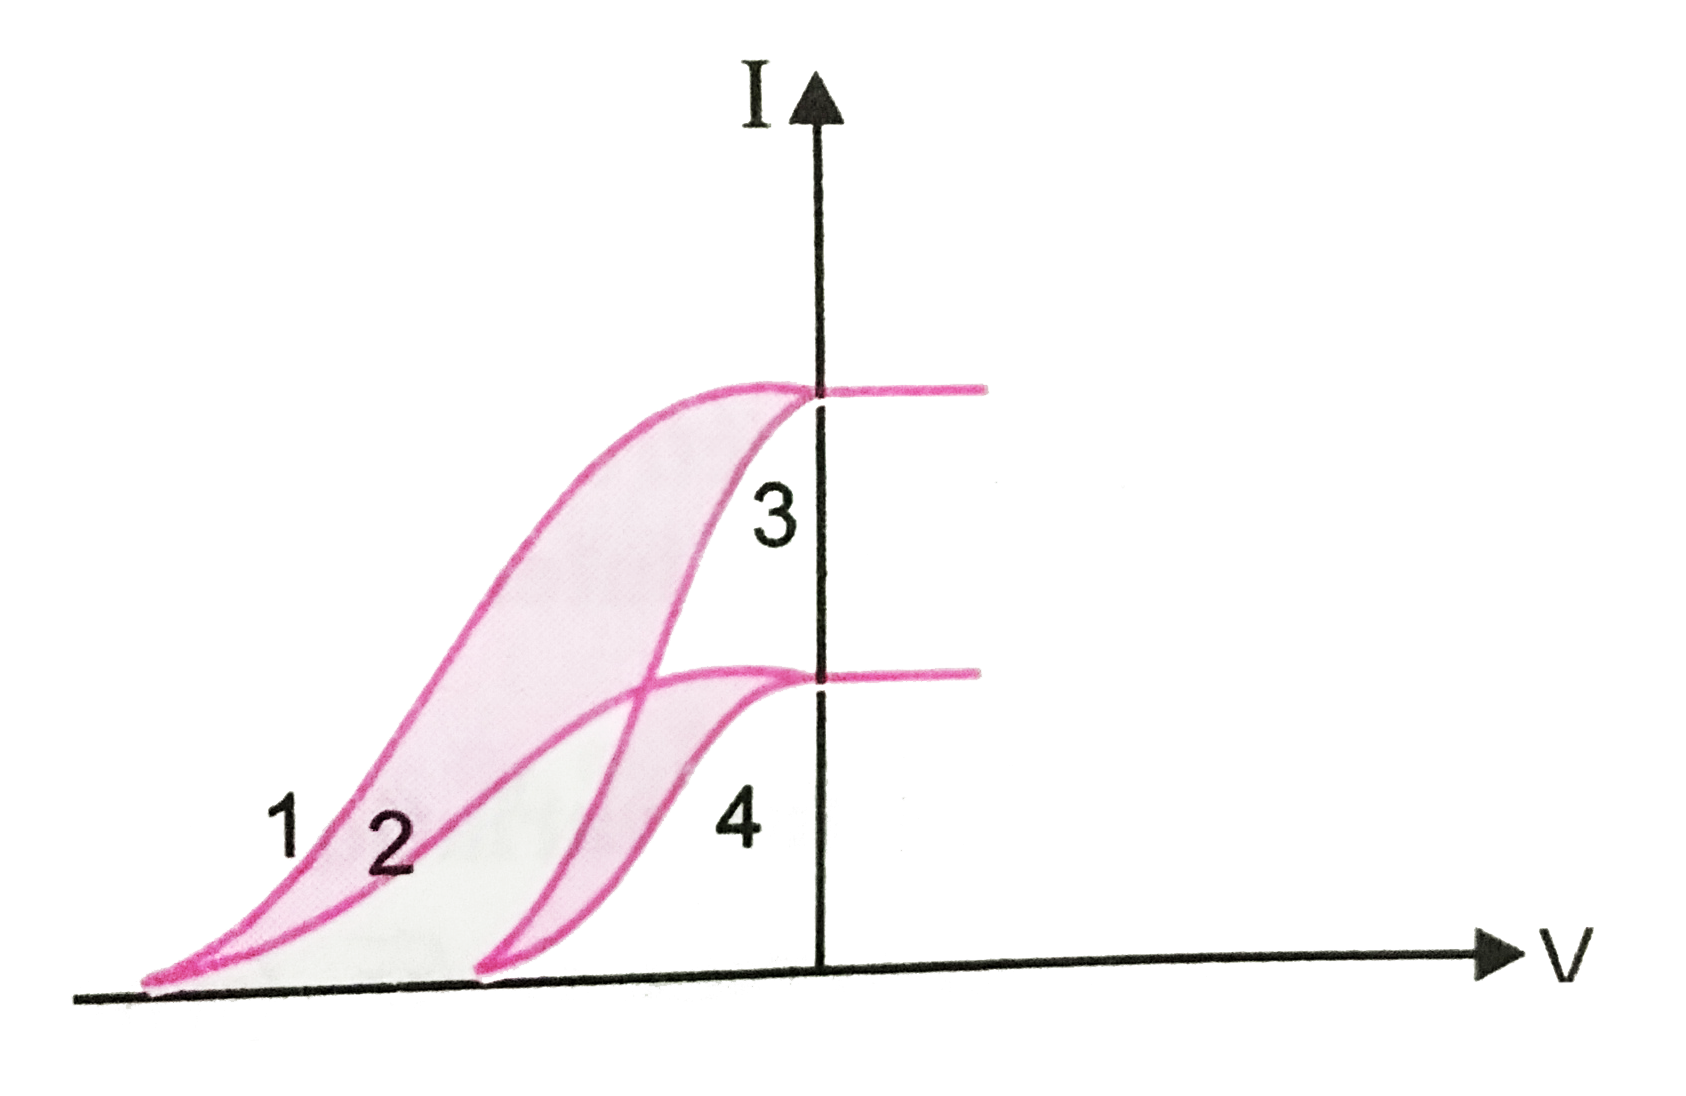
Darw graphs showing variation of photoelctric current with applied voltage for two incident radiations of equal frequecny and different intensities. Mark the graph for the radiaiton of higher intensity.
Similar Questions
Darw graphs showing variation of photoelctric current with applied voltage for two incident radiations of equal frequecny and different intensities. Mark the graph for the radiaiton of higher intensity.
View SolutionDraw graphs showing variation of photoelectric current with applied voltage for three incident radiations of equal frequency and different intensities. Mark the graph for the radiation of higher intensity.
View SolutionPlot a graph showing the variation of photoelectric current with anode potential for two light beam of same wavelength but different intensity.
View SolutionDraw graph showing variation of voltage and current with time over one cycle of ac.for X
View SolutionDraw a plot showing the variation of photoelectric current versus the intensity of incident radiation on a given photosenstive surface.
View SolutionDraw a plot showing the variation of photoelectric current versus the intensity of incident radiation on a given photosenstive surface.
View SolutionDraw a plot showing the variation of photoelectric current versus the intensity of incident radiation on a given photosensitive surface.
View SolutionThe graph of Fig. shows the variation of photoelectric current (I) versus applied voltage (V) for the two different photosensitive materials for two different intensities of the incident radiation. Identify the pairs of curves that correspond to different materials but same intensity of incident radiation.

View SolutionDraw suitable graphs to show the variation of photoelectric current with collector plate potential for
(i) a fixed frequency but different intensities I1>I2>I3 of radiation.
(ii) a fixed intensity but different frequencies v1>v2>v3 of radiation.
View SolutionDraw the graph showing the variation of current with voltage for a p-n junction diode in forward bias as well as revese bias arrangements.
View Solution

