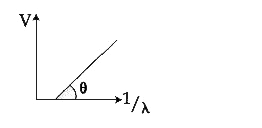
In an experiment on photoelectric effect, a student plots stopping potential against reciprocal of the wavelength of the incident light for two different metals A and B. These are shown in the figure
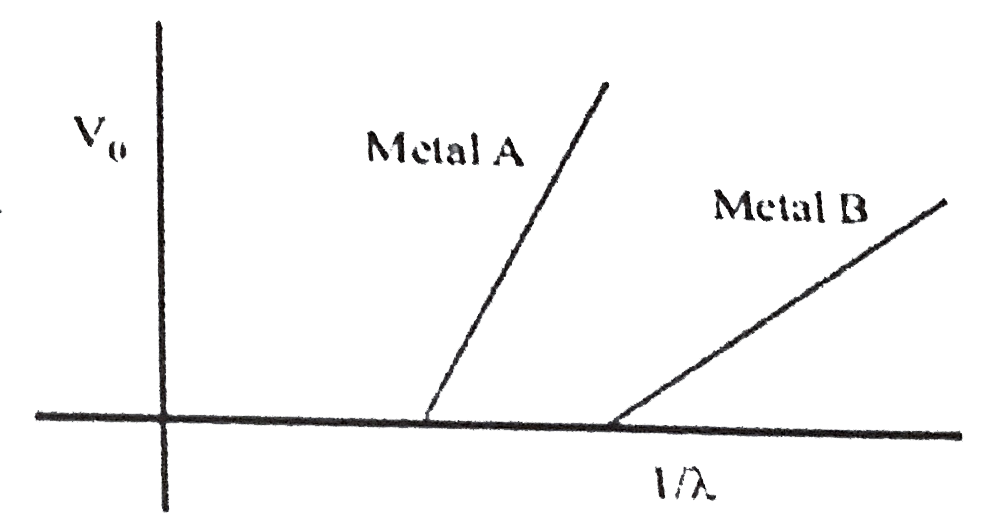
Looking at the graphs, you can most appropriately say that :
The correct Answer is:D
According to Einstein.s photoelectric equation
Topper's Solved these Questions
- PARTICLE NATURE OF LIGHT AND WAVE PARTICLE DUALISMBook:MTG-WBJEEChapter:PARTICLE NATURE OF LIGHT AND WAVE PARTICLE DUALISMExercise:WB JEE PREVIOUS YEARS QUESTIONS
Explore 15 Videos
- OSCILLATIONS AND WAVESBook:MTG-WBJEEChapter:OSCILLATIONS AND WAVESExercise:WB JEE PREVIOUS YEARS QUESTIONS (CATEGORY 3: ONE OR MORE THAN ONE OPTION CORRECT TYPE (2 MARKS))
Explore 2 Videos
- SOLID STATE ELECTRONS Book:MTG-WBJEEChapter:SOLID STATE ELECTRONS Exercise:WB JEE Previous Years Questions (CATEGORY 1 : Single Option Correct Type)
Explore 15 Videos
Similar Questions
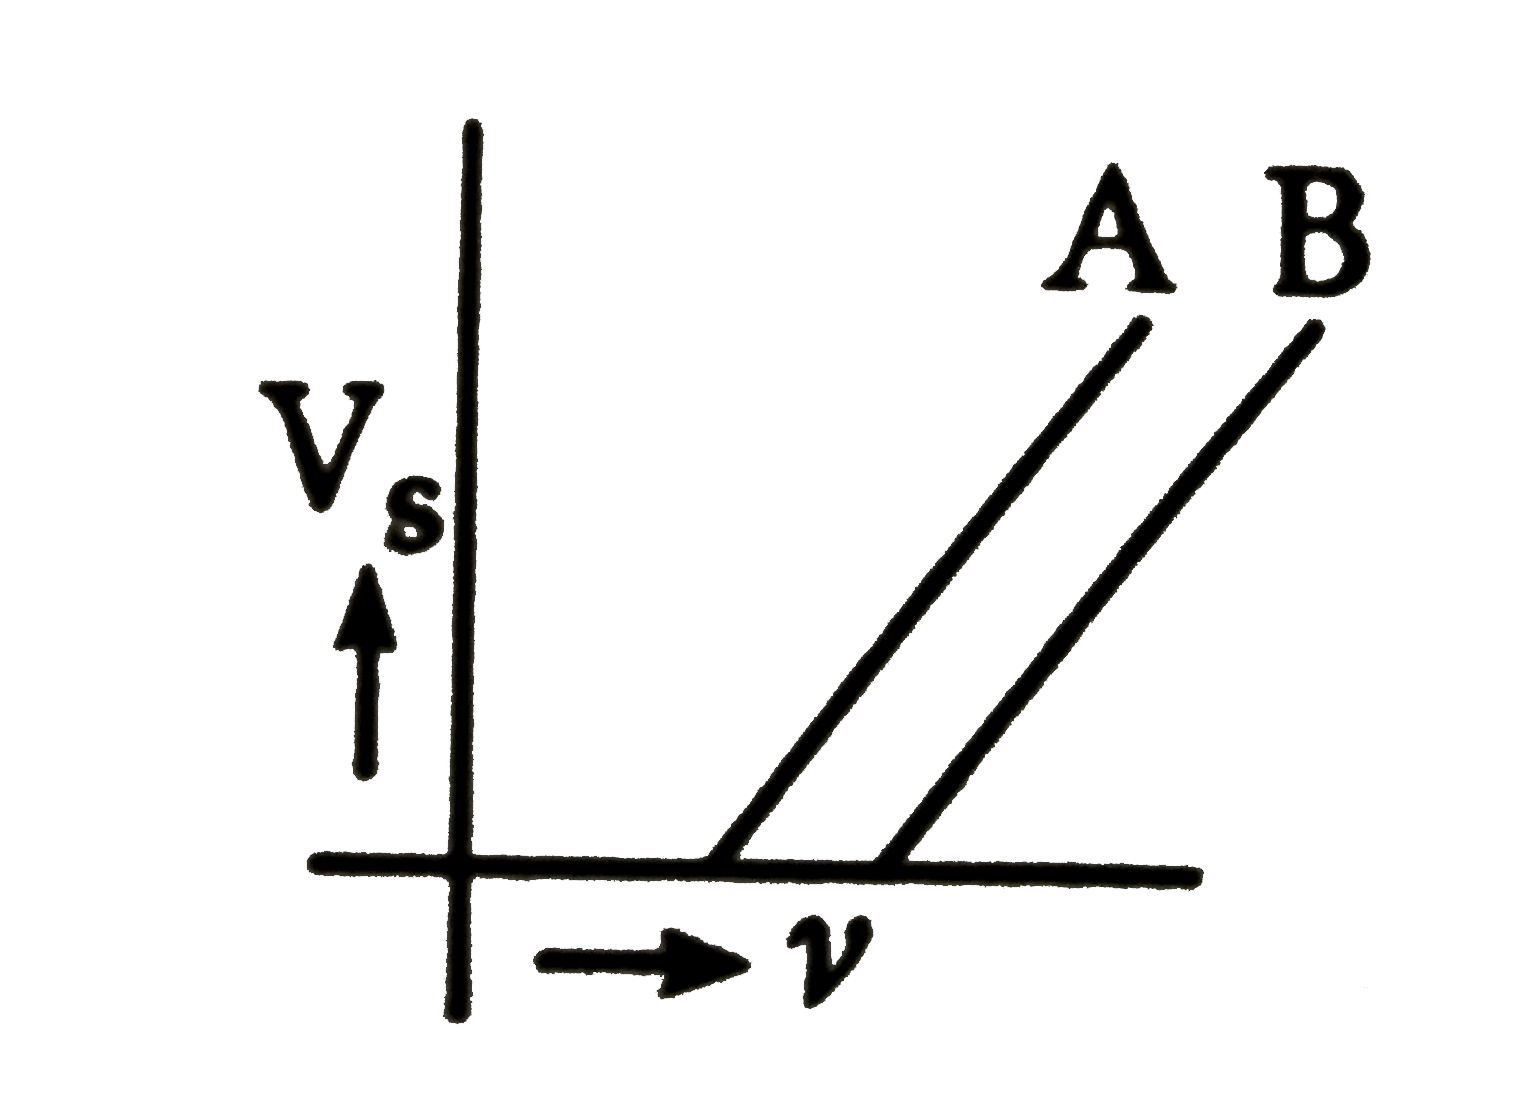
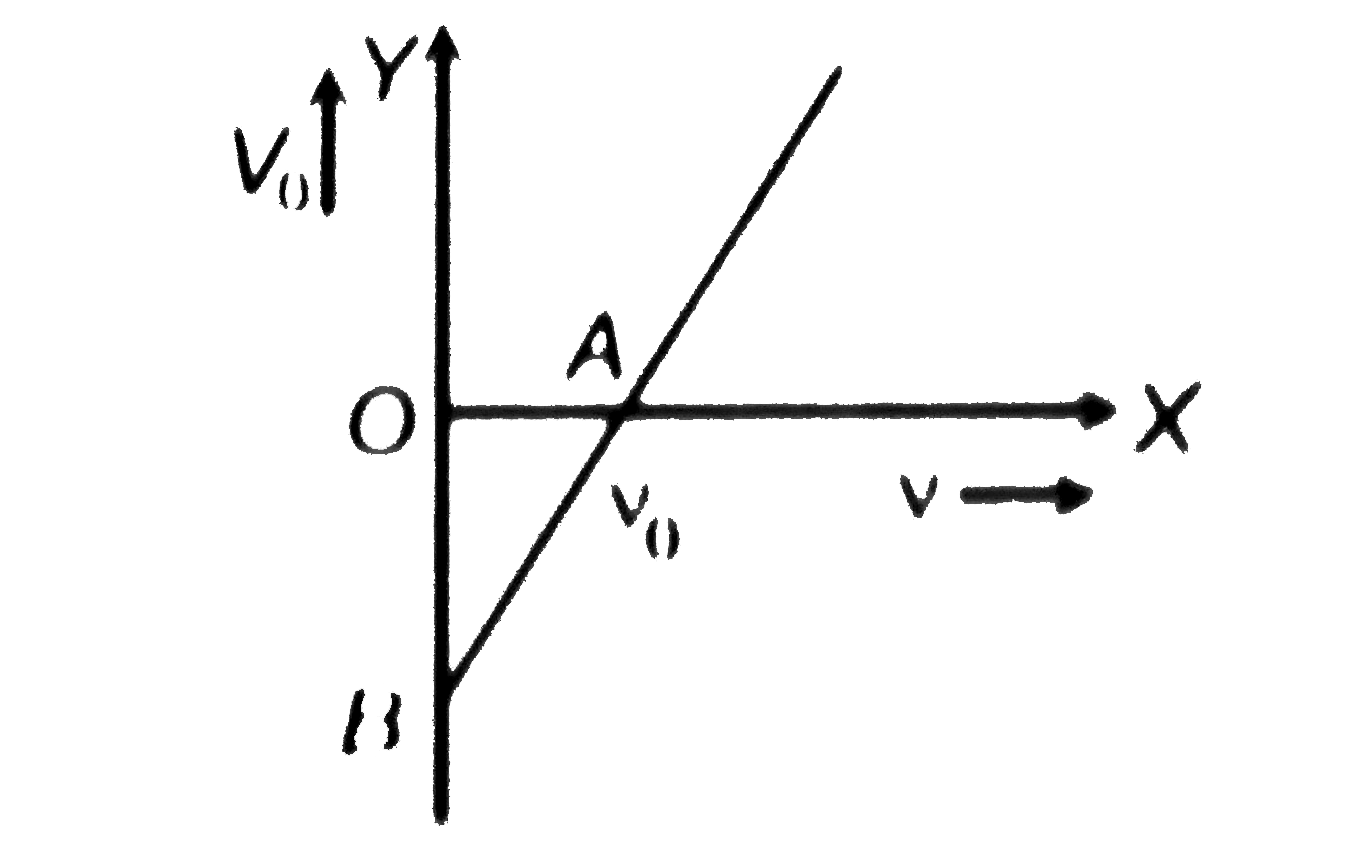
The stopping potential as a function of frequency of incident radiation is plotted for two different photoelectric surfaces A and B . The graphs as shown in figure shows that , the work function of A is
View SolutionIn photoelectric effect the slope of straight line graph between stopping potential (Vs) and frequency of incident light (v) gives
View Solution
Knowledge Check
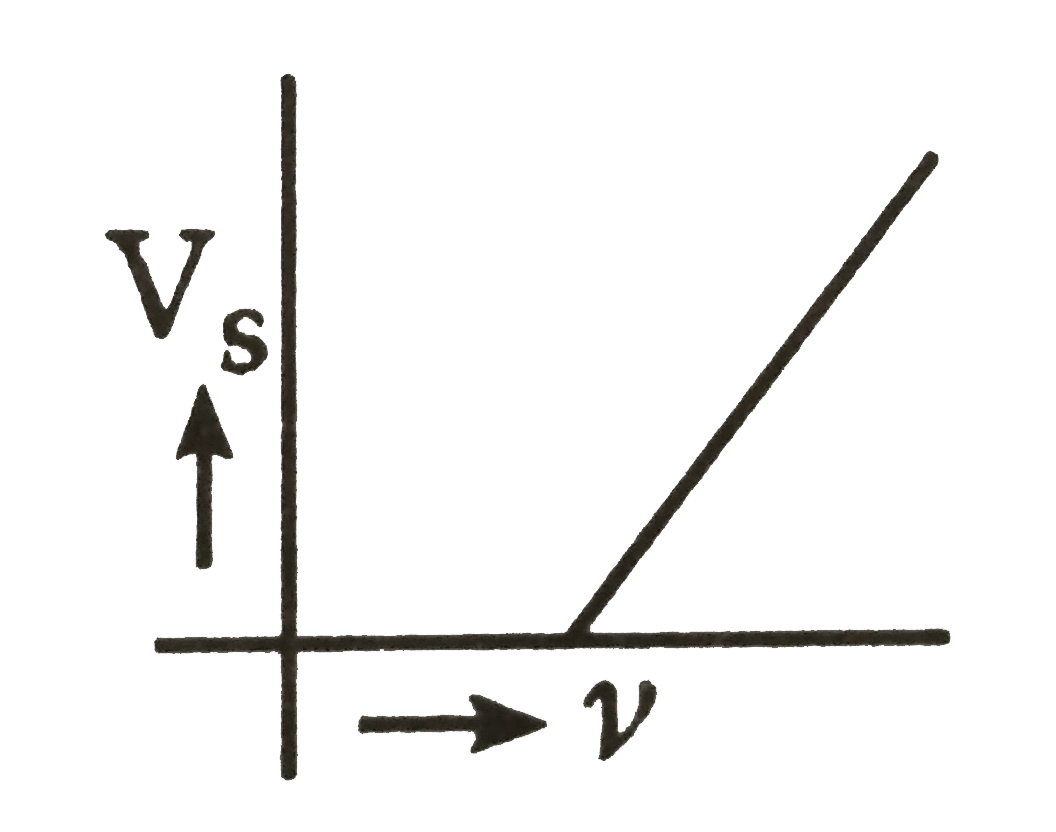
In photoelectric effect the slope of straight line graph between stopping potential (V0) and freqency of incident light (v) gives:
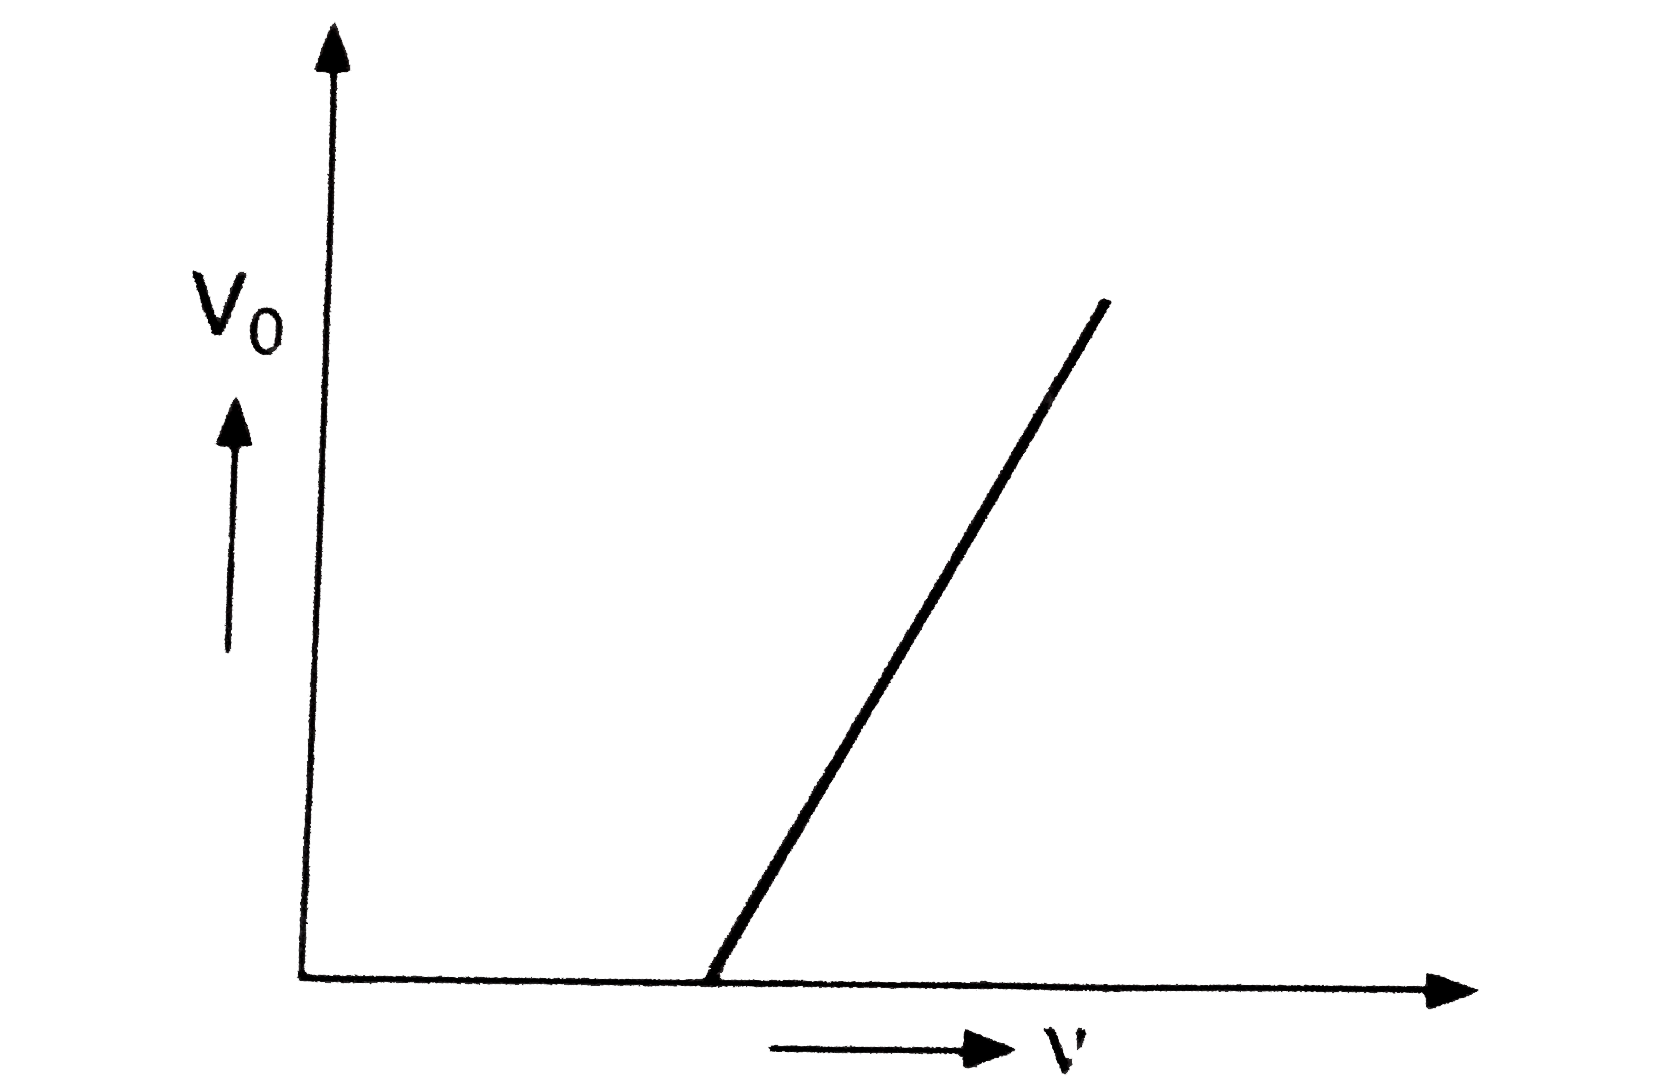 Acharge on electronBwork function of emitterCPlanck's constantDratio of Planck's constant to charge on electron
The stopping potential as a function of the frequency of the incident radiation is plotted for two different photoelectric surfaces A and B . The graphs show that work function of A is
 AGreater than that of BBSmaller than that of BCEqual to that of BDNo inference can be drawn about their work functions from the given graphs
In an experiment of photo electric emission for incident light of 4000A0,the stopping potentail is 2V.If the wavelength of incident light is made 300A0, then the stopping potential will be
ALess than 2 voltBMore than 2 voltC2 voltDzero
In a photoelectric effect experiment, the graph of stopping potential V versus reciprocal of wavelength obtained is shown in the figure. As the intensity of incident radiation is increased :
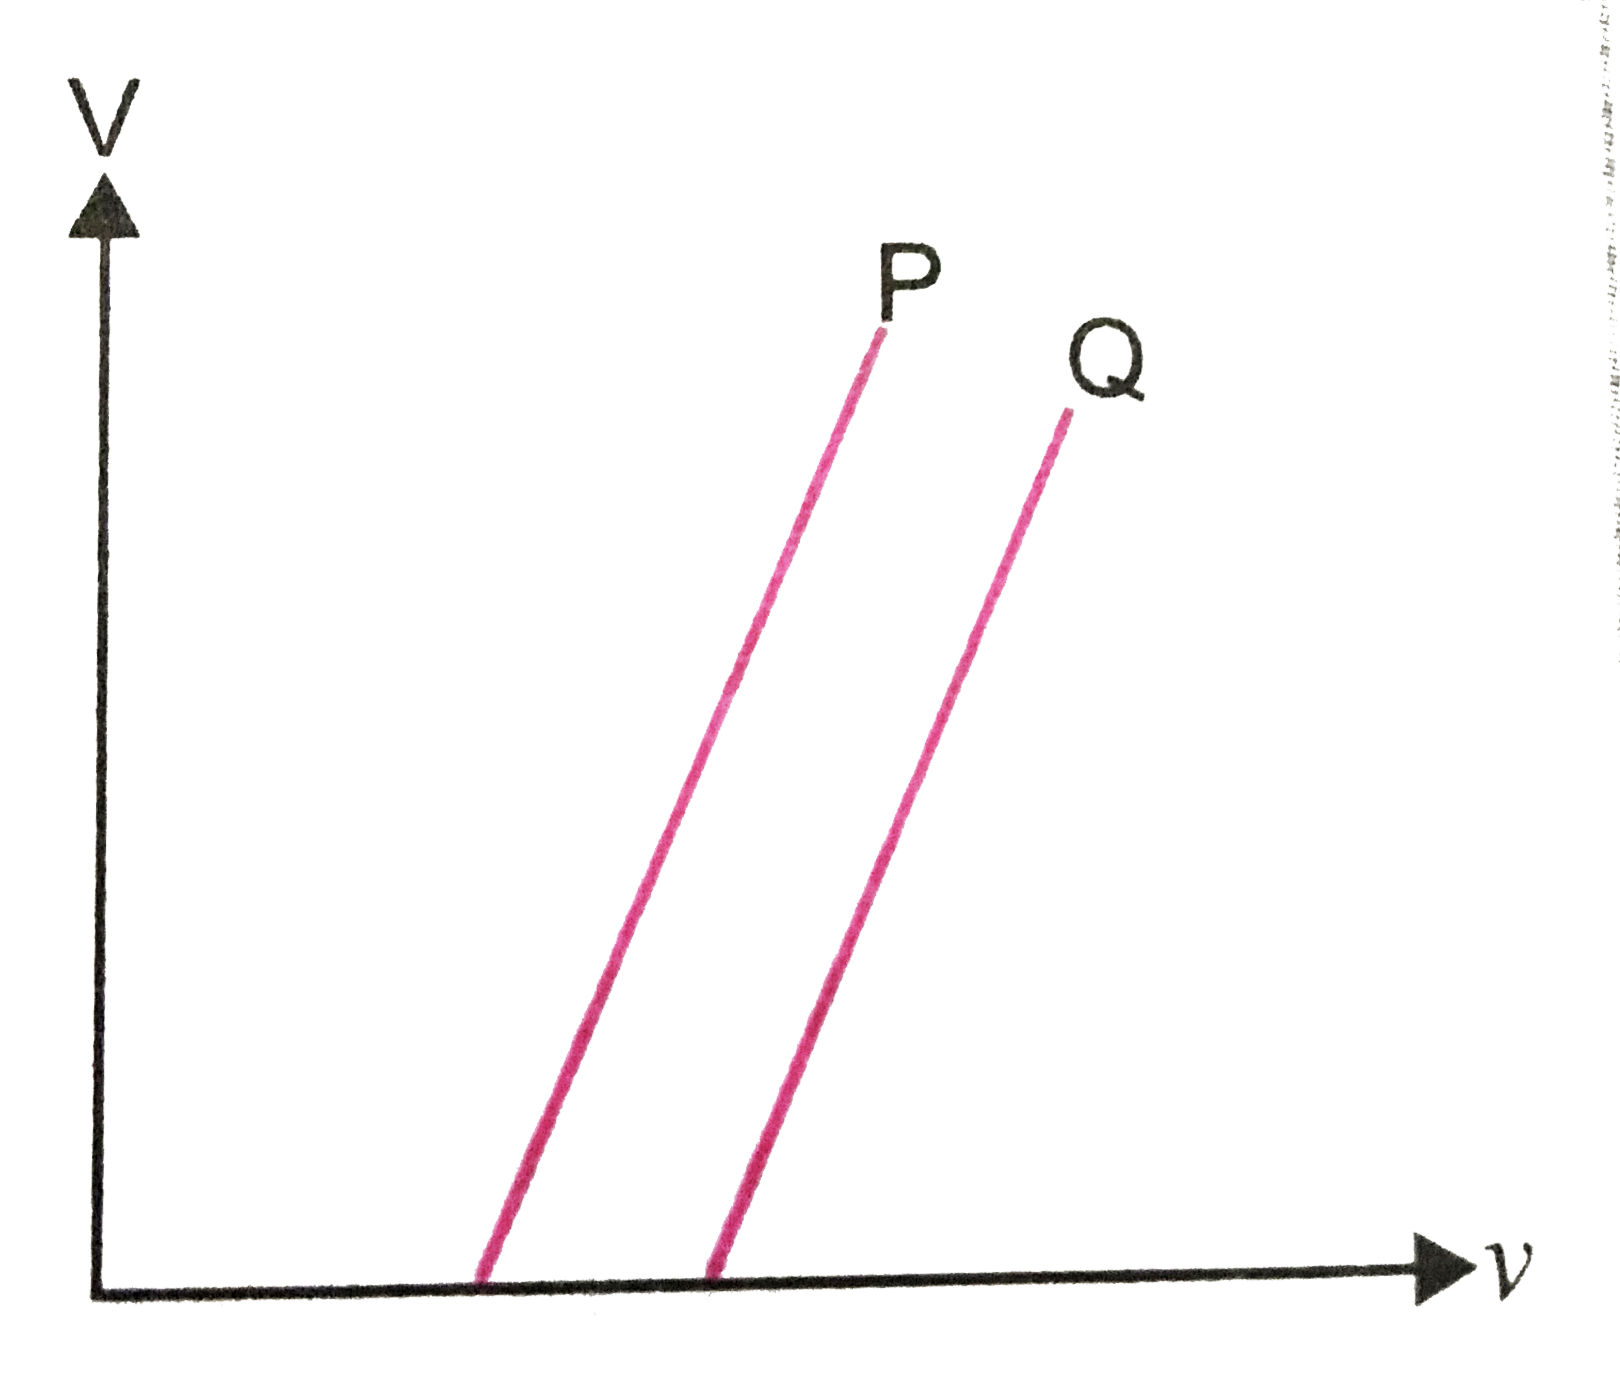
View SolutionIn a photoelectric effect experiment, the graph between the stopping potential (V) and frequency (v) of the incident radiations on two different metal plates P and Q are shown in plates, P and Q has greater value of work function ? (ii) What does the slope of the lines depict?
View SolutionIn an experiment of photoelectric effect the stopping potential was measured to be V1 and V2 with incident light of wavelength λ and λ2, respectively. The relation between V1 and V2 is:
View SolutionThe stopping potential as a function of the frequency of the incident radiation is plotted for two different photoelectric surfaces A and B . The graphs show that work function of A is

View SolutionIn an experiment on photoelectric effect the frequency f of the incident light is plotted against the stopping potential V0. The work function of the metal is given by ( e is the electronic charge)
View Solution
