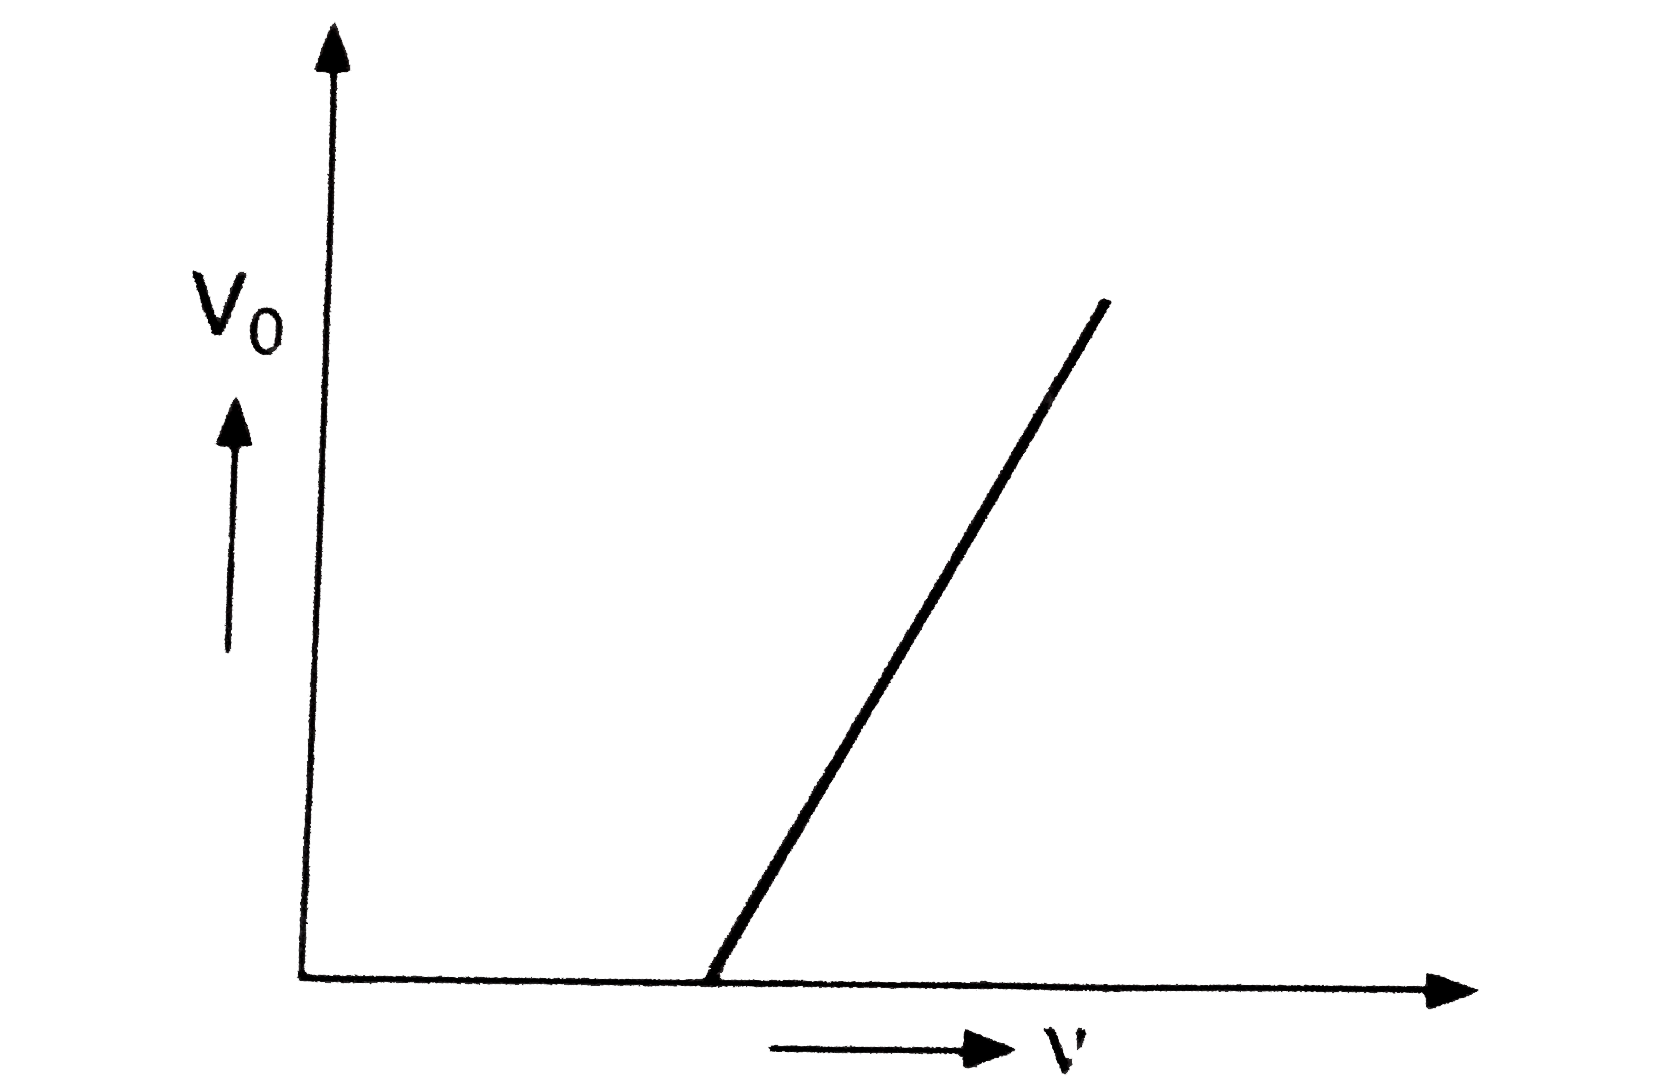
In a photoelectric effect experiment, the graph between the stopping potential (V) and frequency (v) of the incident radiations on two different metal plates P and Q are shown in plates, P and Q has greater value of work function ? (ii) What does the slope of the lines depict?
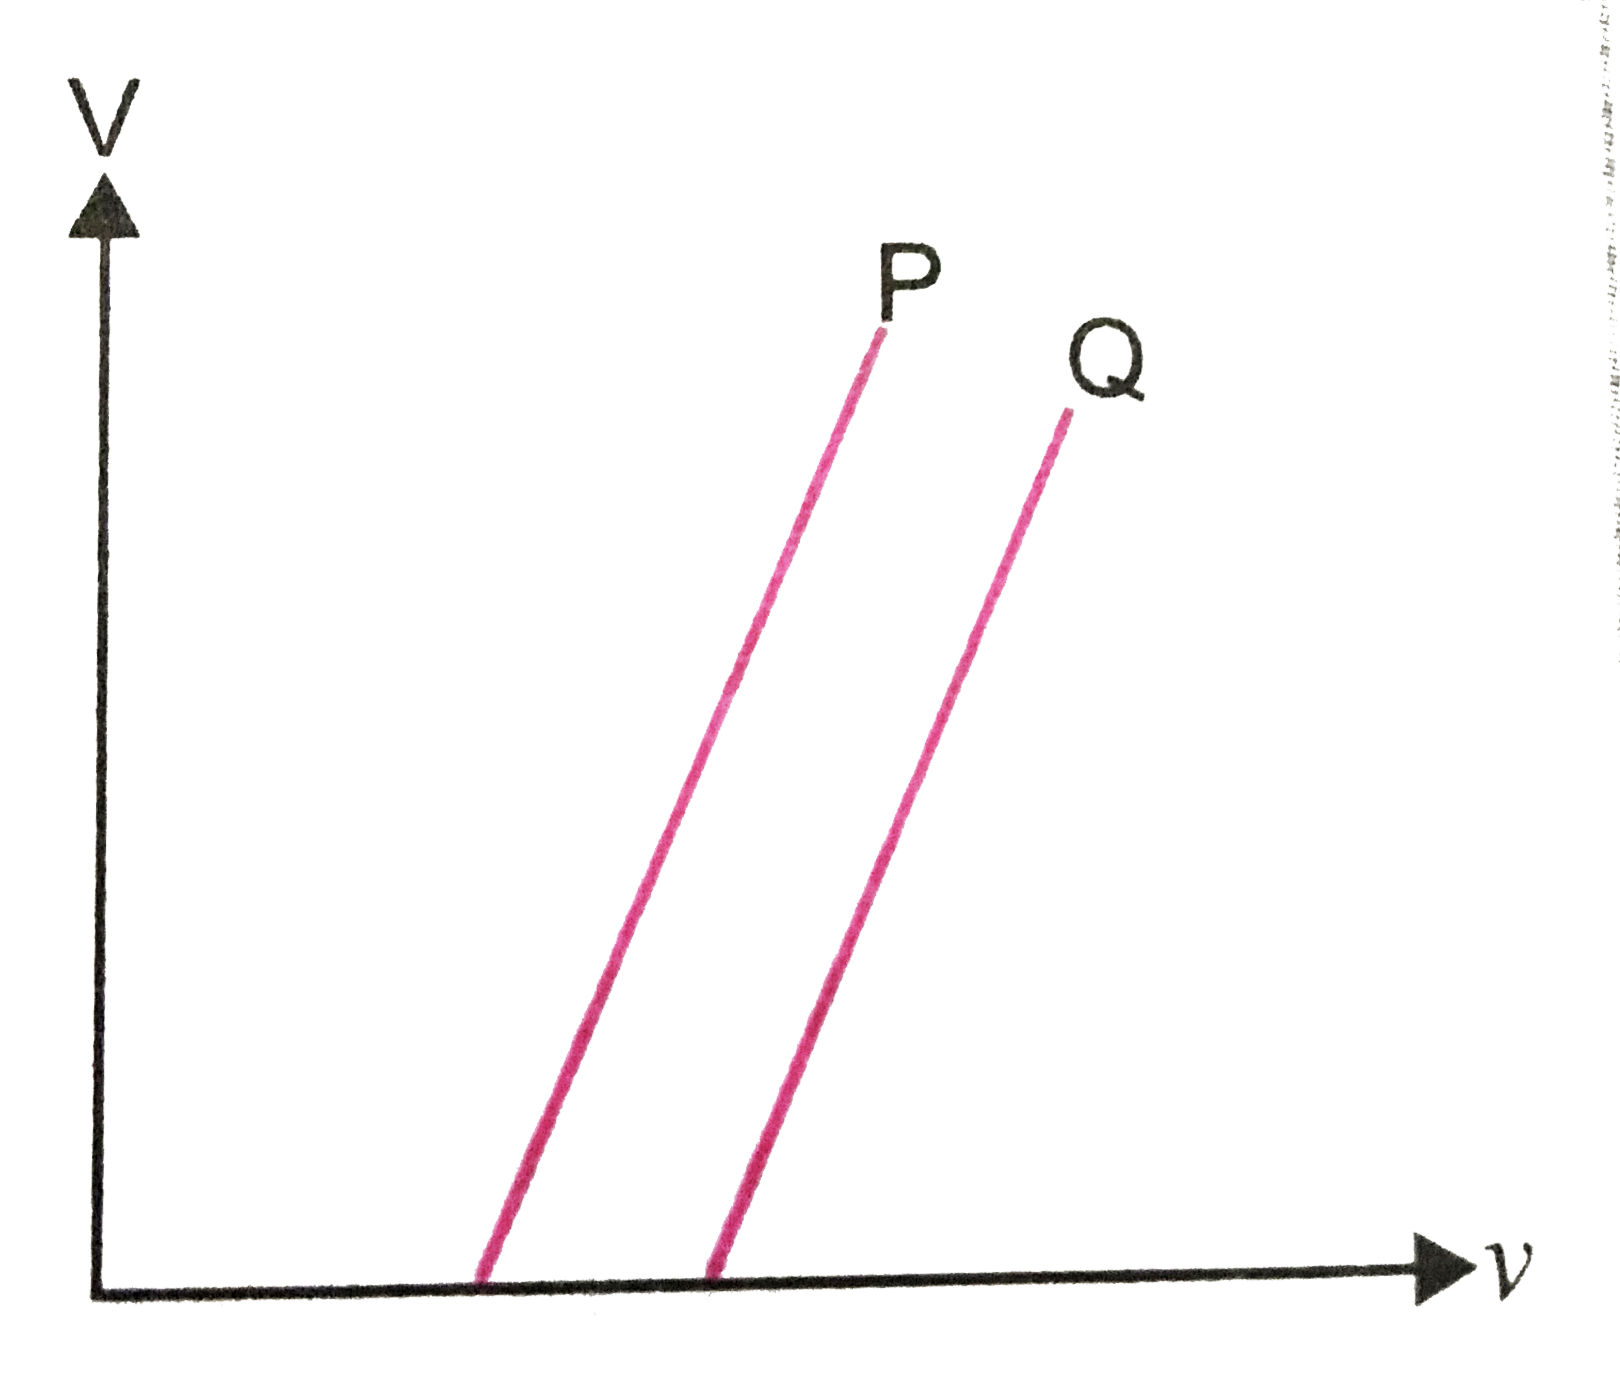
(i) As the threshold frequency is higher for metal Q than that of metal P, hence the work function ϕ0=hv0, is greater for metal Q than that of P.
(ii) eV=hv−ϕ0 or V=hve−ϕ0e
ΔV=heΔvorΔVΔv=he
Slope of the line =ΔVΔv=he
Where h is the planck's constant and e is the electronic charge.
Topper's Solved these Questions
- DUAL NATURE OF RADIATION AND MATTERBook:PRADEEPChapter:DUAL NATURE OF RADIATION AND MATTERExercise:NCERT Exerciese question
Explore 1 Video
- DUAL NATURE OF RADIATION AND MATTERBook:PRADEEPChapter:DUAL NATURE OF RADIATION AND MATTERExercise:Short answer
Explore 1 Video
- CURRENT ELECTRICITYBook:PRADEEPChapter:CURRENT ELECTRICITYExercise:Problems for Practice (B)
Explore 2 Videos
- ELECTROMAGNETIC INDUCTION & ALTERNATING CURRENTBook:PRADEEPChapter:ELECTROMAGNETIC INDUCTION & ALTERNATING CURRENTExercise:Multiple Choice Questions
Explore 1 Video
Similar Questions
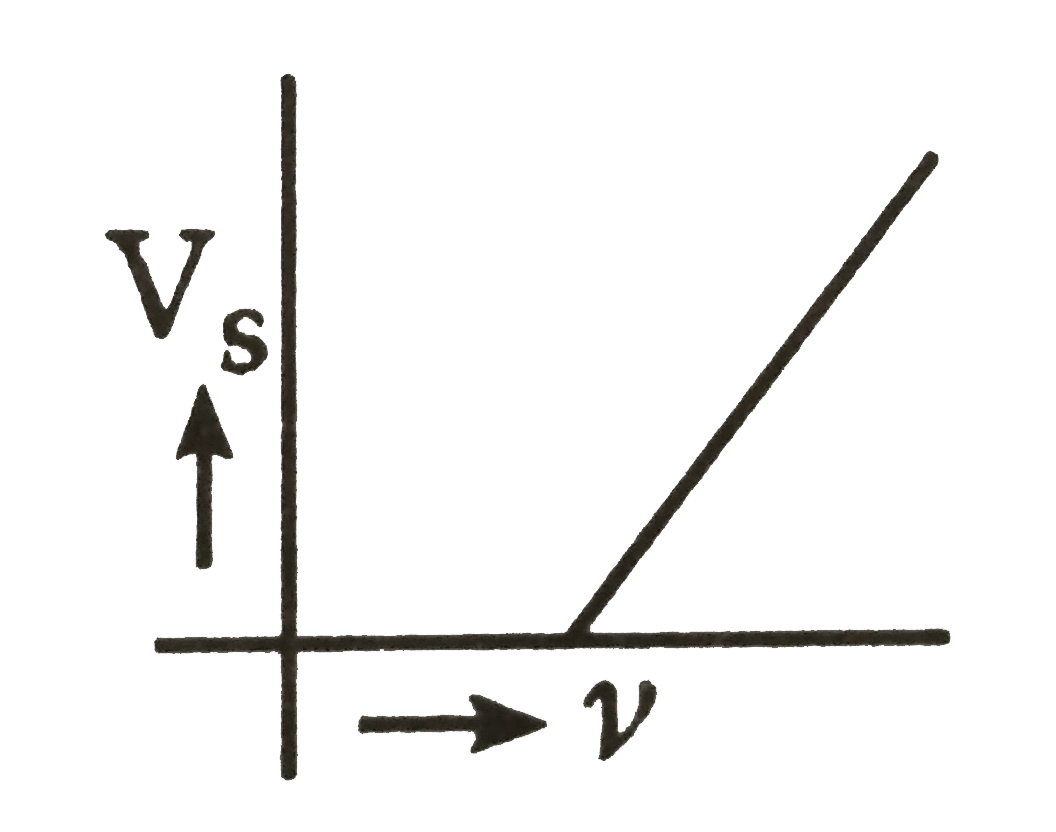
In photoelectric effect the slope of straight line graph between stopping potential (Vs) and frequency of incident light (v) gives
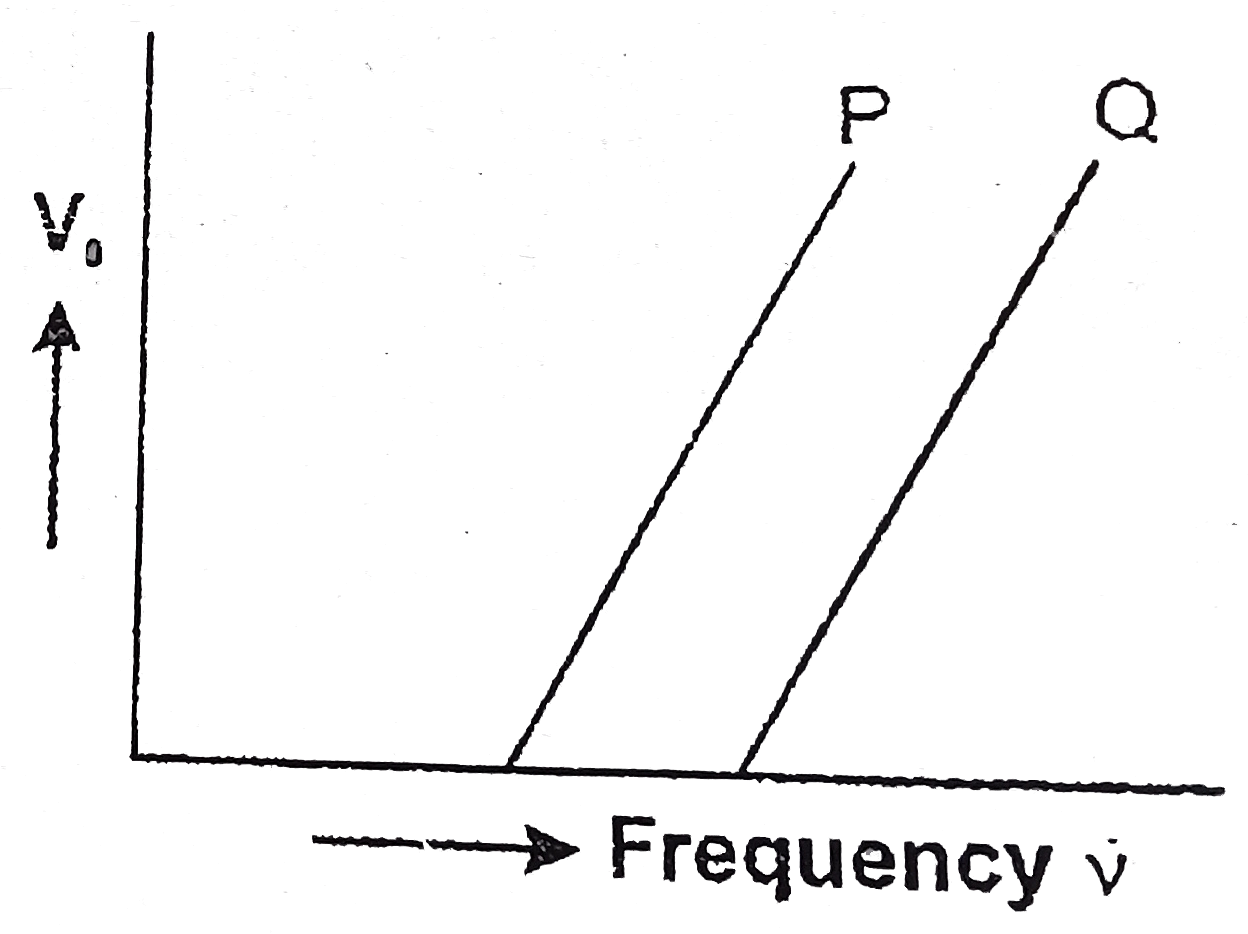
View SolutionThe graph between the stopping potential V0 and frequency v for two different metal plates P and Q are shown in the figure. Which of the metals has greater threshold wavelength and work function.
View Solution
Knowledge Check
In a photoelectric effect experiment, the slope of the graph between the stopping potential and the incident frequency will be :
A1B0.5C10−15D10−34In a photoelectric effect experiment, the slope of the graph between the stopping potential and the incident frequency will be :
A1B0.5C10−15D10−34In photoelectric effect the slope of stop of stopping potential versus frequency of incident light for a given surface will be
A10−14B5×10−14C4×10−15D4×10−34
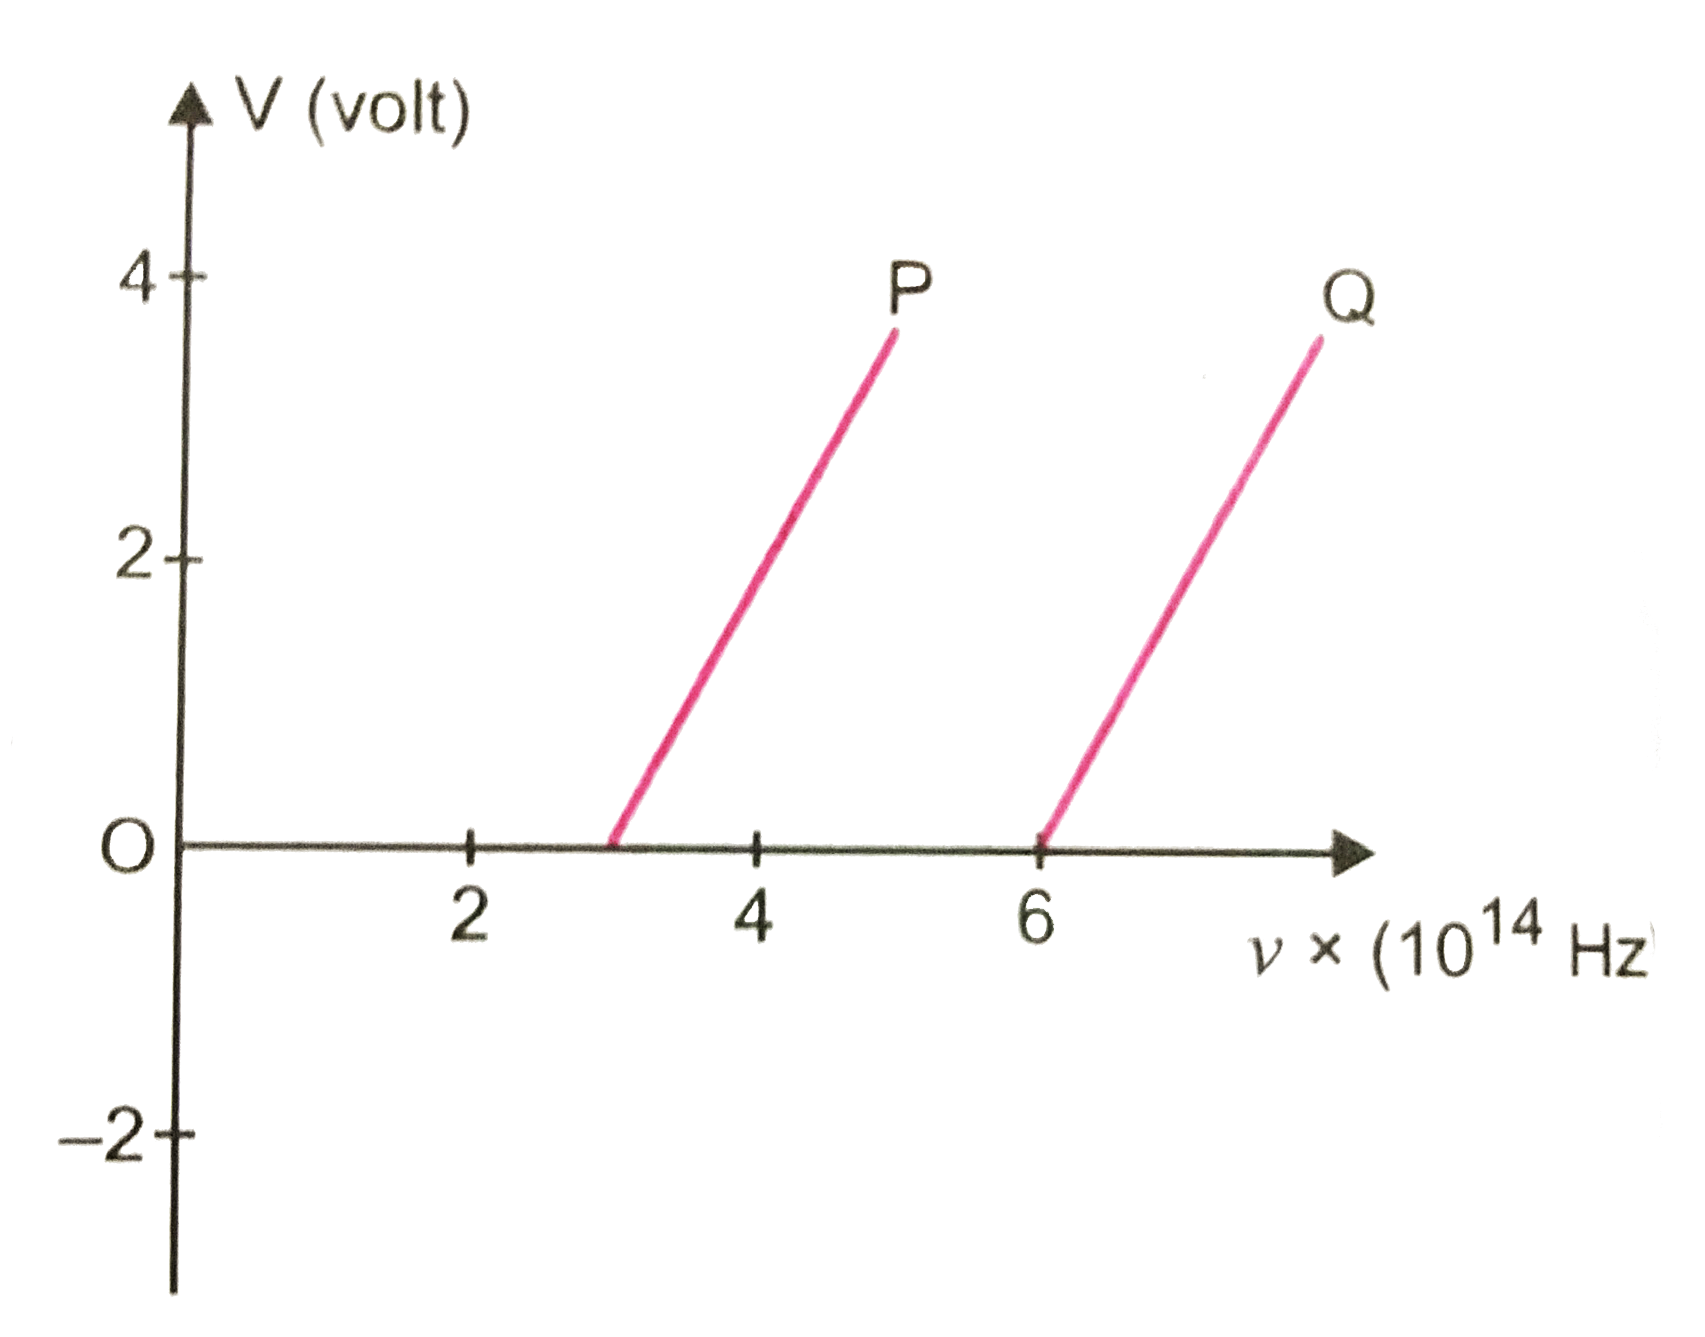
In the study of a photoelectric effect the graph between the stopping potential V and frequency v of the incident radiation on two different metals P and Q is shown in fig.
(i) which one of two metals have higher threshold frequency
(ii) Determine the work function of the metal which has greater value
(iii) Find the maximum kinetic energy of electron emitted by light of frequency 8×10¹⁴Hz for this metal.
View SolutionDefine photoelectric effect. Draw a graph to show the variation of stopping potential with frequency of incident radiation on a metal plate.
View SolutionIn photoelectric effect the slope of straight line graph between stopping potential (V0) and freqency of incident light (v) gives:
View SolutionIn photoelectric effect the slope of straight line graph between stopping potential (Vs) and frequency of incident light (v) gives

View SolutionIn photo electric effect, the slope of the straight line graph between stopping potential and frequency of the incident light gives the ratio of Planck's constant to
View Solution

