A body is thrown vertically upwards. Which one of the following graphs correctly represent the velocity vs time?


The correct Answer is:A
For a body thrown vertically upwards acceleration remains constant (a=−g) and velocity at anytime t is given by V=u−gt During rise velocity decreases linearly and during fall velocity increases linearly and direction is opposite to each other. Hence graph (a) correctly depicts velocity versus time.
Topper's Solved these Questions
- MOTION IN A STRAIGHT LINEBOOK - DISHA PUBLICATIONCHAPTER - MOTION IN A STRAIGHT LINEEXERCISE - Exercise-1
70 Videos
- MOTION IN A STRAIGHT LINEBOOK - DISHA PUBLICATIONCHAPTER - MOTION IN A STRAIGHT LINEEXERCISE - Exercise-2
30 Videos
- MOTION IN A PLANE BOOK - DISHA PUBLICATIONCHAPTER - MOTION IN A PLANE EXERCISE - Exercise -2 : CONCEPT APPLICATOR
28 Videos
- MOVING CHARGES AND MAGNETISM BOOK - DISHA PUBLICATIONCHAPTER - MOVING CHARGES AND MAGNETISM EXERCISE - EXERCISE - 2 : Concept Applicator
25 Videos
Similar Questions
A ball thrown vertically upward with initial velocity u. Which of the following graphs represent the velocity of ball correctly as function of time?
(Take upward direction as positive)
View SolutionA ball is thrown vertically upwards. Which of the following plots represents the speed-time graph of the ball during its height if the air resistance is not ingnored ?
View Solution
Knowledge Check
Which of the following graph is correctly represented?
A B
B C
C D
D
A body nis thrown vertically upward. Which of the following graphs correctly/represents the velocity of the body with time?
A B
B C
C D
D
A ball is thrown vertically upwards. Which of the following graph/graphs represent velocity time graph of the ball during its flight ( air resistance is neglected).
A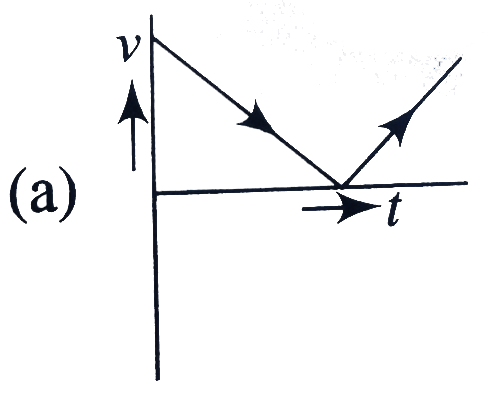 B
B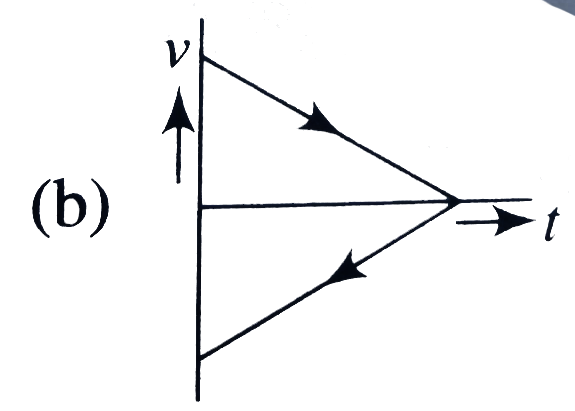 C
C D
D
A ball is thrown vertically upwards. Which of the following plots represent the speed graph of the ball during its flight if the air resistence is not ignored?
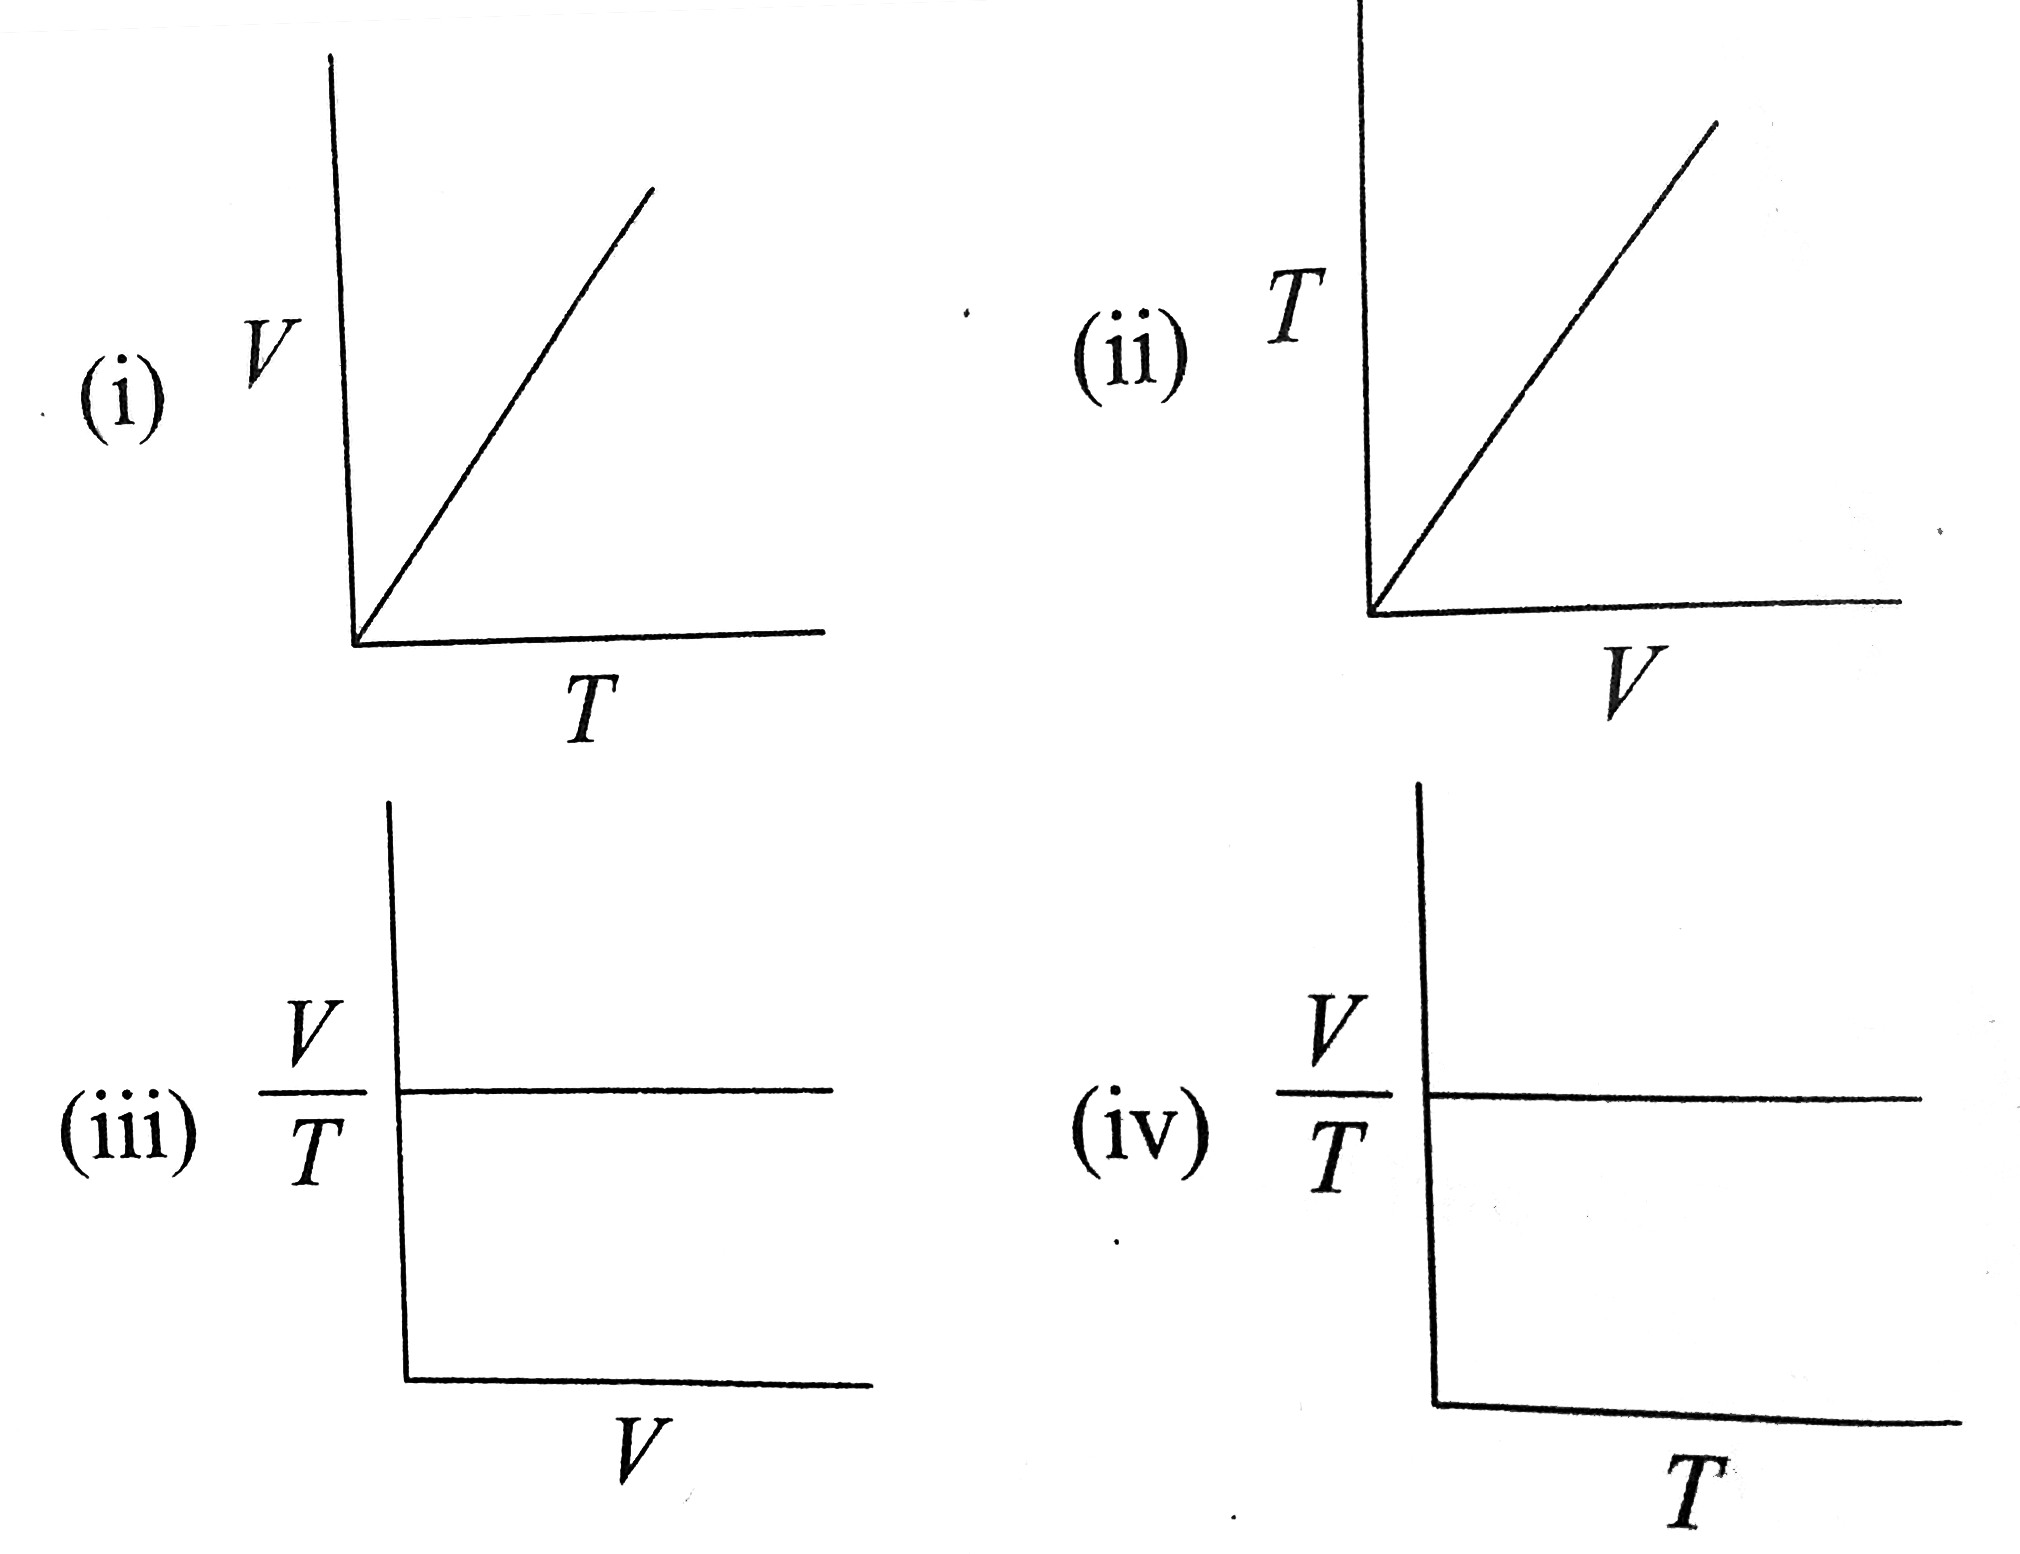
View Solutionwhich of the following graphs represents Charles' law correctly ?
View SolutionThe velocity -displacement graph of a particle is as shown in the figure. Which of the following graphs correctly represents the variation of acceleration with displacement?

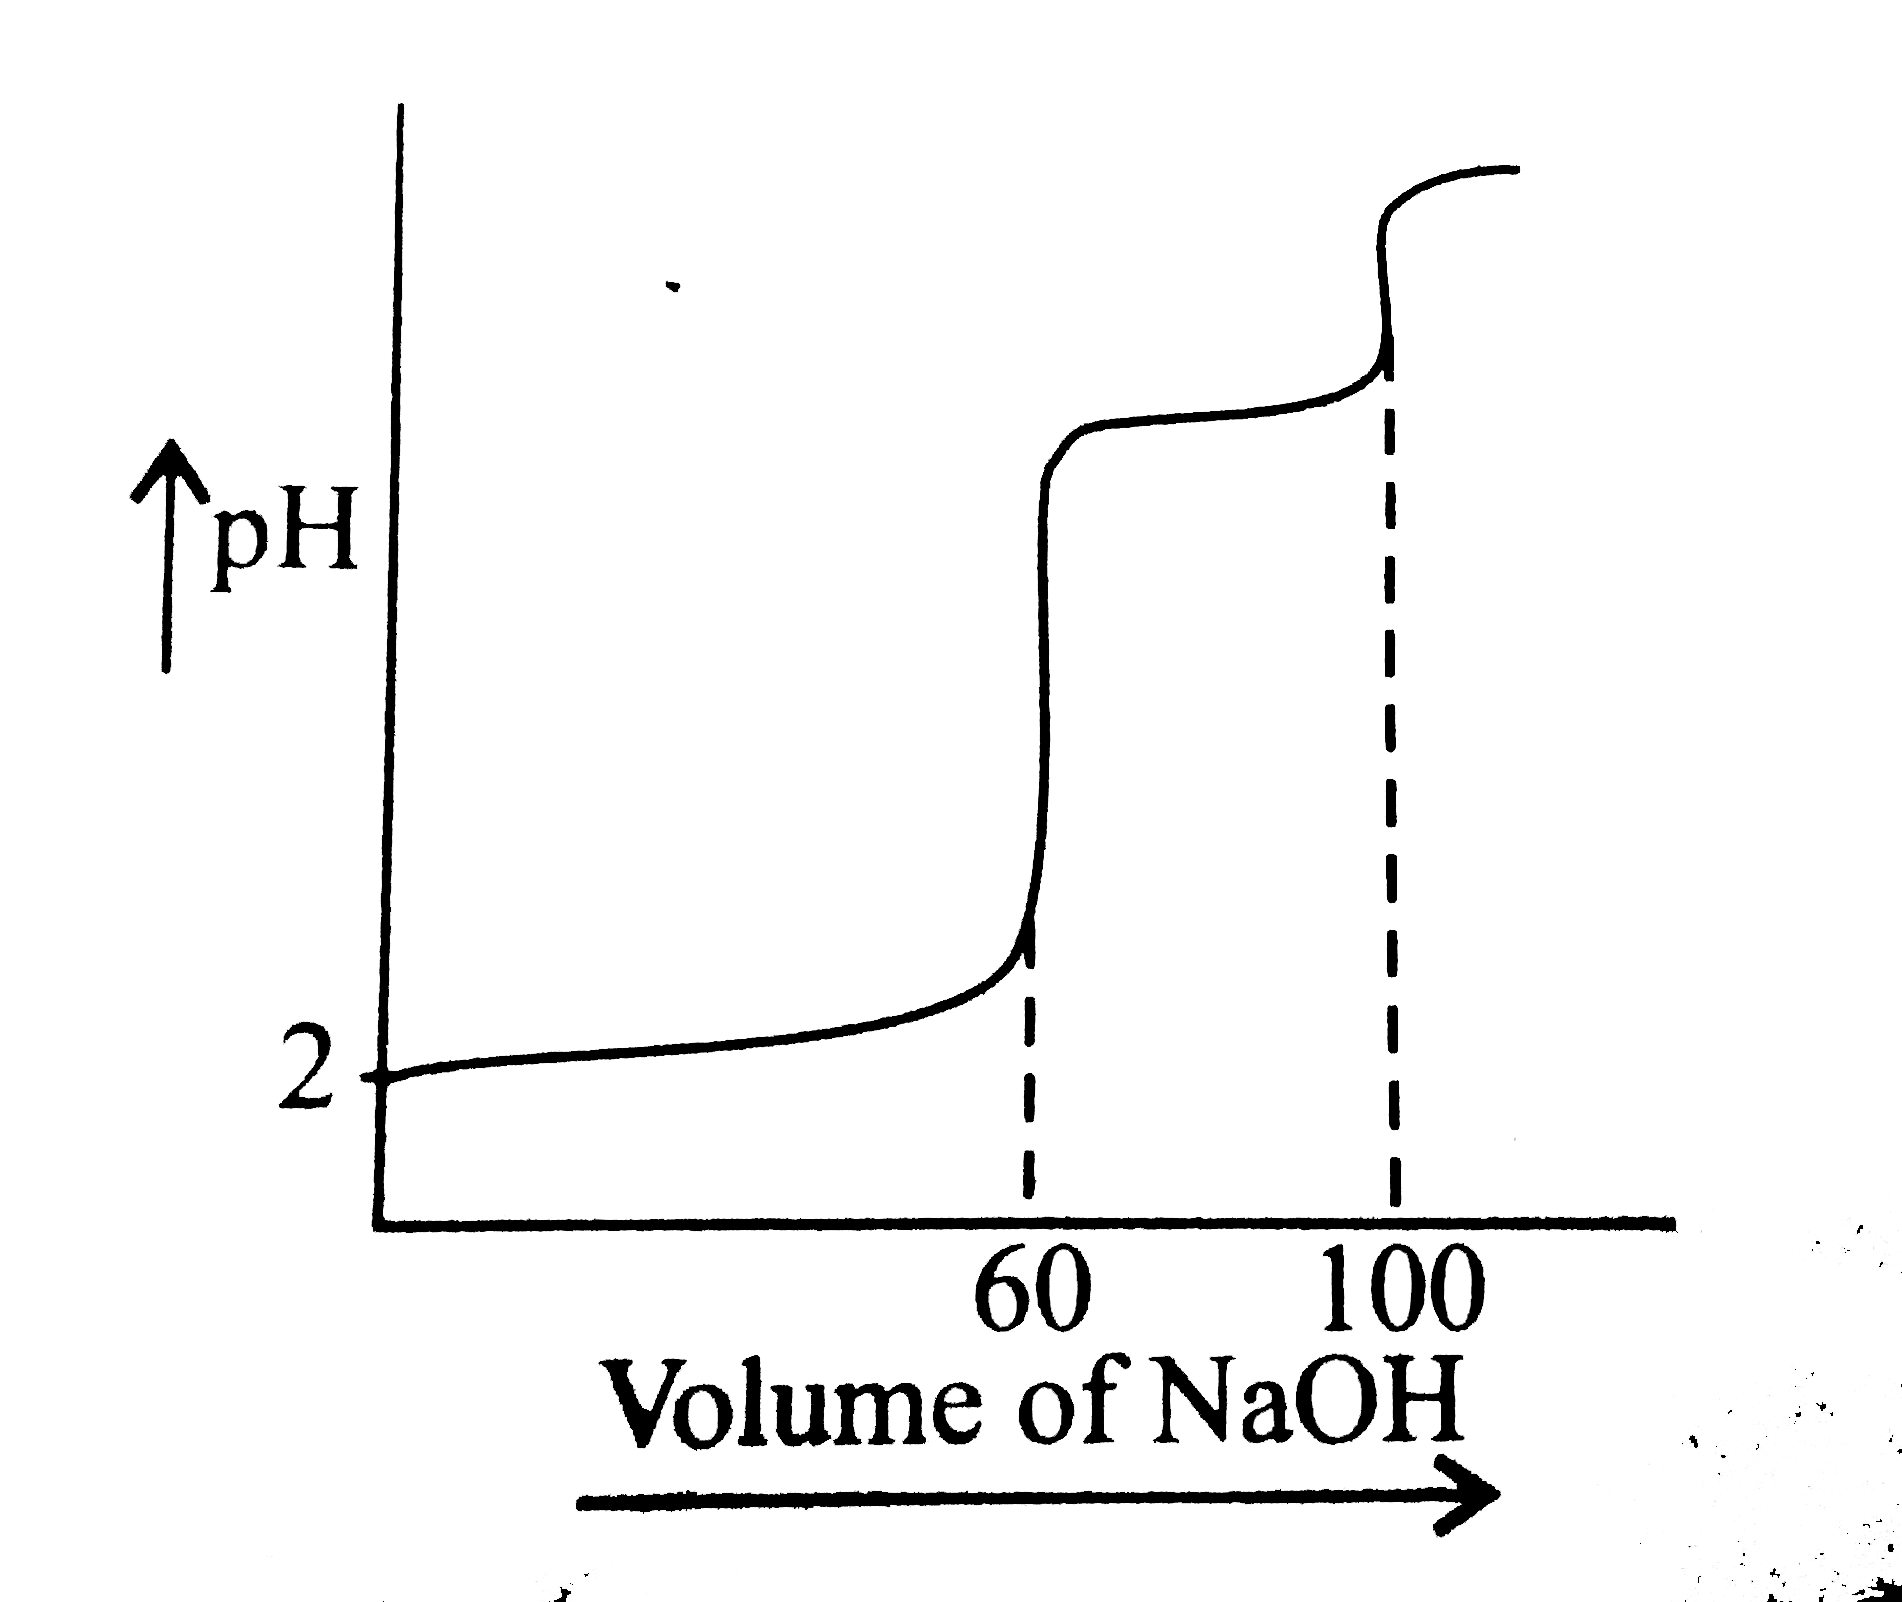
View SolutionThe following graph represents the titration of pH vs volume
View SolutionA particle is thrown vertically upwards with a velocity v. It returns to the ground in time T. which of the following graphs correctly represents the motion ?
View Solution
