Which one of the following graphs shows the variation of magnetic induction B which distance r from a long wire carrying a current ?


The correct Answer is:C
Step by step video, text & image solution for Which one of the following graphs shows the variation of magnetic induction B which distance r from a long wire carrying a current ? by Physics experts to help you in doubts & scoring excellent marks in Class 12 exams.
Updated on:21/07/2023Topper's Solved these Questions
- MAGNETICBook:FIITJEEChapter:MAGNETICExercise:Assignment Problems (Assertion Reasoning Type)
Explore 2 Videos
- MAGNETICBook:FIITJEEChapter:MAGNETICExercise:Assignment Problems (Level - II)
Explore 20 Videos
- MAGNETICBook:FIITJEEChapter:MAGNETICExercise:Assignment Problems (Subjective) (Level - II & III)
Explore 15 Videos
- LAWS OF MOTIONBook:FIITJEEChapter:LAWS OF MOTIONExercise:COMPREHENSION-III
Explore 2 Videos
- MAGNETISMBook:FIITJEEChapter:MAGNETISMExercise:Example
Explore 12 Videos
Similar Questions
Knowledge Check
Which of the following graphs shows the variation of magnetic induction B with distance r from a long wire carrying current
A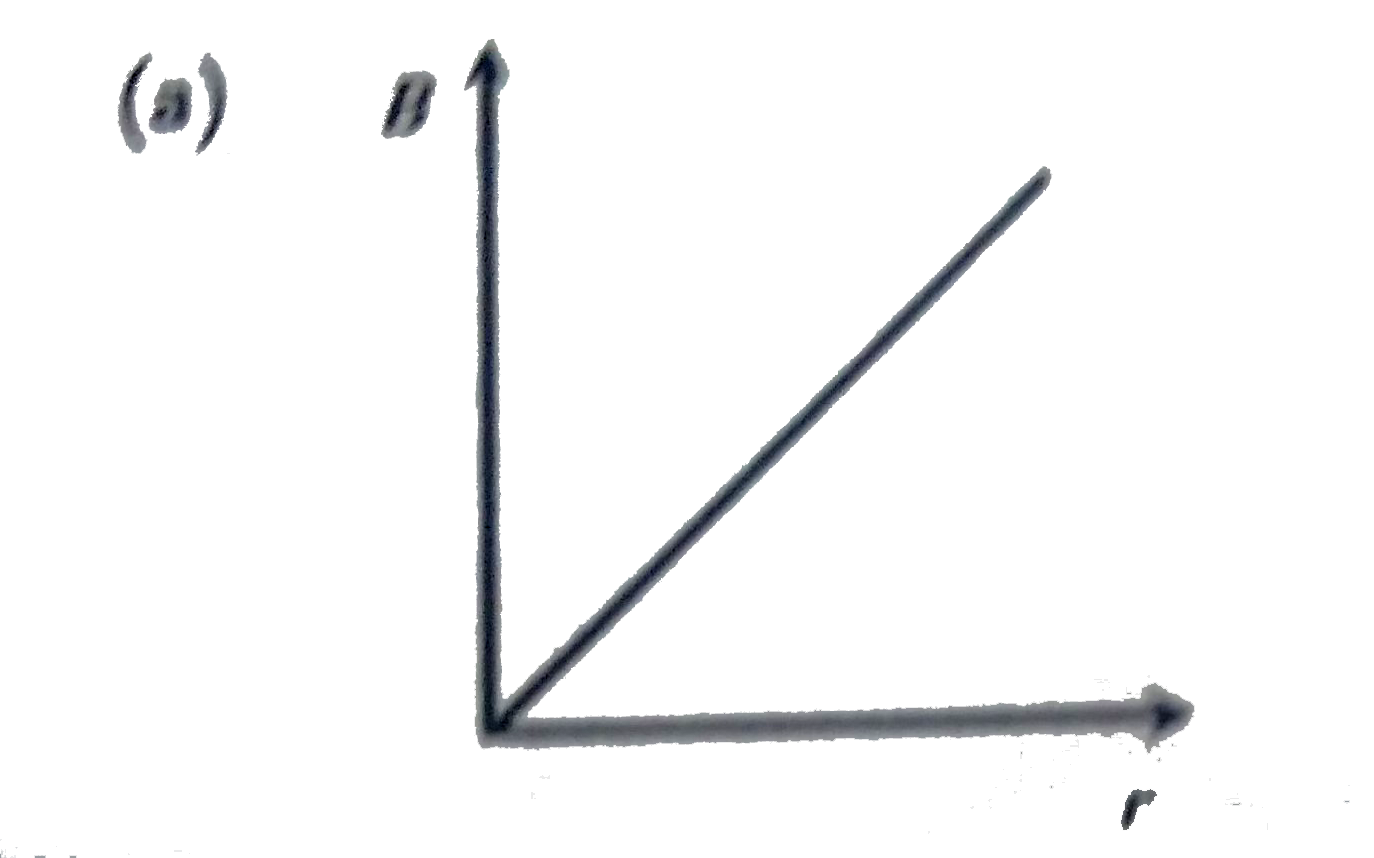 B
B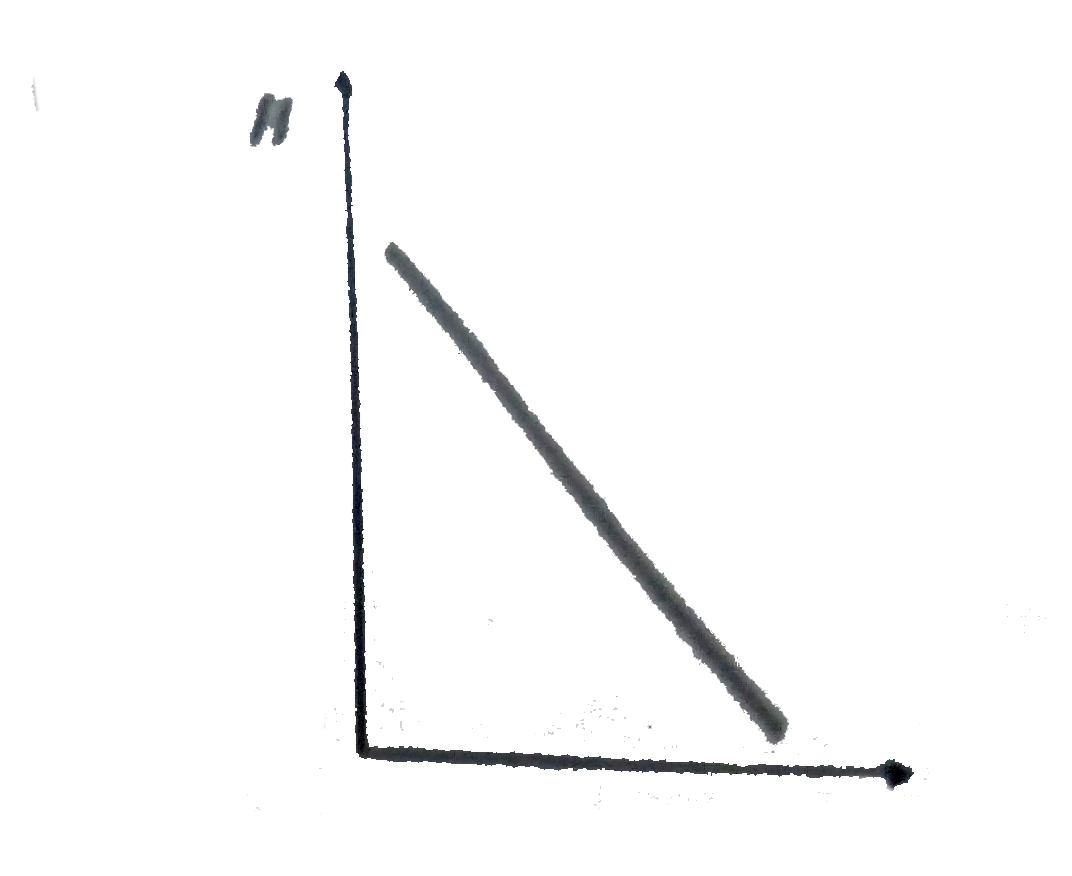 C
C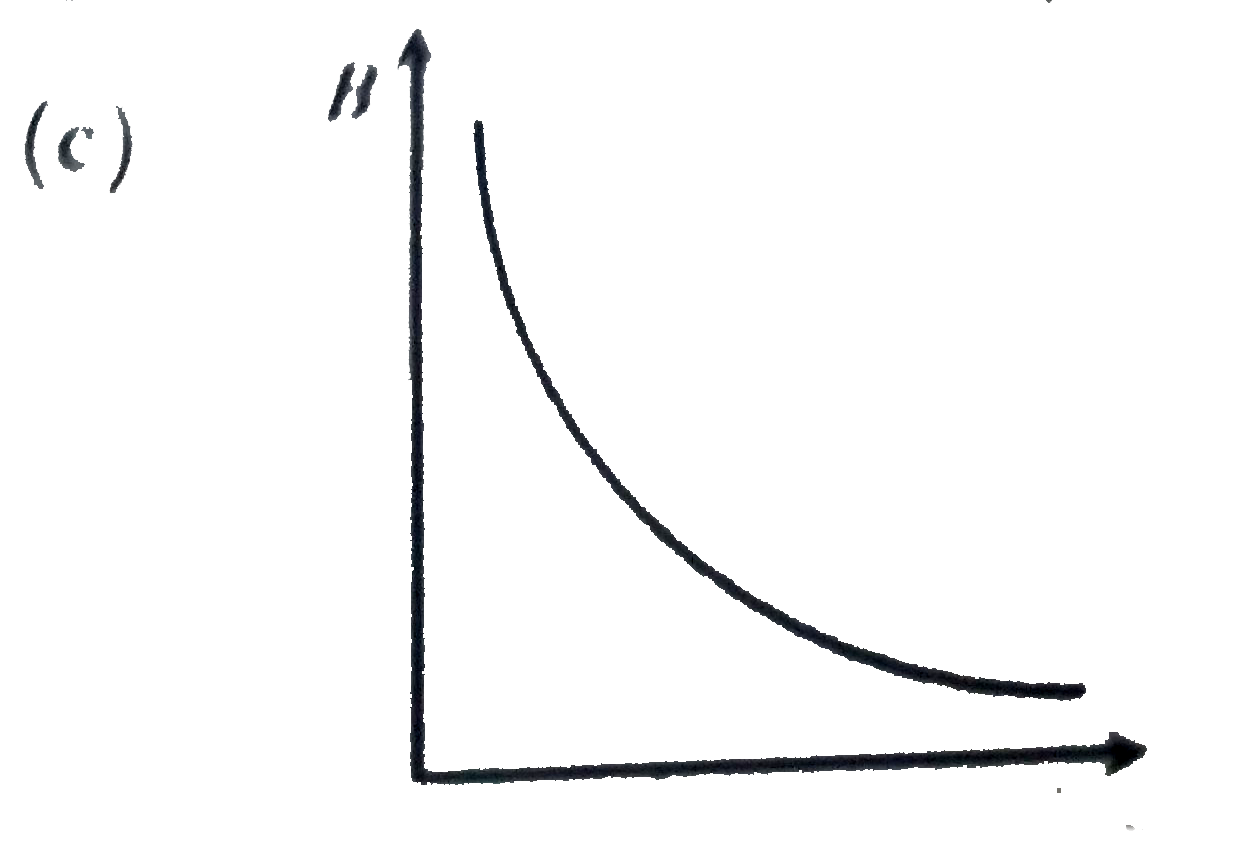 D
D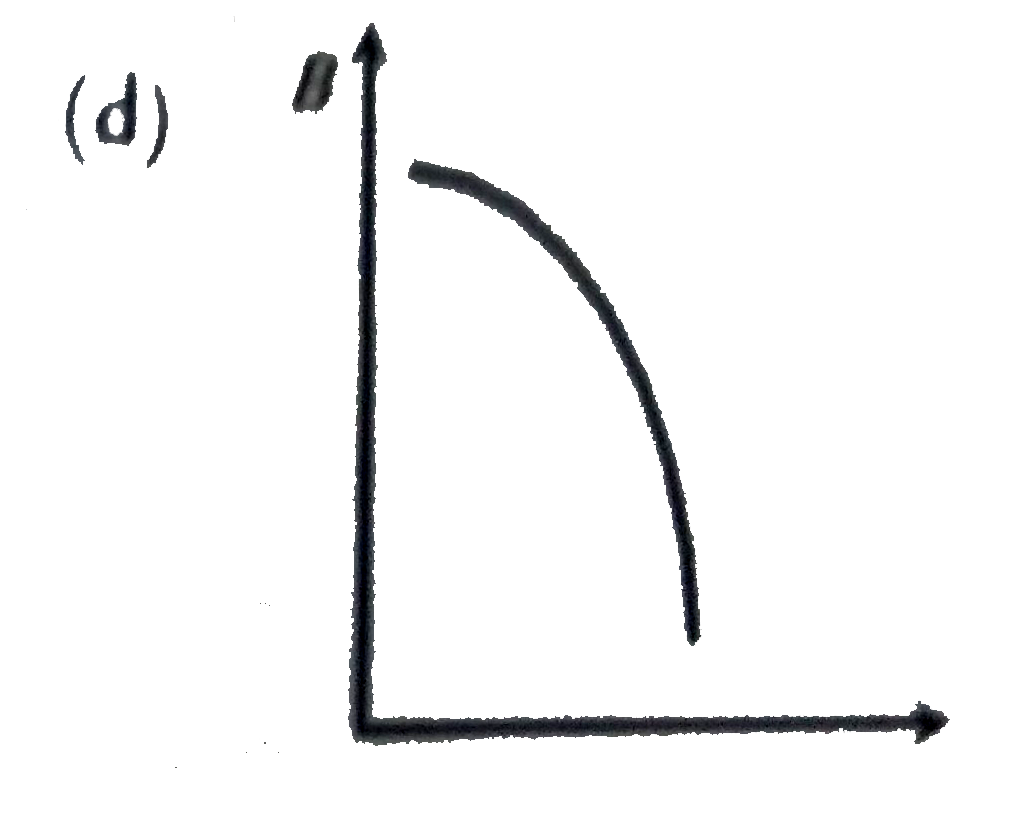
What is the magnetic induction at a distance of 5 cm from a straight wire carrying a current of 5 mA ?
A4×10−8Wb/m2B3×10−8Wb/m2C2×10−8Wb/m2D5.5×10−8Wb/m2Which of the following figure shown the magnetic flux denstiy b at a distance r from a long straight rod carrying a steady current I ?
A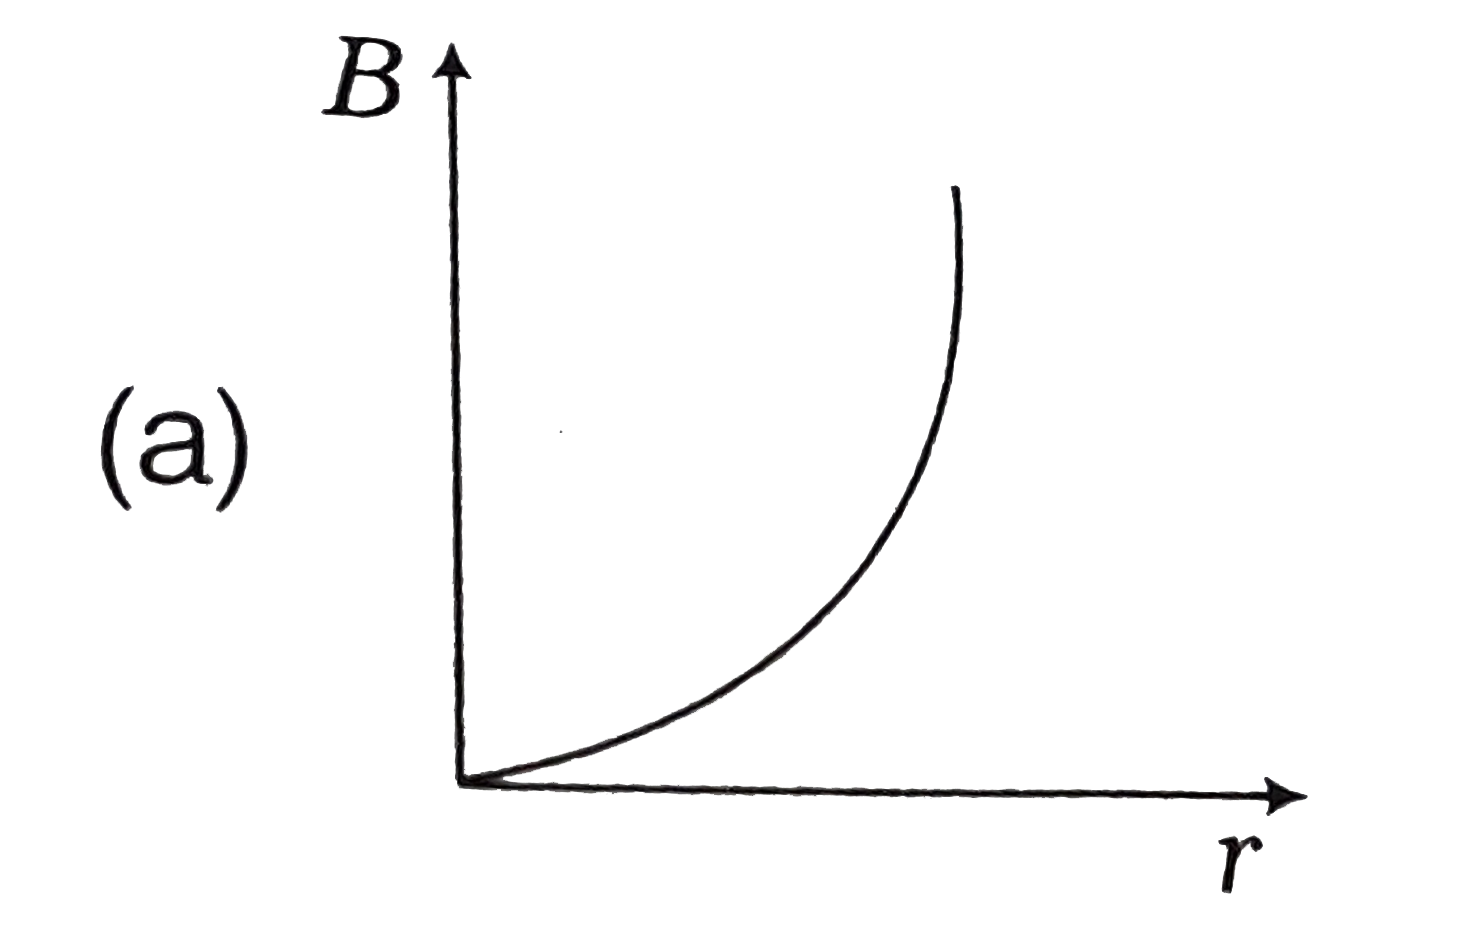 B
B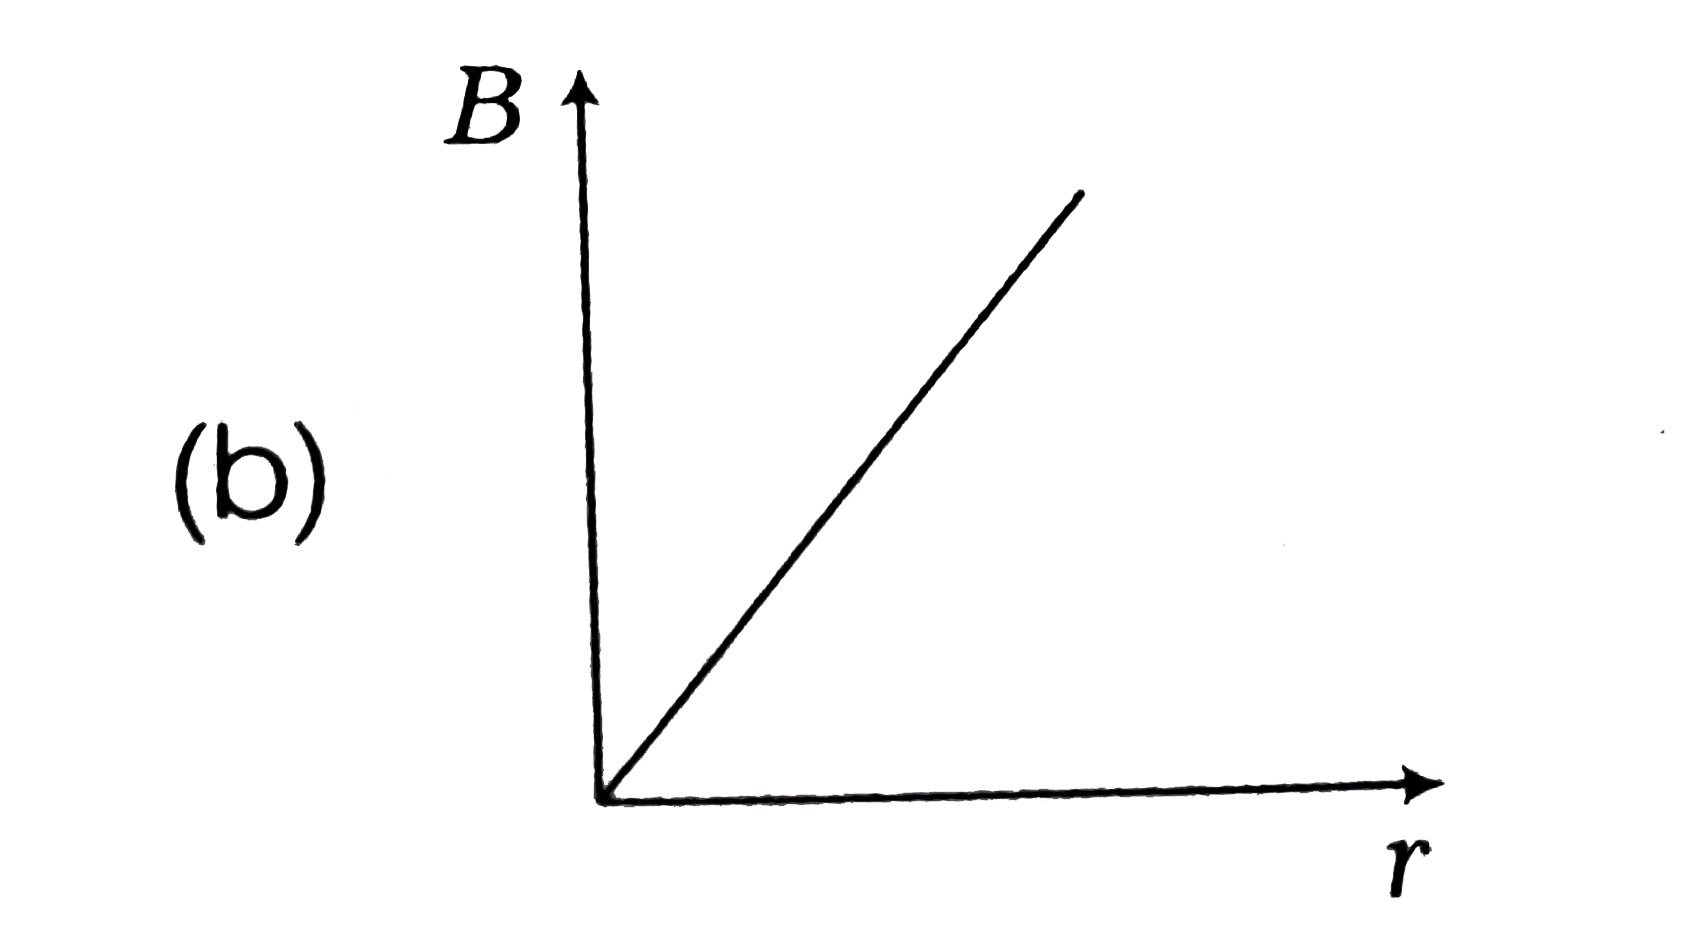 C
C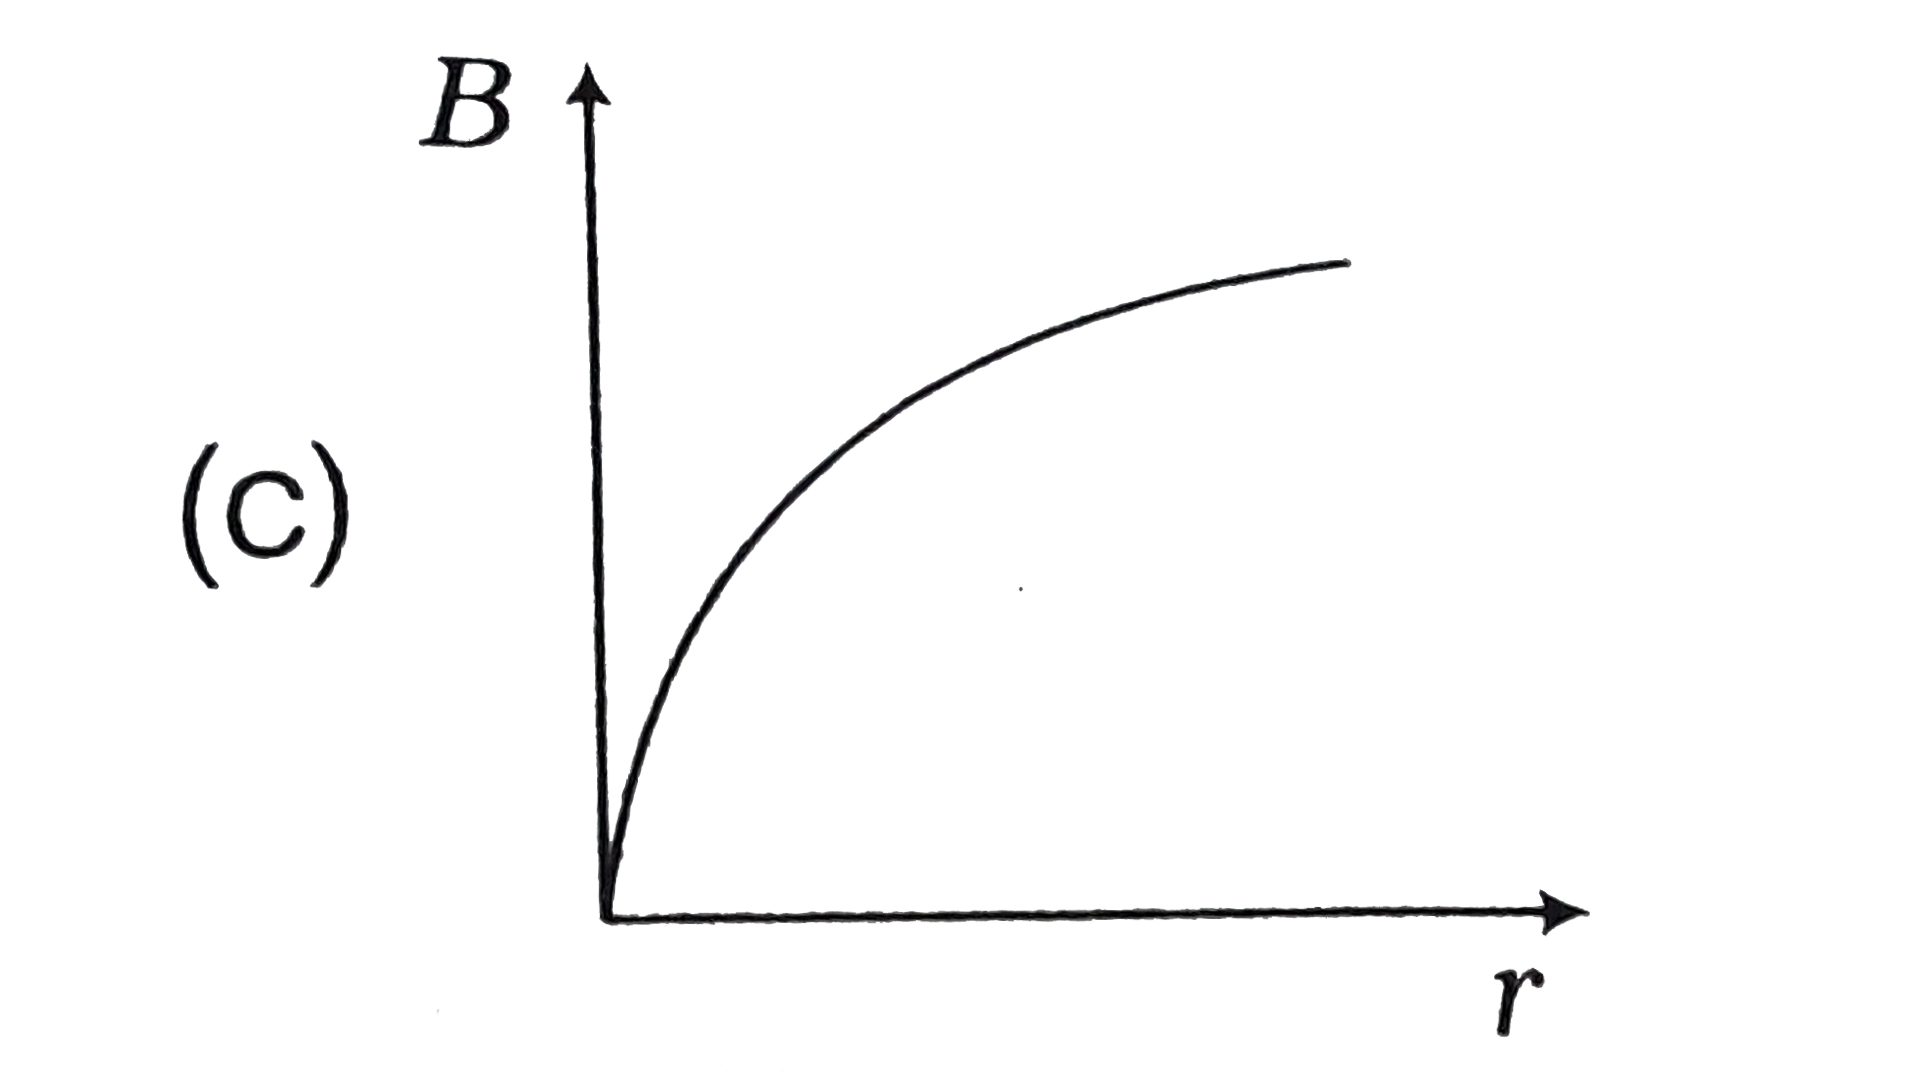 D
D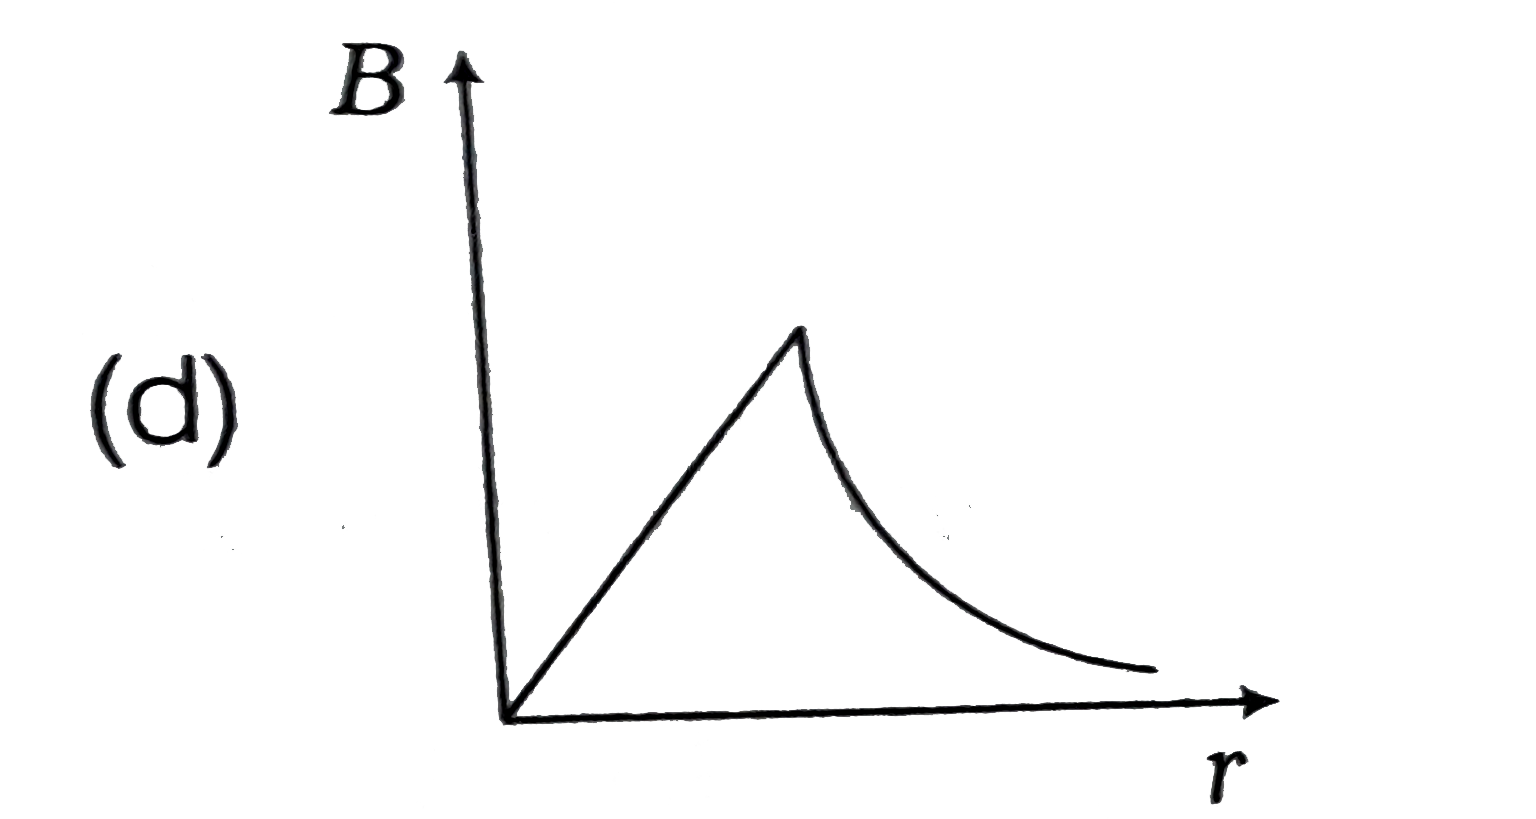
Which one of the following graphs represents the variation of electric field with distance r from the centre of a charged spherical conductor of radius R?
View SolutionCalculate the value of magnetic field at a distance of 2 cm from a very long straight wire carrying a current 5 A
View SolutionVariation of magnetic field with distance from current carrying conductor is:
View SolutionThe magnetic induction at any point due to a long straight wire carrying a current is
View SolutionA long straight wire of a circular cross-section (radius a) carries a steady current I and the current I is uniformly distributed across this cross-section. Which of the following plots represents the variation of magnitude of magnetic field B with distance r from the centre of the wire?
View Solution


