The plots of intensity versus wavelength for three black bodies at temperature T1,T2andT3 respectively are as shown. Their temperatures are such that
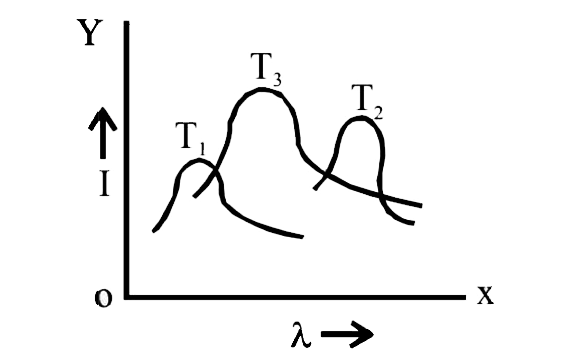
T1>Tk2>T3
T1>T3>T2
T2>T3>T1
T3>T2>T1
The correct Answer is:B
Step by step video, text & image solution for The plots of intensity versus wavelength for three black bodies at temperature T_1,T_2 and T_3 respectively are as shown. Their temperatures are such that by Physics experts to help you in doubts & scoring excellent marks in Class 12 exams.
Updated on:21/07/2023Topper's Solved these Questions
- HEAT AND TEMPERATUREBook:FIITJEEChapter:HEAT AND TEMPERATUREExercise:ASSIGNMENT PROBLEMS (OBJECTIVE) (LEVEL-I) (ASSERTION AND REASON)
Explore 2 Videos
- HEAT AND TEMPERATUREBook:FIITJEEChapter:HEAT AND TEMPERATUREExercise:ASSIGNMENT PROBLEMS (OBJECTIVE) (LEVEL II)
Explore 20 Videos
- HEAT AND TEMPERATUREBook:FIITJEEChapter:HEAT AND TEMPERATUREExercise:ASSIGNMENT PROBLEMS (SUBJECTIVE) (LEVEL II AND III)
Explore 15 Videos
- GRAVITATIONBook:FIITJEEChapter:GRAVITATIONExercise:Numerical based Question
Explore 2 Videos
- KINEMATICSBook:FIITJEEChapter:KINEMATICSExercise:NUMERICAL BASED QUESTIONS DECIMAL TYPE
Explore 5 Videos
Similar Questions
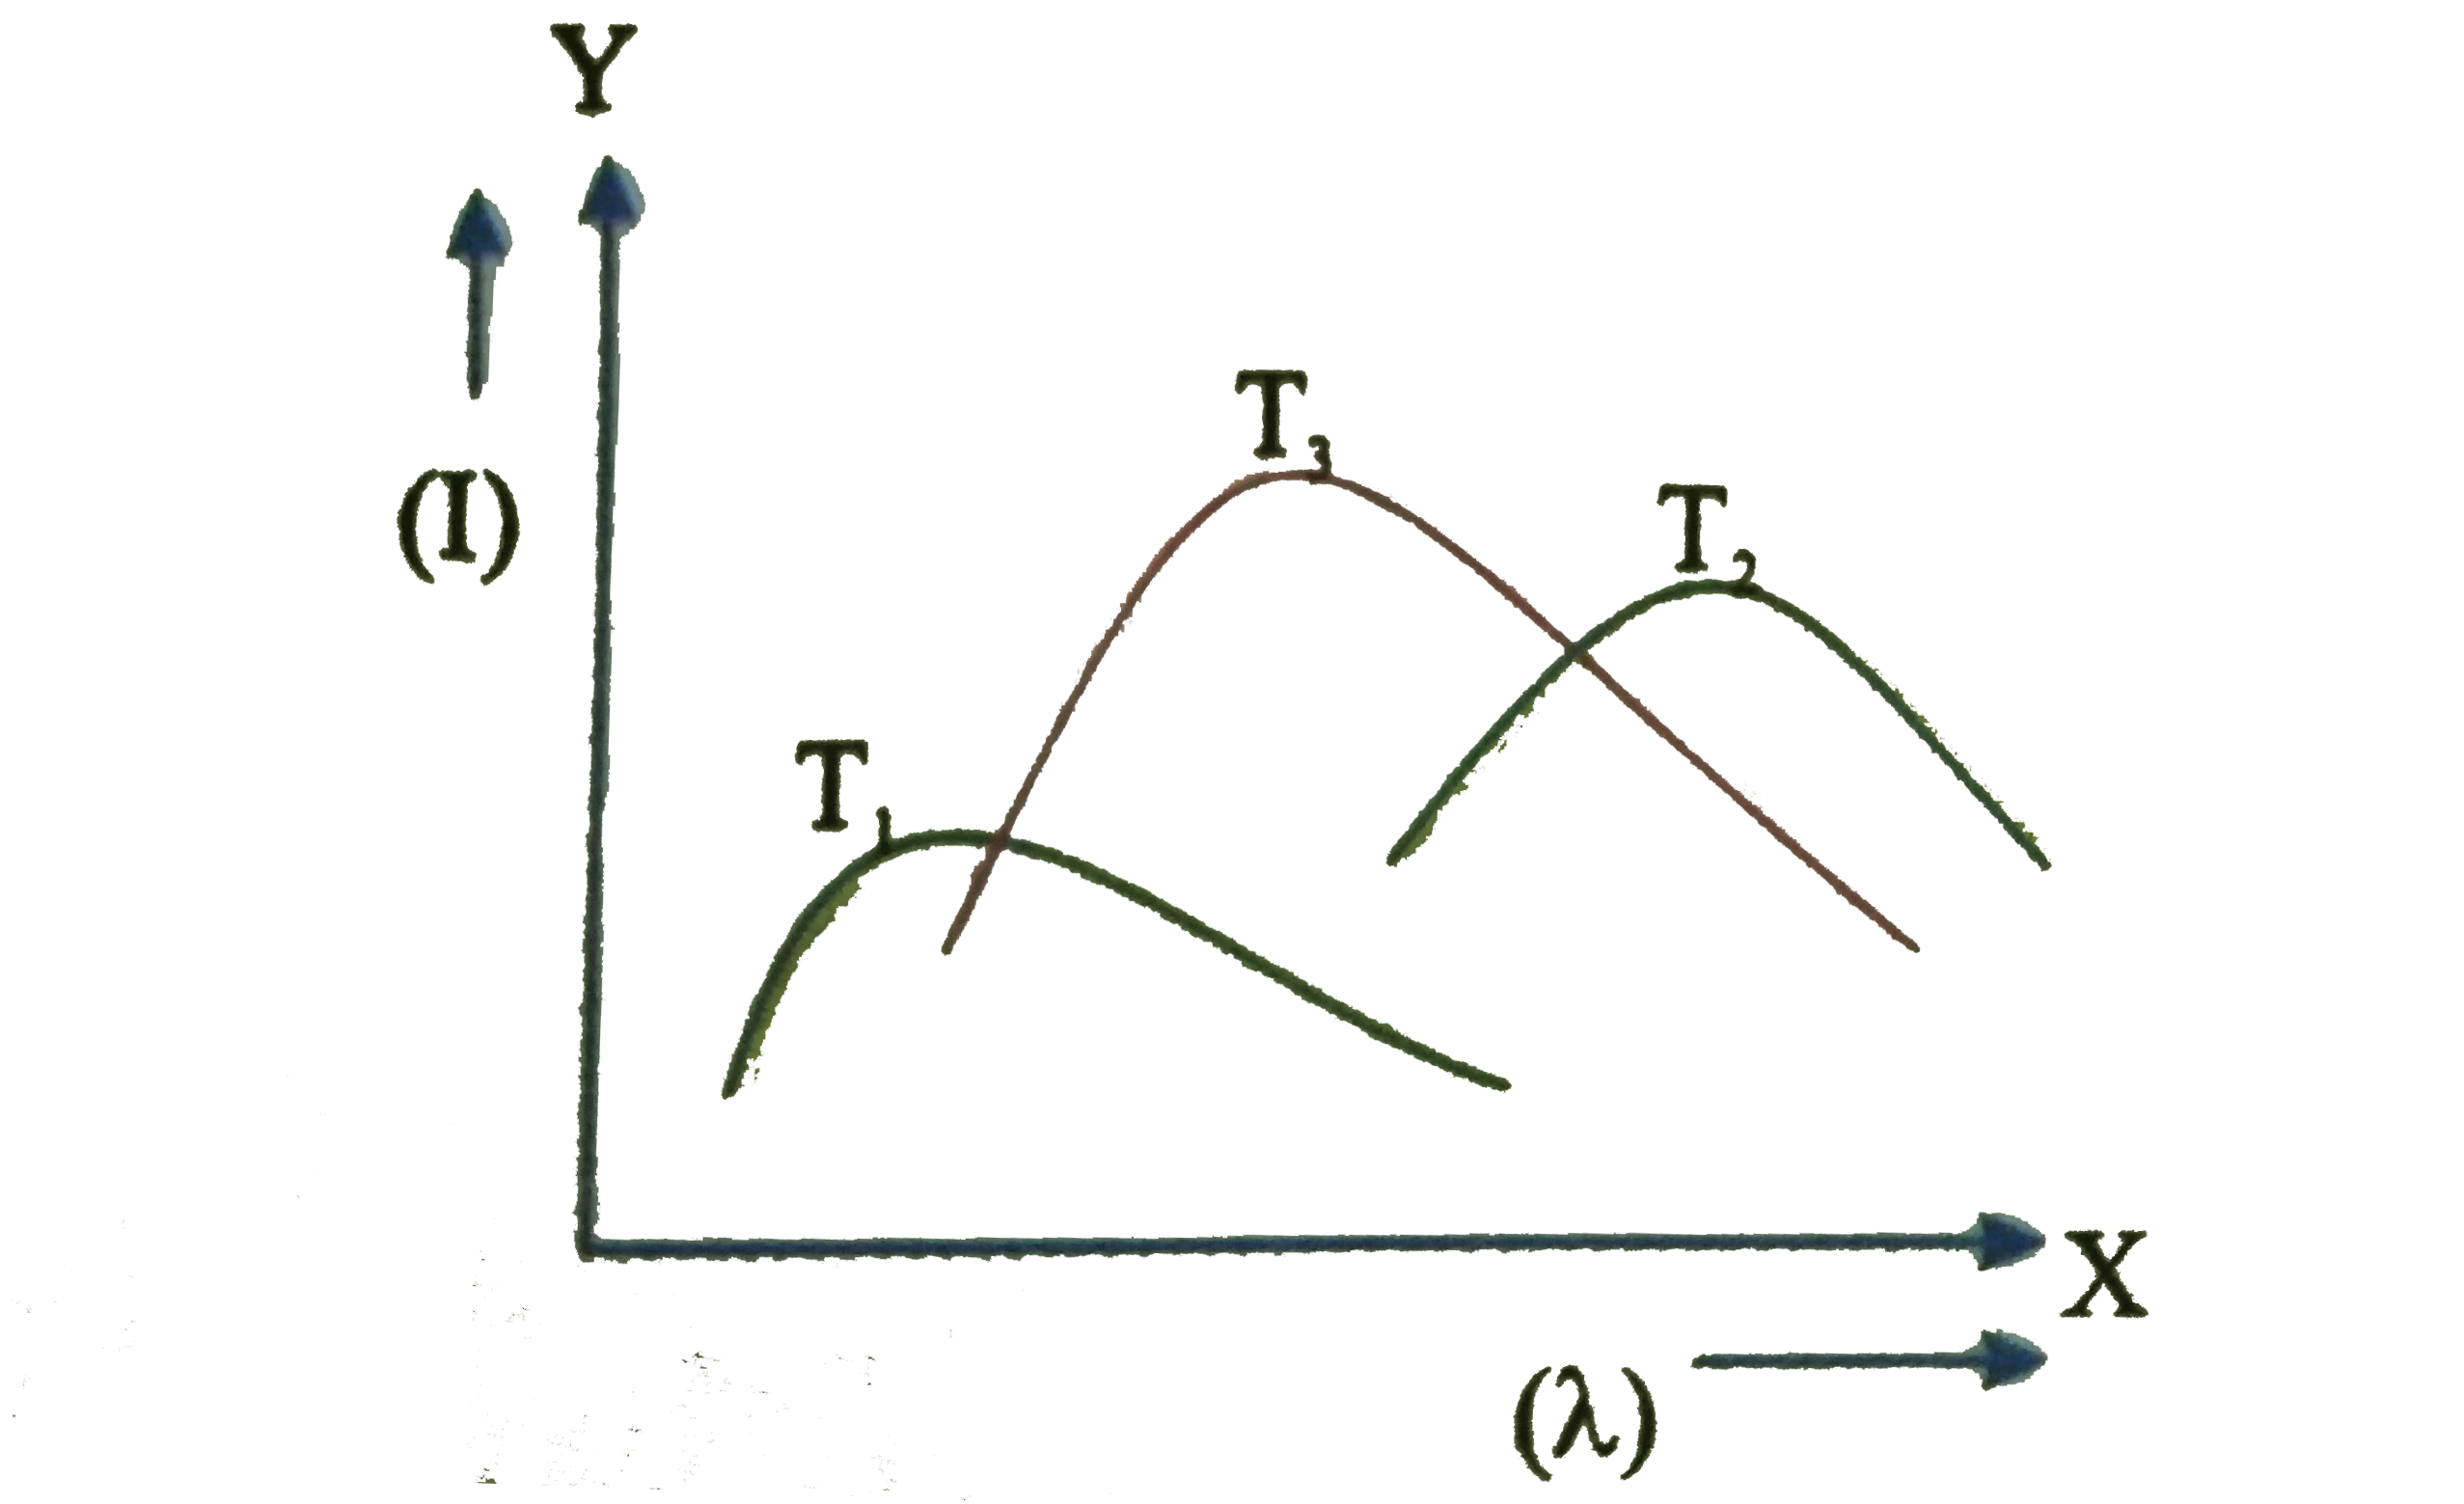
The plots of intensity versus wavelength for three black bodies at temperatures T1,T2 and T3 respectively are shown in Their temperatures are shown in How their temperatures are related ?
 .
.
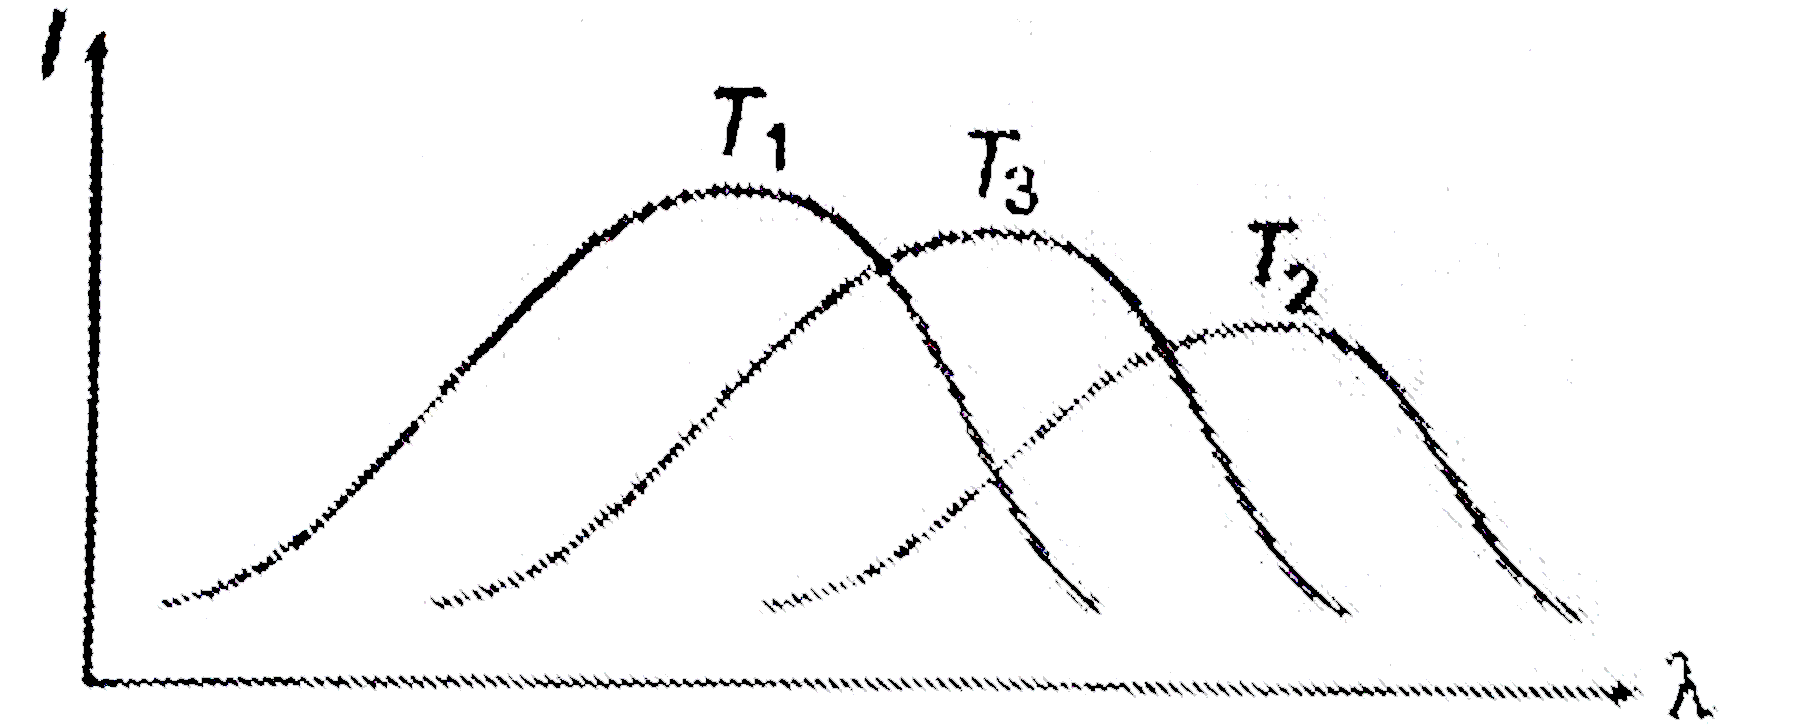
View SolutionThe plots of intensity of radiation versus wavelength of 3 black bodies of temperatures T1,T2 and T3 as shown in the figure, then
View Solution
Knowledge Check
The plots of intensity vs wavelength for two black bodies at temperature T1 and T2 such that T2=2T1, respectively are as shown. Let the energy radiated per second by body I and body 2 be E1 and E2 respectively. Pick up the correct statement(s).
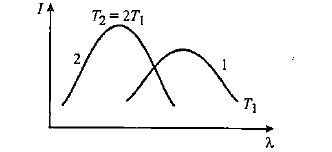 AE1=16E2BE1may be equal to 16 times of E2CThe area under curve 1 and area under curve 2 will be sameDArea under curve 2 is larger than area under curve 1
The plots of intensity v/s wavelength for three at temperatures T1,T2 & T3 respectively. Their temperatures are such that (Decreasing order)
 AT1,T2,T3BT3,T1,T2CT2,T1,T3DT3,T2,T1
The plots of intensity (I) of radiation versus wavelength (γ) of thee black bodies at temperatures T1,T2 and T3 are shown in Fig.7(CF).25. Then,
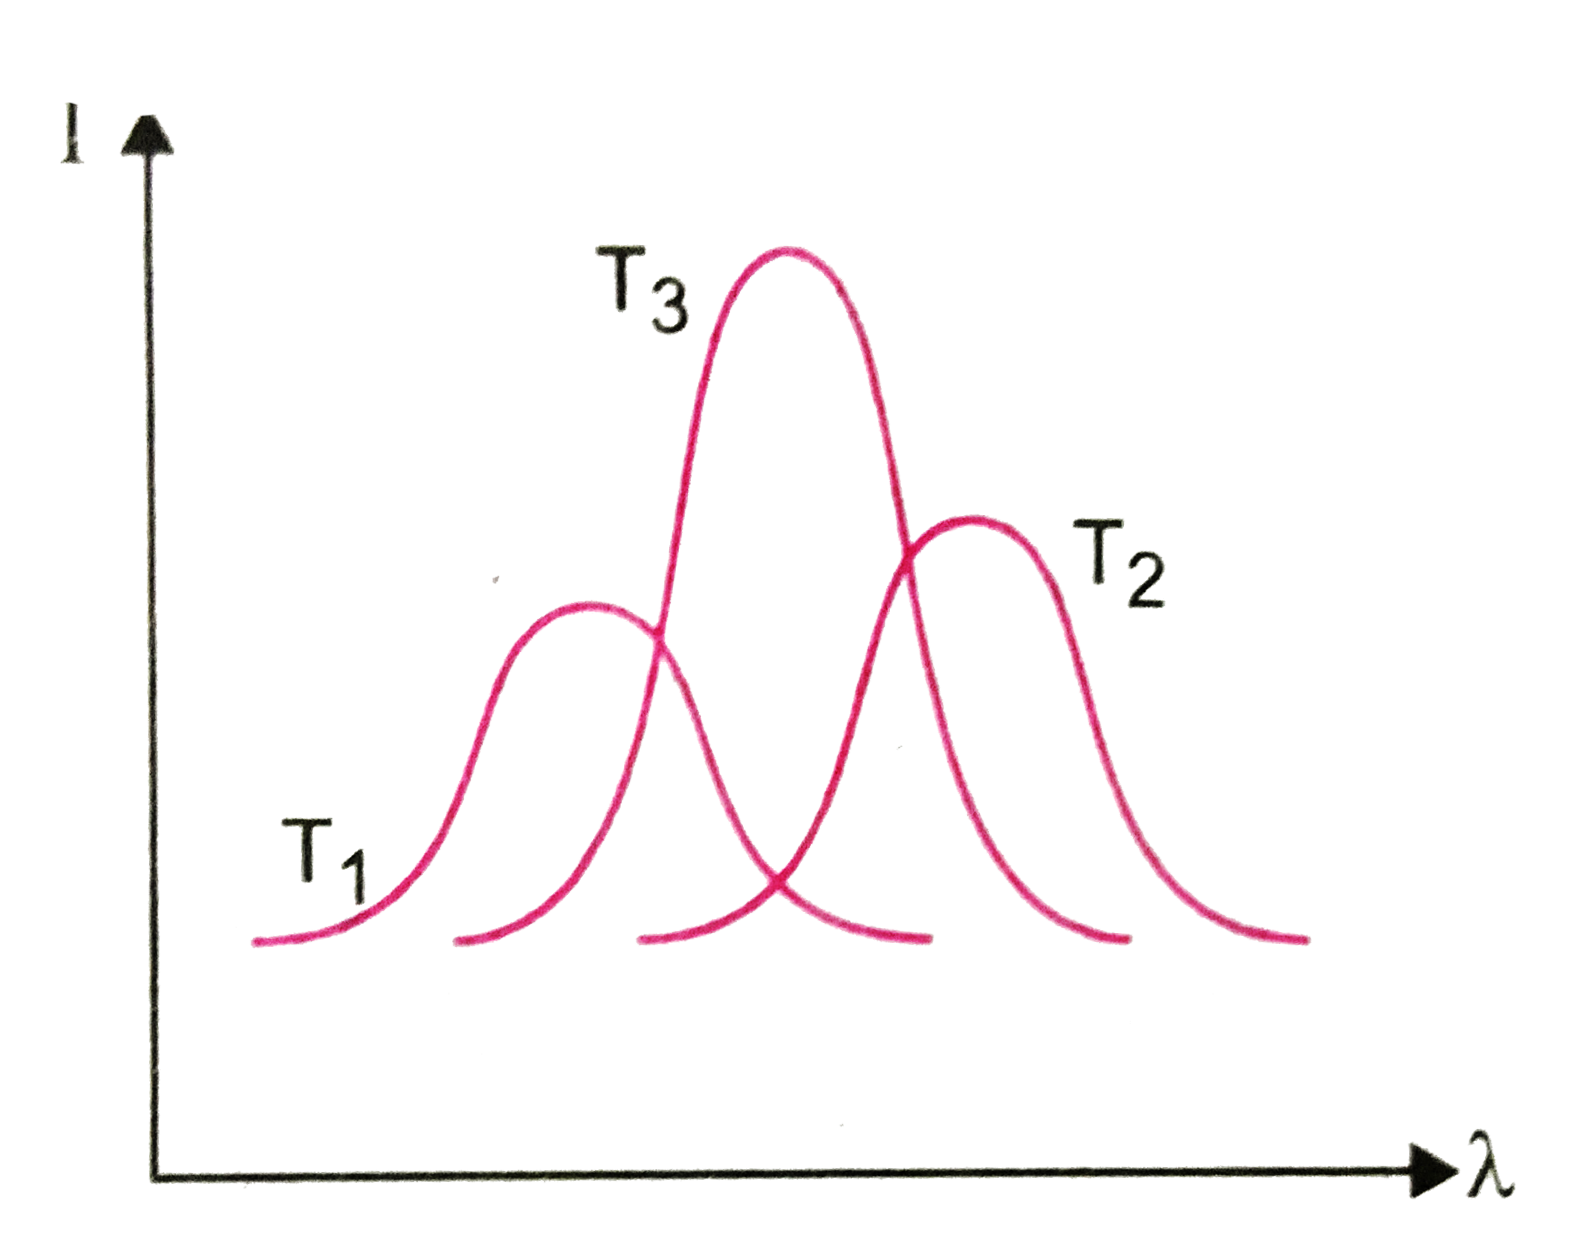 AT3>T2>T1BT1>T2>T3CT2>T3>T1DT1>T3>T2
Figure shows graphs of pressure versus density for an ideal gas at two temperatures T1 and T2 Then
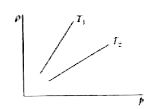
View Solution
Temperature T1andT3 represents respectively:
View SolutionThree isothermal plots (P versus V) A, B and C are plotted at three temperature T1,T2andT3 respectively
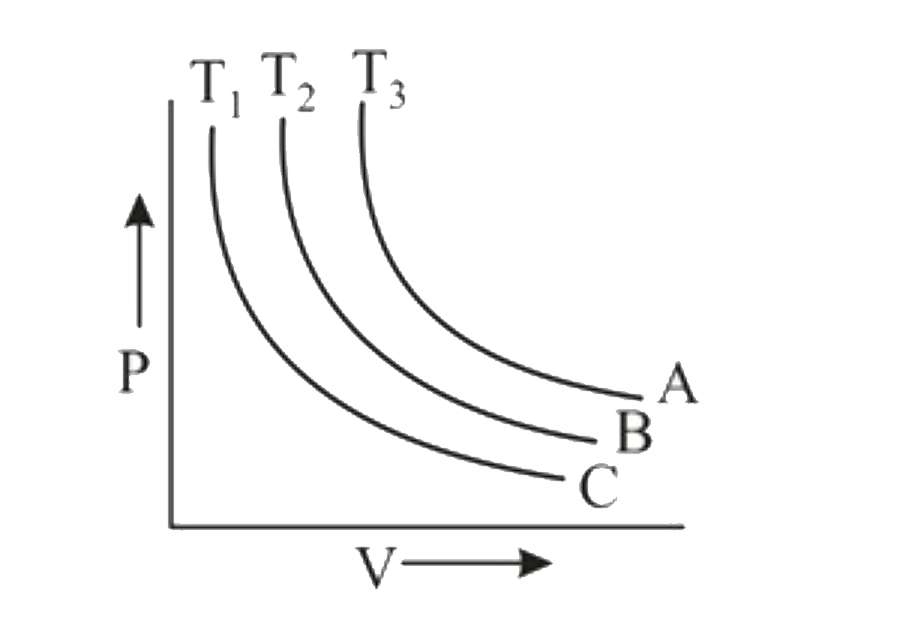
The correct order of the temperature will be
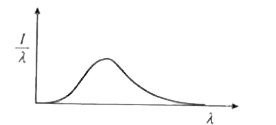
View SolutionThe graph shows the variation in radiation intensity per unit wavelength versus wavelength for a perfect black- body at temperature T. Complete the following statement: As the blackbody temperature is increased, the peak in intensity of this curve
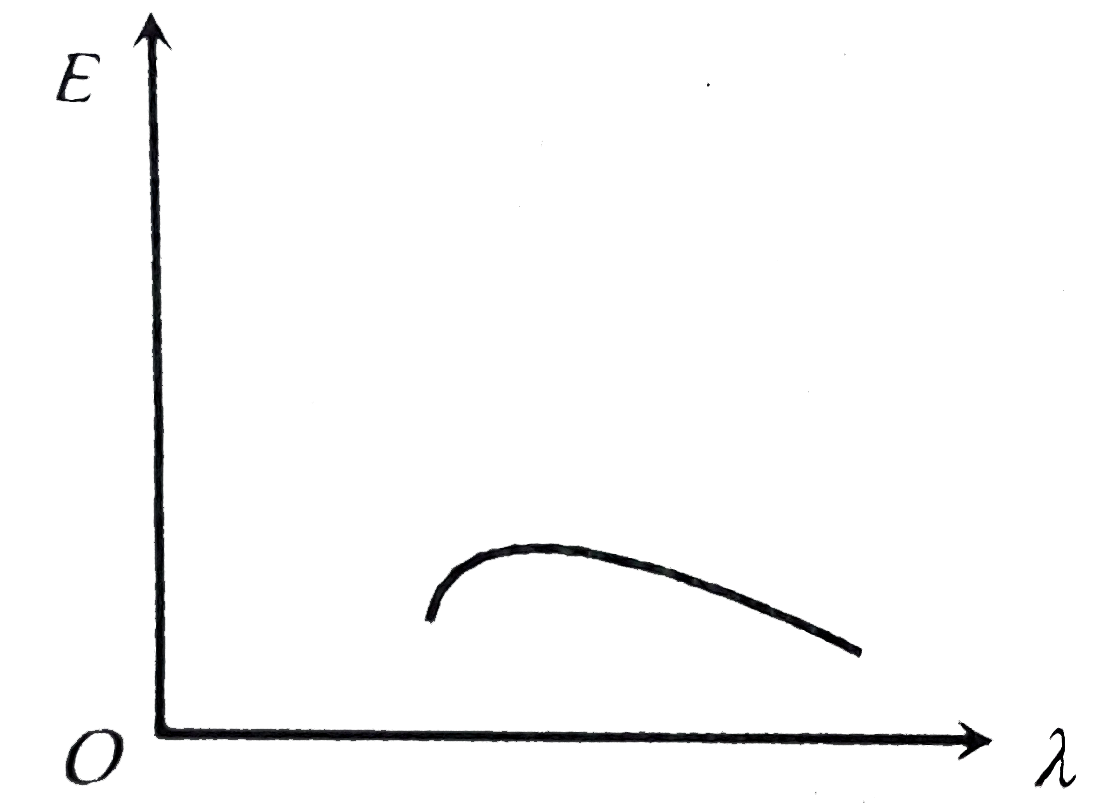
View SolutionThe energy distribution E with the wavelength (λ) for the black body radiation at temperature Kelvin T is shown in the figure. As the temperature is increased the maxima will
View Solution

